RTY - Russell2000 e-mini s/r zonesHello traders,
Description of the analysis:
Trade what you understand, trade carefully and sparingly according to the business plan.
About me:
Hi, my name is Jacob Kovarik and I´m trading on stock exchange since 2008. I started with a capital of 3000 USD. My first strategy was based on OTM options. (American stock index and their ETF ). I´ve learnt on my path that professional trading is based on two main fundaments which have to complement each other, to make a bussiness attitude profitable. I´ve tried a lot of techniques and many manners how to analyze the market. From basic technical analysis to fundamental analysis of single title. My analytics gradually changed into professional attitude. I work with logical advantages of stock exchange (return of value back to average, volume , expected volatility , advantage of high stop-loss, the breakdown of time in options, statistics and cosistent thorough control of risk). At the moment, my main target is ITM on SPM index. Biggest part of my current bussiness activity comes from e mini futures (NQ, ES). I´m trader of positions. I´m from Czech republic and I take care of a private fund ($4.000.000 USD). During my career I´ve earned a lot of valuable experience, such as functionality of strategies and what is more important, control of emotions. Professional trading is, in my opinion, certain kind of mental training and if we are able to control our emotions, accomplishment will show up. I will share with you my analysis and trades on my profile. I wish to all of you successul trades.
Jacob
Russell2000

Is RUT uptrend a ZZ correction? Please commentI am definitely not an expert in Elliott Waves but for the first time I kind of see some patterns in the RUT futures.
The uptrend seems like a ZZ 5-3-5 typical corrective wave. If this confirms, it would mean it is part of a bigger ZZ corrective wave.
I'd like to have some feedback on this...
Thanks in advance!!

June 7 Market Update | Technical, Fundamental, NewsDescription:
An analysis for the week ahead.
Points of Interest:
ATH; Gap Above; Gaps and VPOCs Below; Absence Of Stronger Sellers.
Technical:
Risk-on sentiment in all major indices. Despite the Nasdaq-100 surpassing it’s all-time high, its moves have become more muted, signaling a rotation from the bigger technology- and innovation-driven companies to energy, transportation, financials, small caps, and so on.
Monday came after an end-of-week flush and a close at the highs. Monday’s overnight action was supported with buyers lifting into the open.
Tuesday’s open seemed exhausted, with some heavy offers developing at and above $3075. Later, the S&P 500 traded down to $3050, an area of resting liquidity, before closing higher.
Wednesday’s session squeezed higher into $3111, came down to some resting bids at $3090, and then buyers closed the range, again.
Friday opened on a massive gap, exacerbated by the May jobs report. The session ended up balancing at and around the $3200 strike.
Putting everything together, the picture points to further upside, but it’s obvious that cracks are beginning to form as indicated by the mechanical, short-term momentum-driven activity going on. As long as value shifts higher and liquidations fail to generate any follow through, then the bullish narrative remains.
Scroll to bottom of document for non-profile charts.
Key Events:
NFIB Small Business Optimism; JOLTS Survey; Wholesale Trade; CPI; PPI; Initial Claims; Import Prices; University of Michigan Sentiment Survey; FOMC Meeting.
Fundamental:
Absent a second wave and geopolitical turmoil, momentum will push markets higher. bloom.bg
Despite government measures, COVID-19 is wreaking havoc on Latin America. bit.ly
Canada adds 290,000 jobs as restrictions on business are loosened. reut.rs
The U.S. economy added jobs in May with the jobless rate falling to 13.3%. reut.rs
The Senate loosened the rules small businesses must follow when applying for PPP. bit.ly
The personal care, restaurant, entertainment, and leisure industries are recovering. bit.ly
Non-white communities realize un-equal recovery, worsened by low liquidity and savings. wapo.st
YouTube’s growth paints a bullish picture for Google parent Alphabet. bit.ly NASDAQ:GOOGL NASDAQ:GOOG
Corporate bond yield spreads reflect expectations of a business cycle upturn. bit.ly
Easing of capital outflows from ASEAN markets reduced liquidity pressures. bit.ly
China’s manufacturing returned to trend, but the consumer sector is still lagging. bloom.bg
Repression, or forced lending to the government at low rates, may be bullish. bloom.bg
By the end of 2020, earnings will be higher than they were in 2019. bloom.bg
Valuation methods pin fair value for the S&P 500 Index between $2,200 and $2,800. bit.ly
Low rates rationalize the outperformance of growth companies. bit.ly
Fed’s balance sheet expansion may slow down inflation. bit.ly
Expensive stocks have not reached levels seen during the tech bubble. bloom.bg
Eurozone corona-bonds would help euro-denominated assets outperform. bloom.bg
OPEC+ agrees to one-month extension of output cuts. reut.rs
Ford is evaluating the need for office space. reut.rs NYSE:F
Remote work to spark a housing boom in the suburbs and smaller cities. on.wsj.com
Amazon plans summer sale for June 22 to jumpstart sales after demand hit. cnb.cx NASDAQ:AMZN
‘Nuclear Option’: U.S. could cut Beijing from the dollar payment system. bit.ly
Sentiment: 34.6% Bullish, 26.6% Neutral, 38.9% Bearish as of 5/31/2020. bit.ly
Gamma Exposure: (Trending Higher) 4, 239, 083, 647 as of 6/6/2020. bit.ly
Dark Pool Index: (Trending Higher) 45.2% as of 6/6/2020. bit.ly
Product Analysis:
S&P 500 (ES): AMEX:SPY TVC:SPX AMEX:SPXL
Nasdaq 100 (NQ): NASDAQ:QQQ TVC:NDX NASDAQ:TQQQ
Russell 2000 (RTY): AMEX:IWM TVC:RUT
Dow Jones (YM): AMEX:DIA TVC:DJI
Gold (GC): AMEX:GLD
Crude Oil (CL): AMEX:USO AMEX:DBO AMEX:USL
Natural Gas (NG): AMEX:UNG
Treasury Bonds (ZB): NASDAQ:TLT
Disclaimer:
This is a page where I look to share knowledge and keep track of trades. If questions, concerns, or suggestions, feel free to comment. I think everyone can improve, especially me.
In no way should this post be construed as investment advice.

OIL GOLD RUSSEL DXY6.5.20 Multiple markets. Examples of how taking price action into account saves money.


RUT 2nd Half Scale in RUT us forming an extended wave v that points the wave (v) upside target of 161.8% retracement at 1430 level. Wave v must hold at 1542 to the the Corrective Flat Pattern valid. Expect this terminal rally into our final resistance zone before the decline starts.
We are looking to scale in with 2nd half of bear put butterfly. For now, the 1481 should offer massive resistance that setups for a 10% decline. New Butterfly Spread 1330/1150/1030 Put Debit Butterfly expiring Aug 31st 2020.

SPX / DJI / NDX / RUT (Road to new highs?)US stock indices. Road to new highs?
Please, don't forget to like and follow.
Thank you.

IWM Shorts Covered (Risk-free) 20:50:09 (UTC) Thu May 28, 2020Will remain open with stoploss at breakeven. My short position has been covered.
20:50:09 (UTC)
Thu May 28, 2020

SPX - lock in your profitRisk vs Reward. Some sort of top forming. Yes, it could go higher but it's about Risk vs Reward. I am taking profit here and accumulating some short positions.

US Tech stocks lagging in recent trade The Nasdaq was relatively weak yesterday compared to most stock indices with the Nasdaq:Russell 2000 (US small caps) ratio drifting towards it's lowest level in 2 1/2 months.
This could be seen as logical as lockdowns ease and the relative advantage of big tech vs the rest is eroded somewhat.
No trade here for me as a spread but worth watching if trading either the Nasdaq or Russell 2000 outright

#IXIC ANALYSIS.. BE CAREFUL!.. We see a huge bearish divergence in monthly chart of #IXIC.. Be careful about indices.. I firmly believe that we will see a strong wave of sales in the global indices.. Big Crash is coming.. Markets will become very interesting after 4,5 months, we will wait and see..
Please do your own due diligence when it comes to trading.. Invest at your own risk..
I wish you all the best..


Russell 2000 (Real US economy) vs. Nasdaq (Tech stocks)Easier to explain S&P 500 rising so much with massive job losses when compare with Nasdaq Comp and Russell 2000

RUT Wave Count Update (Still Keep our -ve Delta Flies) RUT loosing momentum on current levels, our Aug 31st flies are moving against us but the wave count is still valid, so we're looking to scale in 2nd half with more -ve delta flies if RUT continues this extended move higher.


Elliott Wave View:Russell 2000 (RTY) Reaching Short Term SupportAs a larger context, the rally in Russell 2000 (RTY) from 3.19.2020 low took the form of an impulsive structure. Up from there, wave (1) ended at 1180.3 and wave (2) pullback ended at 1029.7. Index then resumed higher in wave (3) and ended at 1265.6 and wave (4) pullback ended at 1148.5. The final leg wave (5) ended at 1374. This move also completed wave ((1)) in higher degree and ended cycle from 3.19.2020 low. Wave ((2)) pullback is in progress to correct cycle from 3.19.2020 low in 3, 7, or 11 swing before the Index turns higher again.
The 1 hour chart below shows the correction in wave ((2)). The internal subdivision is unfolding as a zigzag Elliott Wave structure. Down from wave ((1)) high at 1374, wave (A) ended at 1220.1 as an impulse in lesser degree. Wave 1 of (A) ended at 1353.6, wave 2 of (A) ended at 1370.60, wave 3 of (A) ended at 1236.5, wave 4 of (A) ended at 1258.80, and wave 5 of (A) ended at 1220.10.
Up from there, wave (B) bounce ended at 1341.6 as a zigzag in lesser degree. Wave A of (B) ended at 1303.7, wave B of (B) ended at 1245.6, and wave C of (B) ended at 1341.70. Wave (C) is now in progress as 5 waves impulse and can see more downside to reach 1150 - 1187 area. This is the 100% - 123.6% Fibonacci extension of (A)-(B). From this area, Index may see buyers for more upside or 3 waves bounce at least.

RUT2k Short Entry (Updated) 20:01:24 (UTC) Wed May 13, 2020See previous trade entry prior to the New York open this morning.
20:01:51 (UTC)
Wed May 13, 2020

Prediction for E-mini index futures from 11 may 2020this is the prediction of how index futures may go for next week starting 11 May 2020
as you can see there are perfect elliot impulse wave (12345) then correction wave ( ABC )
we are going to phase C this week
so be prepare (to short trade?) !!!

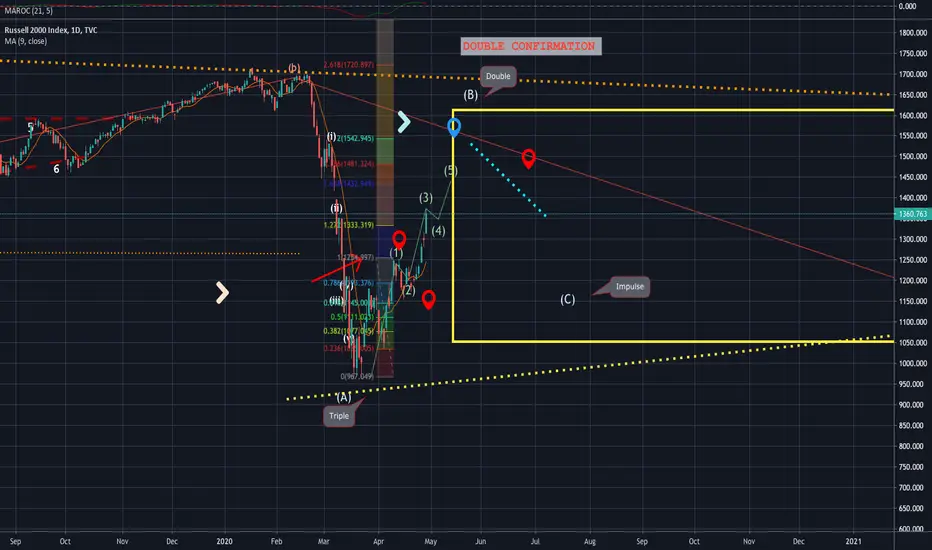
RUT signficant resistance ahead The same predicament exists in the RUT as the SPX. Is this 5-wave impulse currently labeled as wave (B) actually all of higher degree wave (2)? A move back below 1200 suggest the shown count is correct. We are looking for a completion of wave C with a decline lower towards 1000.

Russell 2000 Index, Weekly Daily Chart Analysis For April 27, 20Technical Analysis and Outlook
The small-cap Russell 2000 index gained 2.2% for the week. The index hit our uptrend movement projection to Inner Index Rally $1,365 and Key Res $1,350 , respectively, on April 29th. The short term downside support is tapped at Mean Sup $1,250 and prone to go down to Mean Sup $1,185 before thrusting the retest of the Key Res $1,360 .

Divergence in US indicesThe 200 Moving average is commonly used as an indicator of bull or bear stance by the hedge funds, analysts and investment banks.
If price action stays above 200 MA, it is bullish and if below 200 MA, then it is bearish.
In this chart, we can see clearly that only Nasdaq is currently above it while DJIA and Russell 2000 are still bearish. SPX500 recently closed above the 200 MA only to come tumbling down last Friday.
I post a chart last week on how certain US stocks are leading the SPX500 and may not reflect the actual stock market.
Will Nasdaq follow the other US indices and fall below the 200 MA soon ? Or will it lead the rest and charge higher ?
The obvious one is the Russell 2000 with many of the small cap companies facing a tough time coping with the low to zero revenue and still needing to cough out expenses like wages, operating costs, etc.
I expect Q2 results to be worse than Q1 and that may provides us with clearer signals on the stock market thereafter.
I will be watching this chart closely and update accordingly.

AMZNLooking at Amazon on the monthly chart
If you want to know what parabolic looks like, here is a great example.
Internal indicators:
* RSI heavily over bought and creating bearish divergence
* W%R very over bought and embedded
* Histogram has made a Lower Low that hasn't resolved itself yet and also creating bearish divergence
* OBV is still up and healthy due to the amount of money being poured into this asset.
* Many monthly gaps down in price that still are yet to be filled in
* VPVR is extreme running on single ticks ie not a lot of volume was traded on the move up
* Fib study done off the entire range
My opinion:
Just remember that the top still hasn't been put in yet, so this could still run higher. This is just a reminder that this asset is very over bought and people should be thinking twice about taking a long setups or investing in it long term. From the bottom of the range to the top AMZN has done approximately 18,000% (let that sink in) without a healthy retrace. We also have to take into consideration that AMZN has been in a range for 80% of its existence and has now been trending upwards for 20% of the time. (Investopedia) 80-20 Rule-
The 80-20 rule says markets trend about 20% of the time and spends the other 80% grinding through trading ranges, pullbacks, and other counter-trend action that tests boundaries. Price rate of change rises in trends, attracting the trend trader and falls in trading ranges, attracting the swing trader.
If you like what I do, drop a comment, tell me what you think and don't forget to like and subscribing. Thanks :)
Also don't forget to "plan your trade and trade your plan"

RUT wave B Rally facing SIGNIFICANT RESISTANCE RUT wave (B) rally on-going moving towards the underside of a 4 decade support-turned resistance at 1432-1542. If this is the case, bulls need to get a move on to keep the motive-looking effort going. Will the coming bear market continue this trend and see bear markets in both as US debt is shunned by global central banks as a store of value?