US2000 Shot term Price - one Fib for clarity Levels, and price projections, lets see can we hold it, for new highs, or we make a new low. :)
Russell2000

Russell 2000 IWM Cup & Handle + Ascending ChannelAs posted in my previous idea, the Russell 2000 was at strong resistance and if we closed above, we should have a bullish bias until we see a topping reversal pattern. We did close above that resistance and even retested the 50 day moving average, so it is looking bullish for now.
The price has also broken to the top of a cup and handle pattern however we have not had a retest, yet.
The price is also currently at the top of an ascending channel. The price may find some resistance here and go back to retest the cup and handle breakout. If the breakout holds, that gives us a target of ~154.
There is a similar cup and handle pattern of SPY which is also included in my related ideas below.

Stocks Peaked 20 Years Ago. US Perma-Bulls are Chasing a BubbleIn nominal terms, US stocks have gone higher and higher over the last 20 and 30 years. This is priced in US Dollars.
Priced in terms of real money, stable money, the US stock markets and the US real economic growth peaked 20 years ago.
Over the last 20 years we've printed a crap-ton of money to paper over the losses and make ourselves feel richer, but it's all been an illusion. A money printing fueled bubble.
And the most recent cycle peaked in September of 2018, when the Russell first entered into a bear market and when the gold bull left the train station. In terms of what's happening right now: The Russell is sitting at the top end of its range right underneath major resistance. Without big stock buybacks driving the market there won't be enough buying power to send it to new highs.
The Fed can print as much money as it wants but it can't stop a massive global shock. Money velocity is at ZERO. Doesn't matter how much money you print, you can't fix a solvency problem with more liquidity. You can only buy yourself short slivers of time.
Its only a matter of time before economy gravity is respected and the global markets, including the US equities, get absolutely cratered.

Russell 2000: Will Resistance Prove True? Trump's PriceIn technical analysis, it is said that "past support = future resistance." Looking at a chart of the Russell 2000, we see there is a level of resistance that marks the date of Donald Trump's election. This lines up with a level of resistance.
Will it hold?
If it holds, then will the Russell 2000 see lower prices in the weeks to come?
Some say that the bottom is in. Of course, I have no idea.

Daily Review: ETH, IWM, and SPYNo fireworks followed the close as there was little follow through on the gap up this morning in U.S. markets. The cryptocurrency markets, on the other hand experienced some relief led by Ethereum and that is where we begin.
Here is a 4-hour chart of ETH/USD. As in stands, Ethereum is within a rising wedge patter. If you follow Elliott wave, this type of wedge may be categorized as an ending diagonal due to the overlapping of waves.
The month of April has been about all markets being in lock step. The chart below is the correlation coefficient of Ethereum and the SPY, the S&P 500 ETF. With resistance approaching for Ethereum could cryptocurrency give us a heads up when U.S. markets top?
Below is a chart of the IWM, the Russell 2000 ETF. Unlike Ethereum, the IWM has not broken out yet. Though, I think it may be close. Since April 13, the IWM has been consolidating in a bull flag pattern with a measured target of $128.59. End of week rally incoming?
Below is a 1-hour chart of SPY. The at the closing bell the one-hour chart presented with a bearish shooting star. Any reversal at the open tomorrow may be worth buying with stops at $272.14, which marks yesterday's low. If the it is taken out, it would invalidate continuation to the upside in my view.
The broad markets have been in lock step for what seems to be the entire month of April. As long as this pattern continues we can continue to lean on market leaders such as Ethereum as an indicator of the impending end of this historic rally.

Russell 2000 Might Have Another Bounce LeftHere's why I'm not buying this selloff necessarily.
1. Famous double double bottom setup
2. .5 - .618 retracement done
3. Closed above support

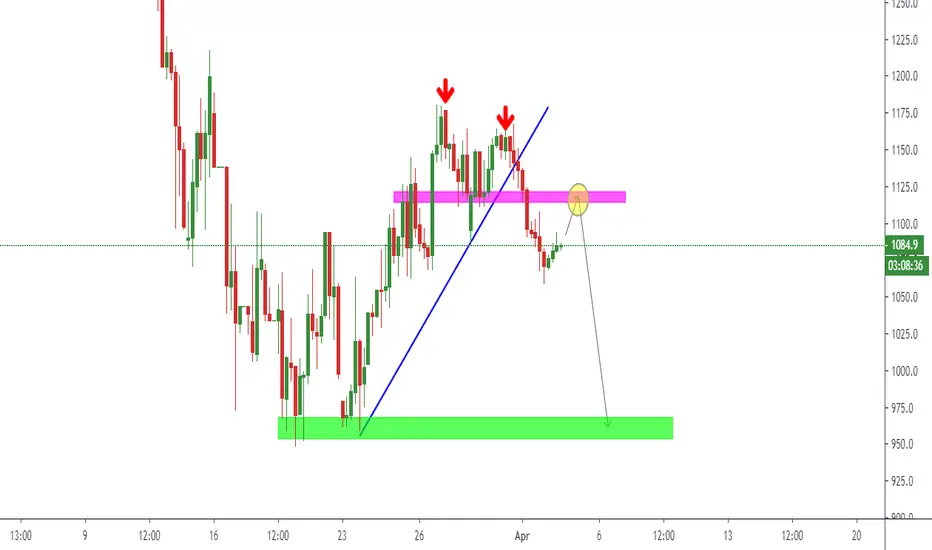
Russell 2000 IWM hitting strong resistanceThis is a simple analysis of the Russell 2000 (IWM).
Today IWM filled the gap from the March 11th drop and bounced off resistance perfectly. Until Russell is able to overcome this resistance and use it as support, assume it will drop from here.
If I had to guess a direction, I think the odds of it going down are better than it going up, but I'm not a fortune teller. I only look for areas of opportunity where risk:reward is in my favor.

Russell 2000 Target 871Market ready for another vicious leg down. Russell 2000 could potentially touch 871.

Are you ready for a PUMP & DUMP ? (Russell 2000)Small caps looking a lot like Ethereum.
Everyone tried to count 5 waves up but then another wave comes into the market and trolls all the early bears.
Over 66% of people think we will go into a GREAT DEPRESSION 2.0, And trust me we will but not quite yet.
Many stocks haven't made topping patterns & others are painting false tops.
I am bullish.
Stay profitable
- Dalin Anderson

RTY - e-mini Russell2000 main S/R levelsHello traders,
Description of the analysis:
I have identified important s/r levels that the market should respect and respond to. Currently, the market is undergoing rotations with possible declines as the VIX index is still in extreme bands.
Be careful to trade and invest sparingly!
About me:
Hi, my name is Jacob Kovarik and I´m trading on stock exchange since 2008. I started with a capital of 3000 USD. My first strategy was based on OTM options. (American stock index and their ETF ). I´ve learnt on my path that professional trading is based on two main fundaments which have to complement each other, to make a bussiness attitude profitable. I´ve tried a lot of techniques and many manners how to analyze the market. From basic technical analysis to fundamental analysis of single title. My analytics gradually changed into professional attitude. I work with logical advantages of stock exchange (return of value back to average, volume , expected volatility , advantage of high stop-loss, the breakdown of time in options, statistics and cosistent thorough control of risk). At the moment, my main target is ITM on SPM index. Biggest part of my current bussiness activity comes from e mini futures (NQ, ES). I´m trader of positions. I´m from Czech republic and I take care of a private fund (700 000 USD). During my career I´ve earned a lot of valuable experience, such as functionality of strategies and what is more important, control of emotions. Professional trading is, in my opinion, certain kind of mental training and if we are able to control our emotions, accomplishment will show up. I will share with you my analysis and trades on my profile. I wish to all of you successul trades.
Jacob


SP500 VS RUSSELL 2000SP500 setting up for another parabolic over performance of the Russell. The blue lines are support and Red is resistance. I expect a replay of previous parabolic runs.
Not financial advice. Thanks guys.

Russell 2000 - ShortThe stimulus bill has been passed and loans will begin to be allocated into the economy. The goal of this money is to keep business alive, but there are no clear guidelines on how this stimulus will be rolled out.
After the current bounce (my assumption), the sellers are back. Prior to the corona virus, the Russell was already showing signs of weakness.
As the virus continues to spread, my view is that the stimulus won't do much until businesses are able to open back up.

Equity Markets showing Reversal on the 4 Hour?First off is the Nikkei 225. We had a break out earlier today which also confirmed a head and shoulders bottoming pattern. The lower high and lower lows began to exhaust. We are now awaiting for our first higher low swing here to confirm this uptrend.
Second is the German Dax. We had our breakout, and are now approaching the major 10,000 level. From here, would like to see 10,000 tested before a pullback and then a breakout creating a head and shoulders pattern and giving us a higher low to confirm an uptrend.
The Russell 2000 is close to the Dax set up. We are watching for this breakout. Similar to the Dax in a way that we would like to see a move higher before a pullback and then a head and shoulders confirmation breakout. The Russell may also be a leading indicator on what we will see with the larger US equities.

Tonight's Russell Futures PlaybookPlay the range until one of them breaks, then play the trend from there.

THE ONLY CHART THAT MATTERS!Today I made a video called 'BITCOIN vs STOCK MARKET BUBBLE 2020' (link in signature) -
Inside a month we have nearly liquidated more assets than what was lost during the entire .Com bubble!
There is a chance to catch within a few months around 16-17k - however - the market won't fully be recovered and healthy again until we do a full reset all the way down around 12,000.
If that indeed happens then by the time its all said and done Wall Street would have lost more money than the .Com Bubble and Great Recession combined!
But hey at least the charts show that 2029-2031 should be booming again!
Peace & Love -
BK

IWM - a bit of bounce and finish down?3/9/20
IWM - Russell 2000 ETF. This idea is a follow up of previous post. I am looking for a bounce and finish down.

RUT Consolidation Pattern Through 2020? We are looking to trade aggressively with low risk high reward Unbalanced butterflies throughout 2020 with this potential consolidation pattern in the Russell throughout 2020

IWM - Russell 2000 ETF. A-B-C down possibleIWM - Russell 200 ETF. 2/29/20
Since 2018 December low, Russell 2000 index for small caps have not recovered unlike the larger caps like SPX and Nasdaq.
At this point, it's possible to consider something like this.


Vista cierre semanal indices americanosVista cierre semanal de los indices DOW S&P Nasdaq y RUT. Corrección más del 10%
