E-Mini Russell 2000 One Hour Long $790.00The E-Mini Russell 2000
One hour time frame has shifted from side ways
movement to a down channel. The market is at
the bottom of the channel and is showing signs
the market could push bullish towards price point
1566 about +158 Ticks away. Which is around
$790.00 of profit opportunity with one E-Mini
Contract. Stops can go below the bottom of the
channel.
Russell2000

IWM Has No More Upside - Longterm Target Is 112 USDCurrently we are in a ABCDE formation down. Next target is 141 USD, where it will make a corection up to 151 USD for the (e).
In my last post i noted that transportations are also expecting a correction down, which should take IWM with it. Therefore the larger target of IWM is 112 USD. Best case Scenario we are looking at a target of 99 USD.

SImple The Stochastic Pop was developed by Jake Bernstein and modified by David Steckler, who wrote a corresponding article for Stocks & Commodities Magazine in August 2000. Bernstein's original Stochastic Pop is a trading strategy that identifies price pops when the Stochastic Oscillator surges above 80. Steckler modified this strategy by adding conditional filters using the Average Directional Index (ADX) and the weekly Stochastic Oscillator. This article draws on both methodologies to present another modified version of the Stochastic Pop suited for SharpCharts.
Once the trading bias is established, Steckler used the Average Directional Index (ADX) to define a slowdown in the trend. ADX measures the strength of the trend and a move below 20 signals a weak trend. Steckler preferred ADX below 15, but would use 20 as well. A high and rising ADX signals a strengthening trend, while a low and falling ADX indicates that the trend is weakening. On the chart below, 14-period ADX on the daily chart shows a weak trend when it moves below 20. Notice how Gap (GPS) moved into a trading range as ADX dipped below 20 twice (yellow areas).
the obv volume is very important for to determinated the market trend...

Week ending 19 July 19Weekly Consolidation: 1517 - 1586
Daily Consolidation: 1546 -1587
Daily HMA indicates "Bear/Short"
Weekly HMA indicates "Cover Longs"
Projected upcoming weekly range: 1519 - 1580

Neutral Update 19 July 19Consolidation range re-established by run-up.
Range now solidified as: 1546 - 1587

Bearish Update 18 July 19The one index that has been showing true signs of the economy.
Price to HMA position is indicating short.
Price projection from the Bull RSI returning into neutral territory indicating weakening strength is targeting 1526.66
The consolidation range which has lasted a couple of week is broken to the low side.

Short $US2000 $IWM For JUL 15 - AUG 20 Seasonal TradeWe ended the late June to July 15 Seasonal trade with a huge bang... except Russell 2000 lagged terribly. Notice the potential rejection of the June close here along with the top rail of the big wedge.
Seasonality starts July 15/16 and Russell along with DAX are the worst performers.
charts.equityclock.com

RUSSELL (RUT) ON THE VERGE OF BREAK (-OUT OR -DOWN)Simmetrical triangle on the verge of coming to the apex.

EYPT | Range bound Long-Term pattern suggests that after previous dilution, Eyepoint's stock price went range bound for quite awhile before breaking out.
This marks potential accumulation range for anyone looking to build a position in EYPT.
Ranges make for good swing trade positions (especially 20%+ both ways) and a way to average down.
Range low/ highs, range from $1.42 - $1.87 is approximately $0.45 of profit both ways up (~20%+) until EYPT confirms they are adhering to terms of loan with CRG.
Weekly MACD and Stochastics have divergence with stock price. This could infer spring board type action on good news (break below range could cause problems).
Previous quarter showed that $EYPT was on track w/ meeting terms of CRG loan agreement.
positive earning/ ER beat should help satisfy some hedge funds/ big $ investors. I remain cautiously optimistic.
$EYPT could potentially come and test lows of the range within next week. I am looking to use this as a way to add to current position/ swing trade it to highs and lower cost basis on my long-position.
**On the other hand, falling below this range could cause knee jerk reaction/ selloff. I am going to be watching this carefully.
Tip # 7: When trading, It is very important to have a game plan. It is good practice to establish rules to your system (i.e. do you buy in increments?, at what point do you not like the investment anymore? how long are you willing to hold?).
- Please Like and Follow for trade ideas & so I can continue to chart and build my reputation. Thank you in advance =)
Have a Twitter? check out my page for more: @volatilitywatch
Disclosure: I am long EYPT. This is not a note to buy or sell. Please do your homework before investing.
//-----------------------------------------------------------------------------------
Check out current trade in TGTX =) #BULLISH

E-Mini Russell 2000 One Hour Bullish $750.00The E-Mini Russell 2000 One hour time
frame is hitting an up trend line. If the
market bounces bullish the next future
high price should be 1579 about +150 ticks
away.
That is a reward of $750.00 trading one
E-Mini contract at $5.00 a tick.

The time is 11.59.59, SPY-RUS2000-XYT-gold stackAlright everyone here is a clean video of what will soon happen in the markets. I will keep everyone up to date with this situation! 30% drop is on the way.

Week ending 7-12-19Caught in consolidation at both the daily and weekly levels.
July 12 has a weak projection of 1583
The consolidation levels are:
Daily: 1552 - 1586
Weekly: 1517 - 1586
Range for the coming week: 1541 - 1630


RTY One Hour time frame. $850.00The E-Mini Russell 2000 one hour time frame
is in sideways movement. The market is at
the bottom of support price point 1560 and
is showing signs of a potential up push.
A potential entry would be to wait for the
market to close above the counter trend line
bullish. The future resistance price point
1580 about +170 ticks away may be a great
exit for potential profits. About +$850.00
trading one contract.

Monitor with cautionConsolidation has been established with a range of 1548.12 - 1586.77
For the technicians out there who like patterns. A Pivot High was just completed. So, look at the bottom of the consolidation range for your breakout signals.
Anchor bar on the consolidation is a positive bar which suggests a 70% chance of breakout to the top.
Coupled with the pivot high - I would decrease that down to 30%.
This is a mixed bag of directional signals, suggesting the market hasn't decided yet.


Strong Week AheadPersonally endured an internet brown out this weekend. This is getting released late.
Noticed immediate change in strength of the Russell after reorganization.
No new projections this last week.
Bullish going into the weekend.
G20 announcements are exciting for the market.
Expecting a range this week of between 1542.80 - 1629.23

ES1! AB=CD WEEKLYCURRENT LEG SUPPORT A STRONG MOVE DOWN 2700-2500 RANGE
CURRENT DOUBLE TOP
CURRENT OSCILLATION TURNING POINT
WITH A LOT OF HANDS HEAVY LONG SUPPORTED BY CHINA TRADE MEDIA PUMP ES COULD VERY WELL SMACK DOWN INVESTORS 3RD QTR
3000 IS STILL A C>D TARGET
CURRENT MOVEMENT IS B>C
A>B HAS BEEN SATISFIED TWICE WHICH MEANS A DOUBLE TOP

Small caps rejected the high first.Small caps rejected the high before the other indexes.
Indicating a close below the 34 HMA to cover and long positions and prepare to short.
The Bull RSI has indicated a price projection of 1504.95
The BSI has indicated a price projection of 1470.63

E-Mini Russell 2000 One hour time frame +319 ticks BullishThe E-Mini Russell 2000 One hour time frame
entered into an up channel. The market is
now at the bottom of the channel to where the
market could extend to the top. The future
high price could be 1566.80 about +319 Ticks
away which is $1,595.00 for every one contract
traded. I am going to use the tunnel trader for
entry as the market extends to the top.

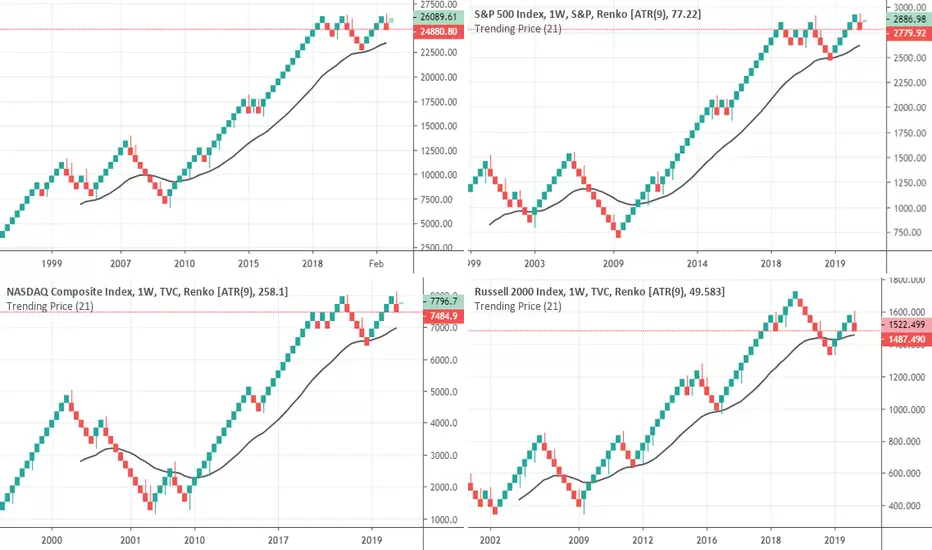
A cautionary tale (commentary)There is an old traders tale that says something to the nature of, if a price tries three times to break a support or resistance level, yet fails, it will retreat the opposite direction.
January 2018, the DJI tried to break above 27,000. It got to 26,616 before it retreated. Not enough strength.
October 2018, it tried again and got to 26,951 before it retreated. It pulled back to 21712 to get a running start in an attempt to break it.
April 2019, it tried for the third time and reached 26,695 before pulling back to 24,248.
Did it finally punch 27,000 hard enough that it just needs a love tap? Or is this last attempt going to be a half-hearted thud before a drop 20,000 or 18,000?
It is difficult to tell.
All the strength indicators reflect that it can get through this level.
DJI is trying to reach 27,058
SP500 is trying to reach 2999
NASDAQ is trying to reach 8178
Russell 2000 is trying to reach 1552
But they are also weak signals. Signals generated while being caught in consolidation so near to the top.
Consolidation so near the summit, it is like being trapped in a room that has filled with water, you have nearly broken through the ceiling but you are running out of breath as you take your last breath from the last few inches left of an air pocket before....... we break through or we drown.
Once we reach this level again, will we become impacted by a tweet? A trade war? An oil embargo? Such as we were in May?
The wind was in the sails that day. The markets all closed the Friday before strong. Yet Sunday evening prior to the Far East opening the markets for us to start a new week. A little tweety bird went out and took all of the markets enthusiasm away.
Yet here we are again. The 26,000 range.
Extreme caution needs to be exercised here - Trade with caution. Double check everything. Monitor your stops, monitor the VIX.
This can be a record year - either as an amazing new start to the bull market. Or the year we stripped 23% - 32% of the market away.
Russell wants out of this boxRussell appears to be tired of being melancholy and has issued a projection out of the consolidation.
It isn't big or aiming for the moon. However, it generated a signal for ~1552.39

Russell says "Meh" to the others rallyRussell 2000 is showing a MEH attitude and holding on to a target of 1328.75
Failing to rise like the other three indexes. Russell seems to be the turtle in the family at the moment.
