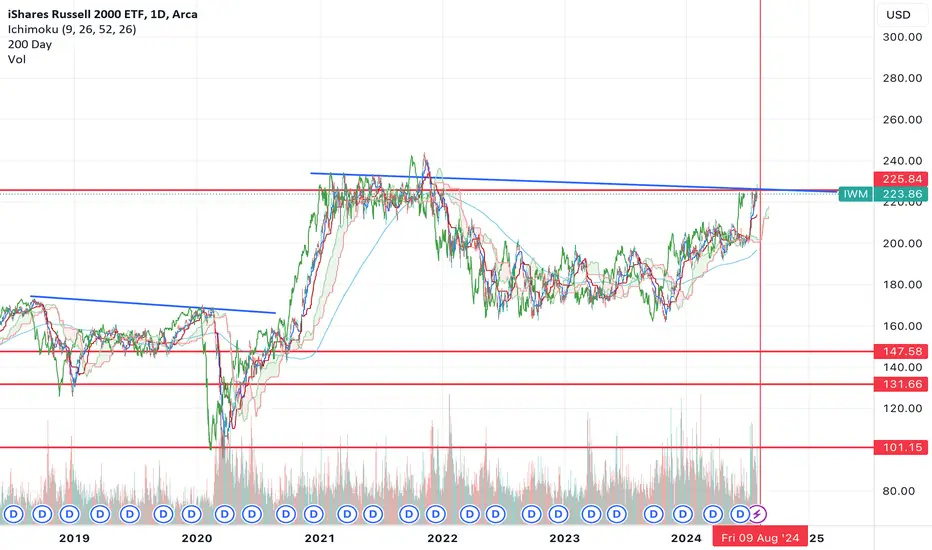
Russell may rock n’ roll on rate cut and soft landing hopesRussell 2000 futures sit on uptrend support, making Friday’s close important following Jerome Powell’s speech at Jackson Hole.
To get excited about US small caps, you need a soft economic landing and lower borrowing costs given many of its constituents are unprofitable and reliant on capital markets. Given Powell will discuss rate cuts and flag confidence in the Fed’s ability to stick a soft landing, it comes across as recipe for upside.
With the uptrend nearby, traders could initiate longs around these levels or even a touch lower with a stop loss below the level for protection. Should the price break 2186.4, there’s little in the way of visible resistance until the record highs.
If the trade works in your favour, consider raising you stop to entry level or higher, providing a free hit on upside. Good luck!
DS
Russell2000

US2000 / Small Cap / Russell Bullish Robbery Plan To Steal MoneyHello My dear,
Robbers / Money Makers & Losers.
This is our master plan to Heist US2000 / US Small Cap / Russell 2000 Market based on Thief Trading style Technical Analysis.. kindly please follow the plan I have mentioned in the chart focus on Long entry. Our target is Red Zone that is High risk Dangerous level, market is Trap / overbought / Consolidation / Trend Reversal at the level Bearish Robbers / Traders gain the strength. Be safe and be careful and Be rich.
Note: If you've got a lot of money you can get out right away otherwise you can join with a swing trade robbers and continue the heist plan, Use Trailing SL to protect our money.
Entry : Can be taken Anywhere, What I suggest you to Place Buy Limit Orders in 15mins Timeframe Recent / Nearest Swing Low
Stop Loss : Recent Swing Low using 2h timeframe
Warning : Fundamental Analysis comes against our robbery plan. our plan will be ruined smash the Stop Loss. Don't Enter the market at the news update.
Loot and escape on the target 🎯 Swing Traders Plz Book the partial sum of money and wait for next breakout of dynamic level / Order block, Once it is cleared we can continue our heist plan to next new target.

Determining Which Equity Index Futures to Trade: ES, NQ, YM, RTYWhen it comes to trading equity index futures, traders have a variety of options, each with its own unique characteristics. The four major players in this space—E-mini S&P 500 (ES), E-mini Nasdaq-100 (NQ), E-mini Dow Jones (YM), and E-mini Russell 2000 (RTY)—offer different advantages depending on your trading goals and risk tolerance. In this article, we’ll dive deep into the contract specifications of each index, explore their volatility using the Average True Range (ATR) on a daily timeframe, and discuss how these factors influence trading strategies.
1. Contract Specifications: Understanding the Basics
Each equity index future has specific contract specifications that are crucial for traders to understand. These details affect not only how the contracts are traded but also the potential risks and rewards involved.
E-mini S&P 500 (ES):
Contract Size: $50 times the S&P 500 Index.
Tick Size: 0.25 index points, equivalent to $12.50 per contract.
Trading Hours: Nearly 24 hours with key sessions during the U.S. trading hours.
Margin Requirements: Change through time given volatility conditions and perceived risk. Currently recommended as $13,800 per contract.
E-mini Nasdaq-100 (NQ):
Contract Size: $20 times the Nasdaq-100 Index.
Tick Size: 0.25 index points, worth $5 per contract.
Trading Hours: Similar to ES, with continuous trading almost 24 hours a day.
Margin Requirements: Higher due to its volatility and the tech-heavy nature of the index. Currently recommended as $21,000 per contract.
E-mini Dow Jones (YM):
Contract Size: $5 times the Dow Jones Industrial Average Index.
Tick Size: 1 index point, equating to $5 per contract.
Trading Hours: Nearly 24-hour trading, with peak activity during U.S. market hours.
Margin Requirements: Relatively lower, making it suitable for conservative traders. Currently recommended as $9,800 per contract.
E-mini Russell 2000 (RTY):
Contract Size: $50 times the Russell 2000 Index.
Tick Size: 0.1 index points, valued at $5 per contract.
Trading Hours: Continuous trading available, with key movements during U.S. hours.
Margin Requirements: Moderate, with significant price movements due to its focus on small-cap stocks. Currently recommended as $7,200 per contract.
Understanding these specifications helps traders align their trading strategies with the right market, considering factors such as account size, risk tolerance, and market exposure.
2. Applying ATR to Assess Volatility: A Key to Risk Management
Volatility is a critical factor in futures trading as it directly impacts the potential risk and reward of any trade. The Average True Range (ATR) is a popular technical indicator that measures market volatility by calculating the average range of price movements over a specified period.
In this analysis, we apply the ATR on a daily timeframe for each of the four indices—ES, NQ, YM, and RTY—to compare their volatility levels:
E-mini S&P 500 (ES): Typically exhibits moderate volatility, offering a balanced approach between risk and reward. Ideal for traders who prefer steady market movements.
E-mini Nasdaq-100 (NQ): Known for higher volatility, driven by the tech sector's dynamic nature. Offers larger price swings, which can lead to greater profit potential but also increased risk.
E-mini Dow Jones (YM): Generally shows lower volatility, reflecting the stability of the large-cap stocks in the Dow Jones Industrial Average. Suitable for traders seeking less risky and more predictable price movements.
E-mini Russell 2000 (RTY): Exhibits considerable volatility, as it focuses on small-cap stocks. This makes it attractive for traders looking to capitalize on significant price movements within shorter time frames.
By comparing the changing ATR values, traders can gain insights into which index futures offer the best fit for their trading style—whether they seek aggressive trading opportunities in high-volatility markets like NQ and RTY or more stable conditions in ES and YM.
3. Volatility and Trading Strategy: Matching Markets to Trader Preferences
The relationship between volatility and trading strategy cannot be overstated. High volatility markets like NQ and RTY can provide traders with larger potential profits, but they also require more robust risk management techniques. Conversely, markets like ES and YM may offer lower volatility and, therefore, smaller profit margins but with reduced risk.
Here’s how traders might consider using these indices based on their ATR readings:
Aggressive Traders: Those who thrive on high-risk, high-reward scenarios might prefer NQ or RTY due to their larger price fluctuations. These traders are typically well-versed in managing rapid market movements and can exploit the volatility to achieve significant gains.
Conservative Traders: If stability and consistent returns are more important, ES and YM are likely better suited. These indices provide a more predictable trading environment, allowing for smoother trade execution and potentially fewer surprises in market behavior.
Regardless of your trading style, the key takeaway is to align your strategy with the market conditions. Understanding how each index's volatility affects your potential risk and reward is essential for long-term success in futures trading.
4. Conclusion: Making Informed Trading Decisions
Choosing the right equity index futures to trade goes beyond personal preference. It requires a thorough understanding of contract specifications, an assessment of market volatility, and how these factors align with your trading objectives. Whether you opt for the balanced approach of ES, the tech-driven dynamics of NQ, the stability of YM, or the volatility of RTY, each market presents unique opportunities and challenges.
By leveraging tools like ATR and staying informed about the specific characteristics of each index, traders can make more strategic decisions and optimize their risk-to-reward ratio.
When charting futures, the data provided could be delayed. Traders working with the ticker symbols discussed in this idea may prefer to use CME Group real-time data plan on TradingView: www.tradingview.com This consideration is particularly important for shorter-term traders, whereas it may be less critical for those focused on longer-term trading strategies.
General Disclaimer:
The trade ideas presented herein are solely for illustrative purposes forming a part of a case study intended to demonstrate key principles in risk management within the context of the specific market scenarios discussed. These ideas are not to be interpreted as investment recommendations or financial advice. They do not endorse or promote any specific trading strategies, financial products, or services. The information provided is based on data believed to be reliable; however, its accuracy or completeness cannot be guaranteed. Trading in financial markets involves risks, including the potential loss of principal. Each individual should conduct their own research and consult with professional financial advisors before making any investment decisions. The author or publisher of this content bears no responsibility for any actions taken based on the information provided or for any resultant financial or other losses.

Russell 2000 fractal points to 40-60% dropRussell 2000 currently creating fractal.
Points to possible 40-60% downside.
This fractal creates:
- A top
- A bear flag
- A failed break to the upside
- A large break down after the failed break up
This fractal occurred in 2008 and 2020.
Both instances of recessionary bear markets.
This could play out similarly if we get a recession.
Price target is around 95 -100.

Was that it for $IWM? Do we correct before the real run?While I do think that IWM is the place to be over QQQ , I think this run has gotten a little ahead of itself.
I noticed something interesting today on the chart, if you look at it on the 6hr or 4hr, you'll noticed we tried to break above resistance on the 9am candle, and rejected hard back below it.
This leads me to believe that the next move from here is actually down, not up.
If we zoom out, the chart looks extremely similar to how it did before the covid crash. We formed a high, went down and v bottomed up into what looked like a breakout (Feb 2020), but instead formed a double top and then rolled over hard.
Now we've pretty much made the same move, we formed a high in 2021, corrected, v bottomed in Oct 2023 and now we're at the exact level where a double top could take place from the high that was formed in Jan 2022 before price broke down.
So will we have another covid style crash that brings price back to $150 or lower? TBD, but I have that feeling...
What does AI Fatigue look like for Indices? What is moving lately? Tech stocks in Nasdaq and S&P are down, whereas traditional stocks in the Dow Jones and the smaller-cap stocks in the Russell are holding well.
Micro E-Mini Russell Futures and Options
Ticker: M2K
Minimum fluctuation:
0.10 index points = $0.50
Disclaimer:
• What presented here is not a recommendation, please consult your licensed broker.
• Our mission is to create lateral thinking skills for every investor and trader, knowing when to take a calculated risk with market uncertainty and a bolder risk when opportunity arises.
CME Real-time Market Data help identify trading set-ups in real-time and express my market views. If you have futures in your trading portfolio, you can check out on CME Group data plans available that suit your trading needs www.tradingview.com

RBS: "You can see step #3...on this chart"I was trying to study 5 stocks valued between $75 to $90
On the Russell 3000 Right here on trading view
-
The price range is what was hard to figure out because the
the stock i have been wanting to trade are the on the TVC:DJI
-
those stocks are too expensive.
And so I have to stick to a lower price range,
because sometimes you have to optimize in order to save trading time, and profits
-
This is why you need to learn the Rocket Booster Strategy{RBS}
and it has 3 steps:
#1 - The 50 Moving Average
#2 - The 200 Moving average
#3 - The gap up Break out
-
You can see step #3 above on this chart
to learn more about this strategy rocket boost this content.
-
Disclaimer: Trading is risky you will lose money whether you like it or not
please learn risk management and profit-taking strategies.

US2000 / RUSSELL 2000 Bullish Robbery plan
My Dear Robbers / Traders,
This is our master plan to Heist US2000 based on Thief Trading style Technical Analysis.. kindly please follow the plan I have mentioned in the chart focus on Long entry. Our target is Red Zone that is High risk Dangerous level, market is overbought / Consolidation / Trend Reversal at the level Bearish Robbers / Traders gain the strength. Be safe and be careful and Be rich.
Note: If you've got a lot of money you can get out right away otherwise you can join with a swing trade robbers and continue the heist plan, Use Trailing SL to protect our money.
Stop Loss : Recent Swing Low using 1h timeframe
Warning : Fundamental Analysis comes against our robbery plan. our plan will be ruined smash the Stop Loss. Don't Enter the market at the news update.
Loot and escape on the target 🎯 Swing Traders Plz Book the partial sum of money and wait for next breakout of dynamic level / Order block, Once it is cleared we can continue our heist plan to next new target.
Support our Robbery plan we can easily make money & take money 💰💵 Follow, Like & Share with your friends and Lovers. Make our Robbery Team Very Strong Join Ur hands with US. Loot Everything in this market everyday make money easily with Thief Trading Style.

SPQ/QQQ Plan Your Trade For 7/15 - Exhaustion Rally PatternGood morning everyone,
This new Plan Your Trade video will illustrate why I believe the SPY may target 568~570+ highs over the next two days before rolling downward into a moderate downward/consolidation phase.
If you've been following my videos/research, you already know I believe the markets are setting up for another LEG HIGHER. But, first they need to roll into a PAUSE phase over the next 5+ days, then move higher on new momentum.
Watch today's video to learn why my SPY Cycle Patterns are so incredible and help traders plan/prepare for big market moves.
Here we go...
Get some.
#trading #research #investing #tradingalgos #tradingsignals #cycles #fibonacci #elliotwave #modelingsystems #stocks #bitcoin #btcusd #cryptos #spy #es #nq #gold

Russell 2000 Breaks 52-Weeks Highs, Recovering from Bearish HugsSmall caps still look like good long-term play despite Russell 2000 backlog in the first half of 2024 vs Large Cap S&P500 Index (SPX) and tech-heavy Nasdaq Composite (IXIC) and Nasdaq-100 indices (SPX).
As of July 10, 2024 the Russell 2000 YTD return was about Zero compared to a 17.75% gain in the S&P 500 (SPX) and 23.50% gain in Nasdaq Composite Index (IXIC).
By the way, that valuation measures make the small cap Russell 2000 index much more compelling when compared to the S&P 500.
Thursday was a historically strange day in the stock market. That may be good news.
👉 The Russell 2000 rose more than 3%, while struggles for Big Tech stocks weighed on the S&P 500 and Nasdaq Composite.
At the same time, every stock in the so-called Magnificent Seven fell, including a more than 5% decline for Nvidia and a 2.3% drop for Apple, which dragged down both the S&P 500 and Nasdaq Composite.
👉 Thursday was just the 2nd day in history since 1979 when the Russell 2000 rose more than 3% while the S&P 500 declined.
The split trading came after the June report for the consumer price index early Thursday showed headline inflation declined last month and is now up about 3% over the past year.
👉 The Nasdaq Composite underperformed the Russell 2000 by more than 5 percentage points in what appears to be largest ever daily gap on record.
The only other time the gap came in above 5 percentage points was in November 2020 (where broad stock rally began), right after Pfizer shared positive results from a Covid-19 vaccine trial.
What is The Russell 2000 Index in US stock market universe?!
👉 The Russell 2000 Index measures the performance of the small-cap segment of the US equity universe. The Russell 2000 Index is a subset of the Russell 3000 Index.
👉 The Russell 2000 Index represents just as low as 7% of the total market capitalization, however it includes approximately 2,000 of the smallest securities based on a combination of their market cap and current index membership (appr. two-third of The Russell 3000 Index components).
👉 The Russell 2000 is constructed to provide a comprehensive and unbiased small-cap barometer and is completely reconstituted annually to ensure larger stocks do not distort the performance and characteristics of the true small-cap opportunity set.
Russell 2000 Index characteristics (as of June 30, 2024)
Price/Book: 2.10
Dividend Yield: 1.44
P/E Ex-Neg Earnings: 16.90
EPS Growth - 5 Years: 14.14
Number of Holdings Russell 2000: 1,921
Russell 2000 Index Technical aspects
In technical terms Russell 2000 Breaks 52-Weeks Highs, Recovering from Bearish Hugs

RUSSELL - Looking Bullish..OANDA:US2000USD Completed a major pattern yesterday so its set up nice for more upside. We do have the big data days coming up on Wednesday/Thursday which can change things but this is where we are for now..
Enjoy the day.

The US Small Cap Stocks Are Gearing Up for a Bull Run
After a sharp decline in March 2020, the index showed resilience and made a significant upward move, approaching the 3,250 level.
Following that, Russel 2000 went into a period of consolidation and traded within a narrow range.
A bullish Pole & Flag pattern was identified on the chart during this consolidation phase.
Despite breaking out of the pattern, the index faced strong resistance and subsequently declined.
After finding support around 1,650, the index consolidated around this level for an extended period.
With a recent breakout, Russel 2000 appears to be strong at the moment and preparing for the next upward movement.

Major advance in Russell is now confirmedThe advance in Russell this past week completed a symmetrical triangle that was serving as the retest of a massive rectangle reversal formation.
Look for Russell to advance another 10-15% in the months ahead.

SPY/QQQ Plan Your Trade 7/11 EOD FollowupWhat can I say about today? It was also an emotional response to the CPI data falling in line with expectations.
How did this happen? The way I interpret this data, traders were literally gutted that the CPI number didn't come in hot. They wanted a hot number so the Fed may be pressured into making a move on rates.
I guess traders don't understand that we need the US economy to continue being the 900-lb gorilla compared to global economies. In fact, I want the US economy to continue to dominate global economies for the next 5+ years to grow our GDP and real wages and create an environment more similar to the 1990s—2010s US economy.
Far too many people simply don't understand how important it is for the US economy to continue to outperform global markets.
So, as you watch this video, please don't lose perspective of what is really taking place right now.
A. The US economy is strong.
B. The CPI data came in AS EXPECTED.
C. Nothing has really changed from yesterday to today.
D. Gold and Silver are moving higher as FEAR elevates (and demand for physical metals increases).
E. The US markets will start to fall back into line (Bullish) as earnings continue to report.
I urge you to stay cautious related to these big data days and understand emotions take control for many traders on days like today. Logic is thrown out the window when traders try to chase these types of trends.
Moves like this can be big winners - or massive losers. So, I always urge traders to PLAY SMART. Trade only 1/3 to 1/2 positions on big news days.
The trick to being a great trader is to never act in a manner that could blow up your account in 3 hours. If you want to do that, go to a casino and bet on RED or BLACK.
If you want to be a skilled trader, then learn to position your trades relative to your risk exposure and remember - tomorrow is another day full of opportunities.
At the end of the day today, the SPY Cycle Pattern nailed the move today. I did not nail the move with my expectations. Remember, I'm not 100% accurate all the time.
Still, I've called 14 of the last 15 days very accurately. Not bad - huh?
And if you think that is easy to do - give it a try yourself.

RUSSELL 2000 top wave structure This is my view of the wave structure as to the Russell 2000 if we break the 191 in iwm based on cycles

US2000 H4 | Sideways price actionUS2000 is rising towards a pullback resistance and could potentially reverse off this level to drop lower.
Sell entry is at 2,056.20 which is a pullback resistance that aligns with the 61.8% Fibonacci retracement level.
Stop loss is at 2,075.00 which is a level that sits above the 78.6% Fibonacci retracement level and a pullback resistance.
Take profit is at 2,019.85 which is a pullback support.
High Risk Investment Warning
Trading Forex/CFDs on margin carries a high level of risk and may not be suitable for all investors. Leverage can work against you.
Stratos Markets Limited (www.fxcm.com):
CFDs are complex instruments and come with a high risk of losing money rapidly due to leverage. 68% of retail investor accounts lose money when trading CFDs with this provider. You should consider whether you understand how CFDs work and whether you can afford to take the high risk of losing your money.
Stratos Europe Ltd, previously FXCM EU Ltd (www.fxcm.com):
CFDs are complex instruments and come with a high risk of losing money rapidly due to leverage. 73% of retail investor accounts lose money when trading CFDs with this provider. You should consider whether you understand how CFDs work and whether you can afford to take the high risk of losing your money.
Stratos Trading Pty. Limited (www.fxcm.com):
Trading FX/CFDs carries significant risks. FXCM AU (AFSL 309763), please read the Financial Services Guide, Product Disclosure Statement, Target Market Determination and Terms of Business at www.fxcm.com
Stratos Global LLC (www.fxcm.com):
Losses can exceed deposits.
Please be advised that the information presented on TradingView is provided to FXCM (‘Company’, ‘we’) by a third-party provider (‘TFA Global Pte Ltd’). Please be reminded that you are solely responsible for the trading decisions on your account. There is a very high degree of risk involved in trading. Any information and/or content is intended entirely for research, educational and informational purposes only and does not constitute investment or consultation advice or investment strategy. The information is not tailored to the investment needs of any specific person and therefore does not involve a consideration of any of the investment objectives, financial situation or needs of any viewer that may receive it. Kindly also note that past performance is not a reliable indicator of future results. Actual results may differ materially from those anticipated in forward-looking or past performance statements. We assume no liability as to the accuracy or completeness of any of the information and/or content provided herein and the Company cannot be held responsible for any omission, mistake nor for any loss or damage including without limitation to any loss of profit which may arise from reliance on any information supplied by TFA Global Pte Ltd.
The speaker(s) is neither an employee, agent nor representative of FXCM and is therefore acting independently. The opinions given are their own, constitute general market commentary, and do not constitute the opinion or advice of FXCM or any form of personal or investment advice. FXCM neither endorses nor guarantees offerings of third-party speakers, nor is FXCM responsible for the content, veracity or opinions of third-party speakers, presenters or participants.

PRTS - Penny stock about to launchPRTS is a car parts online seller. During covid boon, the company grew agressively, so is their share price and market cap.
Since then, not much dilution, 600m NR, P/S is below 0.1!!
Issue is profitability, the company does not have a debt issue, current cash and current profitibability and FCF can last years so no dilution to be expected.
In July, they started a TV commercial campaign, insider buy at 1.09 level for 100k usd. I mean for me this is an obvious play, but at 1.10 below, ride to 2 usd easily. Even then P/S will be still 0.2 and with their transformation of product portfolio, if they post a profitable quarter end of the year, easily we will x3 here.
I put enough money that I will not be sad if I lose. I think we are at the floor prices but anything can happen, this is not classic mag7, yet I see a very nice risk reward with stop loss at 0.95

SPY/QQQ Plan Your Trade July 3 ReviewThank you for all the great comments and suggestions. I love the fact that I'm helping so many traders find success with my research.
This video is really a recap of this week while we head into the 4th of July holiday and Friday's big Momentum Rally day.
Please take some time to review the other videos I have posted on TradingView to learn better techniques and refine your skills. You'll see me use these techniques over and over again on my charts.
Have a safe and fun 4th. We'll go get some more profits on Friday and into next week.

SPY/QQQ Plan Your Trade For July 3 - Early ConsolidationGood morning,
This continued video series highlights my SPY Cycle Patterns and attempts to teach you how to read these patterns and the price charts to plan your trades throughout the day.
Remember, I'm only looking for the best opportunities for trading profits. I plan to avoid any CHOP or sideways price action as it is not my style to scalp in and out of trades every 10 minutes.
I expect the upward price trend to continue, but it will happen later in the trading day (after Noon ET).
I expect the SPY/QQQ to consolidate in the early portion of the trading day - moving sideways and possibly pulling downward after yesterday's strong rally.
I believe that the price must attempt to consolidate into the channels related to momentum; then, the price may try to resume another momentum move higher.
So, I'm going to be patiently waiting out the first 2.5 hours of the trading day, looking for opportunities to buy into lower prices near 11-12 Noon ET, and expecting the markets to move into a momentum trend higher.
What I do may be different from what you decide to do as a trader. I'm just trying to help you see and plan for opportunities throughout the day.
Remember, Friday should be a very large price range day with a Momentum Rally pattern. It is not uncommon for that pattern's momentum to bleed into the end of today's trading day.
It should be a good day for traders.
Get some.

Plan Your Trade July 2 - The Big Rally Day Is Here.This continued series highlighting my SPY Cycle Patterns continues this week.
Today, the Rally pattern is in Trend mode. This usually suggests a powerful potential for a moderately large upward price bar on the SPY chart.
Although, this morning, we are seeing a moderately high pre-market price below yesterday's closing price. Does this negate the Rally pattern?
Nope. The pattern is fixed. It will either become successful or fail.
Remember, these SPY Cycle Patterns have a (roughly) 70% to 80% success rate. Thus, we can rely on them for guidance, but we must always prepare for potential failure (just like when making trading decisions).
I'm sticking to the SPY Cycle Patterns today. I'm not worried about the deep, lower opening price right now. However, this profoundly lower pre-market price could prompt a substantial"wash-out" event for the shorts when the market shifts to the regular session.
It seems that today is going to be a "make or break" day. Watch this video to see how I will play today's price action.
Go get some.

Innovation, Robots, Tech, Applied Tech Will SkyrocketI thought I would share some of my research for everyone to review.
Most of my work involves deep analysis of the markets related to shifting capital function, core fundamental dynamics, and future opportunities.
If you are following my SPY Cycle Patterns videos (the Plan Your Trade videos) - you already know how powerful my predictive models are.
Now, I'm sharing with you my belief that ignored, undervalued, and overlooked stocks/sectors are about to explode - and there are hundreds of symbols available for you to consider related to this move.
One of the most significant moves in 2025 and beyond will be the resurgence of innovation, robotics, technology, and applied functions related to the current/past technology boom. This is the 1990s (again) - leading to the second growth phase in new applications related to improved AI/tech capabilities.
You can profit from it if you take steps to prepare for the next 24+ months right now. All you have to do is watch this video, learn why I believe these will be some of the biggest movers over the next 24+ months, and then make your own decisions about what to trade.
Follow my research. My goal is to make you a better trader.
Right now, and for the next 7+ years, the markets will be the greatest opportunity of your life.

US2000 Bullish side Money Heist Plan SetupMy Dear Robbers / Traders,
This is our master plan to Heist US2000 Market based on Thief Trading style Technical Analysis.. kindly please follow the plan I have mentioned in the chart. Our target is Red Zone that is High risk Dangerous level MA act as a Dynamic Resistance & Order Block, So the Market is overbought/ Consolidation / Trend Reversal at the level Bullish Robbers / Traders gain the strength. Be safe and be careful and Be rich.
Note: Day traders & Scalpers If you've got a lot of money you can get out right away otherwise you can join with a swing trade robbers and continue the heist plan.
Stop Loss: Recent Swing Low using 4h timeframe
Loot and escape on the target 🎯 Swing Traders Plz Book the partial sum of money Use Trailing Stop To Protect Looted Money and wait for next breakout of dynamic level / Order Block, Once it is cleared we can continue our heist plan to next new target it will update after the Breakouts.
support our robbery plan we can easily make money & take money 💰💵 Join your hands with US. Loot Everything in this market everyday.

SPY Launching To $600+ - Then $730+. Get Ready.Have you been following my research?
Do you remember when I called a major base/bottom on 12-28-2022?
Do you remember when I stated, "The capitulation bottom will surprise traders" on 3-20-23?
Do you remember when I called for a "Tech-Bump" rally on 3-25-23?
Do you remember when I updated that peak potential to $425 on 4-26-23?
Do you remember when I stated, "The capital shift intensifies" on 6-25-23?
Do you remember when I warned of a China Credit Event/Crisis happening in 2024 on 8-20-23?
Do you remember when I warned, "US Markets May Double By 2029-30" on 4-21-24?
Now, almost 15+ months after all of these updates/warnings/videos, I ask you to take a look at what's happened in the markets and prepare for the biggest opportunity of your life.
Yes, I see the US indexes (SPY, Nasdaq, Dow Jones, and possibly the Russell 2000) potentially doubling (or more) before 2030-31.
Yes, I see the SPY rallying to levels above $730 in 2025, then stalling into a WAVE-B correction.
Are you ready for something different - factual data reported honestly and with a proven track record? Not hype. Not doom-n-gloom (CRASH posters).
My research is designed to help guide you through the next 10+ years of your life - protecting your assets, learning to become a more skilled trader/investor, and learning to rely on proven technology/concepts.
Are you ready for what's next? Maybe you need to try something different?
