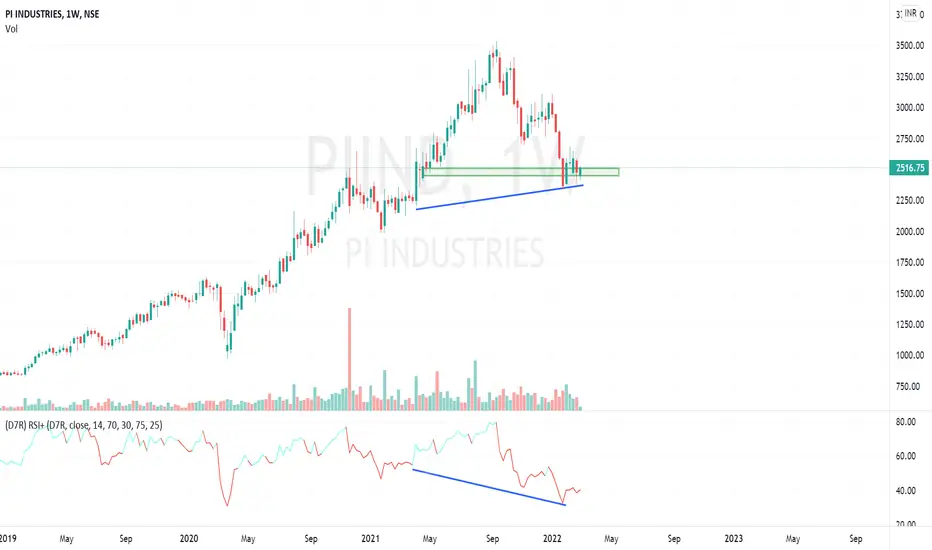
PIIND PIIND - Support at demand zone accompanied by regular bullish divergence in weekly time frame.
One can go long with a SL of 2380.
Russia
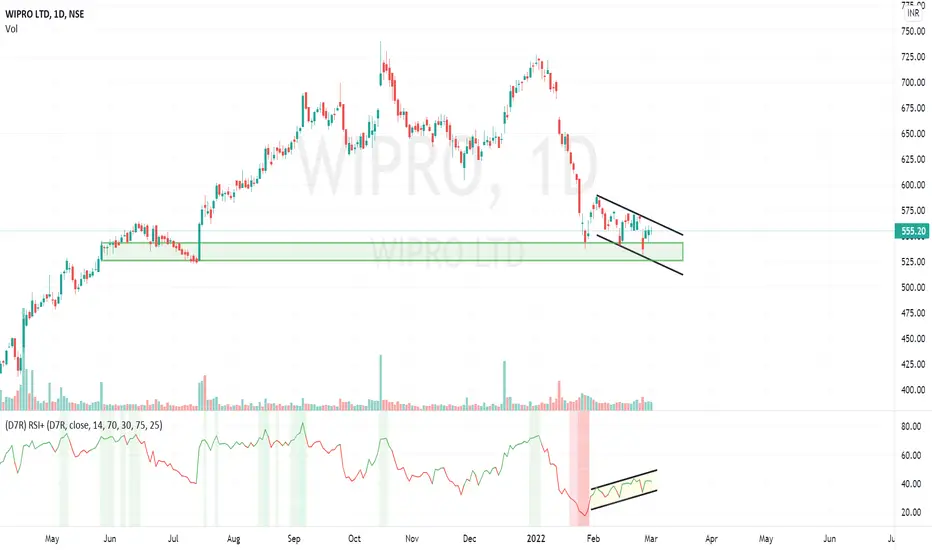
wipro - Momentum buildupWIPRO - Momentum Buildup near demand zone
One can go long with a SL of 525/500.
Only high risk investors/traders should take entry here, as the stock is still below 200 ema.
USOIL ShortHey traders, in this week we are monitoring USOIL for a selling opportunity around 112 zone, once we will receive any bearish confirmation the trade will be exeuted.
Trade safe, Joe.

Bitcoin is Now Worth More Than the Russian RubleAfter the collapse of the Ruble in the wake of Russia's invasion of Ukraine this week Bitcoin has now officially surpassed the Russian Ruble -- according to CoinMarketCap:
"Bitcoin has a market cap of approximately $835 billion while the ruble has a market cap of around $626 billion."
MOEX -- the tracker for the Moscow Stock Exchange went dark after the combination of sanctions and people pulling money out of banks/exchanges went into effect. The country is now in economic turmoil -- some are speculating that even altcoins like Ethereum and Dogecoin may have surpassed Russia as well. (Though the data for it is now available, yet.)
While some countries are currently celebrating the economic "victory" over Russia, some analysts are expressing concern over secondary effects over oil and gas prices, potentially further worsening inflation and supply-chain woes that were already starting to mount all across the globe.
With a US recession looming in the horizon, what does this mean for crypto? So far there hasn't been any indication that the losses of fiat currencies leads to the decline in the asset itself. In the long run, this may prove to be an important factor in how the industry pans out over the next few years.
www.coindesk.com

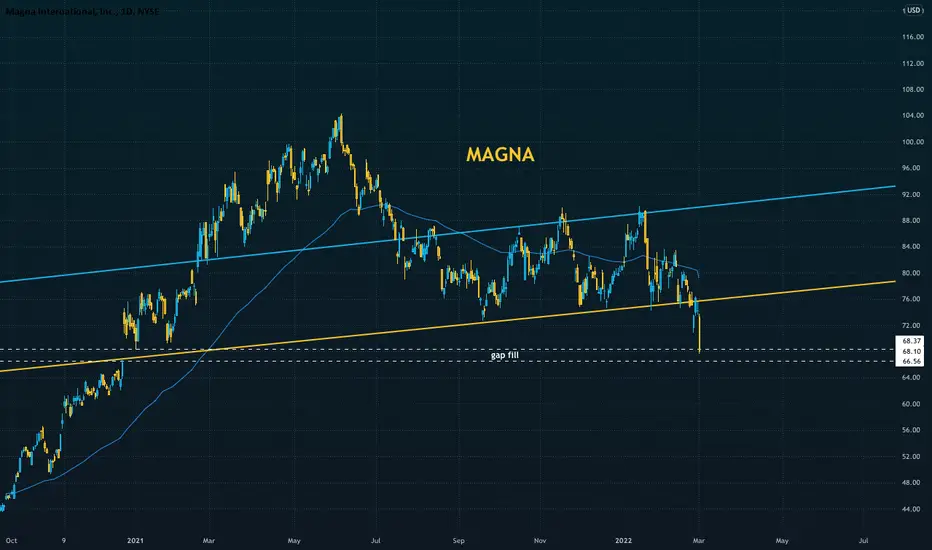
All Gaps Must FillA gap from Dec 2020 was closed in trading yesterday.
It would seem that asset managers are liquidating assets of companies with large manufacturing operations in Russia.
Magna has 2,500 employees in Russia in 6 facilities.
Russia conflict is likely to add even more supply chain constraints for auto manufacturers.
I really like Magna, should the conflict in Russia resolve itself, Magna will be positioned as a great investment opportunity on a discount with a good dividend.
BTCUSDTI say (1) or (2) .
These are the first prices before the other prices we will see .
What do you think ?

Real Money Moves Markets Good morning, nothing really technical here today folks just a reminder that one Geopolitical Event In Ukraine caused the market to move sharply to the upside. The power of real money cannot be denied during times of Bank Freezes or even Invasions & Occupations. Bitcoin passed the test once again, when millions of people donated BTC to fund Ukraine's Military. Over the last few weeks a colleague approached me in different ways sneakily trying to ask for crypto advice. I have to be honest, to people who aren't in the market & are clueless about the technology Bitcoin seems like some secret Cabal. Every few years people ask me randomly what coin they should buy. After six years the answer is always the same. I suggest starting with Bitcoin. If anyone is managing a portfolio BTC is the best way to start, it's the best investment, the best money, the most liquid cash, the most secure, it goes on & on. But for some strange reason, they think I'm lying or keeping secrets, or worse yet, I'm supposed to teach them portfolio management FOR FREE. This colleague, said his organization had access to large sums of cash sitting in a bank acct. A regular acct not a business acct. He asked what was the best thing to do? I suggested buying BTC & collateralizing it back into dollars 50% at 1% interest. The Org would have had tens of thousands of dollars to advertise, to do community events or for projects within the facility...The following week the conversation shifted to Akoin being some kind of solution for people in Senegal & potentially for black Americans here in the US. I was floored. After six years of teaching BTC, I had to start all over with the basics. My new approach is not to bash sh!tcoins but to allow people to fail, I do research on the projects then get back to "investors" with the good the bad & the ugly about their latest lotto dreams. After a few short conversations about the idealism behind Akoin or rather the appeal my colleague told me he hoped I was wrong or that he didn't want what I'd said to be true. I have no other choice but to believe he bought Akoin when BTC was dipping. The weight of the words "I don't want to believe that & I hope that's not true" were devastating. And this is the reason portfolio management conversations cost money.
What do you think?
Did you buy the BTC dip?
How do you handle no coiners?
Most diplomatic way to handle sh!tcoiners?
Disclaimer: In no way should my remarks or the context of coin discussion surrounding Geopolitics, Nation or Country of Origin to be considered disparaging. In fact if you're interested please see the latest developments regarding Senegal's adoption of Bitcoin.

Possible Buys on Gold
As Ukraine-Russia tensions continue, gold remains bullish. We will look for buys if price is able to break and close above the key level of resistance at 1931.00. This range should be filled with a 140 pip move to the upside.

Oil Soars Past $100, Next Targets?? #OOTTOil has soared and smashed through even our most aggressive profit targets. We smashed through 106, then hit 110, before finally coming up for air. A brief retracement appears to be finding support just above 106, so it does not appear that the rally is over, or even showing signs of pause. The Kovach OBV is extremely strong right now, as one would expect, but it has not showed teh slightest intent on leveling off, so it would be FOMO to buy at these highs. Our next target, set from Fibonacci Extension Levels is 116. We have created a giant vacuum zone below, so watch out if 106 does not hold. The next target below is 101.46, then 100.00. After that, we will surely find support in the 90's, but we aren't likely to see such low prices for now.

Stocks Still Undecided as Ukraine Crisis IntensifiesStocks have retraced further from relative highs at 4408. It looked like we might have been gearing up for a bull run to test 4440, but geopolitical woes seem to keep weighing, and two red triangles on the KRI suggest that 4408 is providing prohibitive resistance for now. We have since retraced back to 4272, but seem to have good support there. Currently, we are seeing a brief pivot from 4272, which has brought us to the midpoint of this level and 4408. From here it could go either way, but it is likely we will need some resolve to the Russia/Ukraine crisis to break higher. If we sell off further and 4272 does not hold, then 4228 is the next relative low where we should expect support, then 4122. If we can break 4408, then 4440 is the next target.

US OIL SHORT IDEAHere is my short idea based on technical analysis. I believe there will be atleast a 10% drawdown

Bitcoin (BTCUSDT) MultiTF TA: 22.3.2Bitco in is below 44500-45800$ Resistance in 8-hour time and is forming a Wedge pattern in 1 hour timeframe, which can be broken down or broken upwards with a spike candle. It is recommended to wait until the process is clear. While bitcoin is in range, some altcoins can grow.
8H Timeframe:
⚠️ This Analysis will be updated ...
👤 Sadegh Ahmadi: @SDQ_Crypto
📅 2.Mar.22
⚠️(DYOR)
❤️ If you apperciate my work , Please LIKE and COMMENT , It Keeps me motivated to do better❤️

NIFTY - Analysis NIFTY - Analysis
The encircled gap might go for a fill up and may reverse from the channel top.
No short term trades to be initiated unless ICHIMOKU cloud is breached.

CHFJPY-- 5:1 R/R positionCHFJPY-- A top-down analysis using fibonacci and support/resistance zones to identify a possible higher-low on a high timeframe uptrend. Critique my analysis! Like the idea and follow me for more day-trading perspectives. Happy trading, and good luck!

A Ukraine war is bullish for wheatWheat futures are showing a constant higher lows ahead of a bullish catalyst. That catalyst is a war between Russia and the Ukraine. I can get into any questions as to why I believe the current information suggests Russia will invade upon request in the comments.
This is bullish for wheat futures, The Ukraine is the number 5 ranked wheat exporter globally its wheat compromises 8% of global wheat exports. Most of the Ukraine's wheat production is in the east which would be totally cut off during a major conflict. To make matters worse Russia is the number 1 wheat exporter in the world exporting 17.7% of total global wheat exports. In the event of war Russia would likely be cut off from the swift payment system which would stop most of its international transactions causing massive supply chain issues with the wheat market. These factors in combination with the constant lower highs makes for very bullish conditions.

BTC Short TermOn H4 chart BTC is bearish/oversold in the MACD, RSI and Stoch RSI. I expect BTC to consolidate or make a small correction to the FVG zone. This will open up possibility for fresh entries and both alts if we stabilize or correct here. BTC has now become a strong asset during the Ukraine/Russia crisis, BTC also looks stronger than fiat and jump in BTC price and ''MCAP of stable coins'' indicate that investors are buying these assets. 3 of the top 11 coins are stable coins (usdt, busd and usdc)

Crypto ID Systems - Why Zero-Knowledge Proofs Are the FutureThe Russian-Ukrainian crisis, the tanking of the Russian stock exchange (and its subsequent shutdown) has put the economic future of Eastern Europe in a very uncertain state. Why Zero-Knowledge Proofs like zk-STARK and zk-SNARK (combined with KYC and AML methods) might see a renewed interest in the crypto industry in the near future. (And probably for the longer term as well.)

Bonds Soar off the Russia/Ukraine ConflictBonds have soared as risk off sentiment prevails as the Ukraine conflict intensifies. Russian forces are bearing down on Kyiv, the capital of Ukraine and civilian casualties are mounting. ZN has blasted off from highs at 127'08, through 127'22, and well into the 128 handle. We have cleared 128'01, the first level in the 128's, and have just broken through 128'10. With such a strong bull impulse, it is difficult not to anticipate a pullback or sideways currection at this point. We are likely to at least range at current levels, between 128'01 and 128'11, with a ceiling at 128'24. If not, expect a retracement to 127'22. Worst case, it is certainly possible that we will retrace the entire move to 127'08 (recall that gold did this just last week).

Russian Ruble weekly chartRussian ruble weekly chart. Free fall since 1997 I can't find the way to even count a possible Elliott Wave pattern. Just sayin'

Bitcoin - All The PossibilitiesBitcoin - all the possibilities ...
The Long target could be $49k, $26k still possible by April

SPY StraddleOn the short term this looks like a textbook bull pennant
Long term however it's a bear pennant (kind of?), But not a textbook one, that massive dip and massive rally messes with it
I expect us to make a major move up or a major move down today or tomorrow
SOTU is catalyst enough today for that imo
I'm leaning towards up. The charts are better for it and I think Ukraine news is good for US, as we covered earlier
Looking forward to your thoughts when you read this
tldr 437.33 turns into support that holds solidly we go pew up to 440, then it's a straight shot to 447
Now if it breaks to the downside, 430.39 is the support, and if that fails we tumble all the way down to 412
"gap down" as they say
Bears will do puts, Bulls will do calls, smart / safe money will do both with a straddle

Ruble Where You Going ?
Hi traders:
With the tension between Russia and Ukraine, we can expect the market to be volatile and moving during an uncertainly time.
As we know, USD is a safe haven currency, and here on USDRUB, we can see clear bullish price action on the bigger time frames.
With many bullish impulse phases follow by bullish continuations, price is getting push up to all time highs.
This is where usually price will consolidate, and potential to continue or reverse back down.
For me, my personal options is leaning more upside and continuation up move.
What we should wait for is some sort of bullish continuation correction on the lower time frames, to confirm the upside move.
With the situation between the two countries may get worse, USDRUB could on route to a new highs.
thank you

USDCAD Long IdeaUSDCAD has just approached a key support level in which it has seen positive price action before. The RSI levels on the 4hr and 2hr time frame show oversold levels which indicate that there is room for the price to rise from this area. The target of this trade is located near the 1.274 area with the stop-loss just below the 1.260 zone.
