King BTC - Is Russia gonna use u in face of impending sanctions?King BTC - Is Russia really gonna use you in face of sanctions on you?
zycrypto.com
Has Russia already bought lots of your sire during the recent crash?
Let's c...
NAF DYOR
Russia

Crypto Market Bleeds As Missiles Rain Down On UkraineOn the heels of Ukraine’s economic troubles, Bitcoin and Ethereum have taken a pounding in the crypto market.
According to multiple news reports Thursday, around two dozen Russian cruise missiles have hit specific targets in two cities in Ukraine, including its capital, Kyiv.
Russia’s attack undoubtedly is the cause of the current tremor shaking the world’s crypto and stock markets.

Ethereum Co-Founder Shares Thoughts on Russia-Ukraine CrisisIn the midst of awakening turmoil between Russia and Ukraine, the global crypto market declined to a record low. Bitcoin and other altcoins like Ethereum have been dipping since the hint of war hit the news wave.
Talking about Ethereum, co-founder Vitalik Buterin tweeted that Ethereum is neutral but he is not. He declared this following Putin’s declaration of a ‘special military operation’ in Ukraine.
Russia-born but brought up in Canada, Vitalik reminded everyone that his thoughts do not reflect the views and opinions of his company. That said, Ethereum remains neutral.
Meanwhile, he also tweeted “Glory to Ukraine” and condemned Putin’s decision to go on with war by abandoning the chances for a peaceful solution. He also wished everyone safety, even though the situation does not bring it. Also, he mentioned the turmoil as a “crime against the Ukrainian and Russian people’’.
Following the crisis, Ethereum fell 12.07% in the last 24 hours. It also has a current market capitalization of $279.7 billion. Moreover, it has been declining around 24.17% in the past seven days. At the time of writing, it trades at $2,349.02.

TRON UPDATEUkraine has a sizable pool of software developers ready to break into the blockchain technology space.
Last year, Dutch IT company Daxx ranked Ukraine as the most desirable country for information technology outsourcing and the No. 1 in the world for hiring programmers.
Ukraine processes more cryptocurrency transactions per day than it does in its domestic currency, the hryvnia, a 2021 report by The New York Times shows.
$8 Billion In Crypto Enters Ukraine Annually
According to The Times’ report, more than $150 million worth of cryptocurrency is traded in Ukraine everyday, and approximately $8 billion worth of cryptocurrency enters and departs the country each year.
Ukraine’s parliament enacted laws legalizing cryptocurrencies last week, laying the groundwork for a regulatory framework to effectively oversee the flow of digital assets such as Bitcoin.
Ukraine’s policymakers are optimistic that the new law and its crypto adoption would draw additional international investment into the country’s developing crypto economy, however frictions — and now a full-scale war – with Russia looks to dampen financial inflows.

MOEX Russia Index Price Target after Ukraine invasion The MOEX Russia Index is the main ruble-denominated benchmark of the Russian stock market.
The index was established on 22 September 1997.
The number of component stocks is variable, traditionally favored by domestic investors, while foreign investors prefer the RTS Index.
The sanctions from the US and EU could lead to a major selloff, $1220 being the price target, which is the strongest support of the index.
Looking forward to read your opinion about it.

Dogecoin price readies for a 35% crash as tension between RussiaDogecoin price is currently hovering on a critical support level, a breakdown of which could lead to a steep correction, but a bounce could trigger a new uptrend. Therefore, investors need to be cautious as crypto markets have turned volatile due to the ongoing war between Russia and Ukraine.
BTC crashed to $35,000 after news of Russia launching attacks on Ukraine emerged, causing Dogecoin and other altcoins to crumble as well.


Gold Blasts Off After Russia Invades Ukraine 📈🤑🚀Gold has blasted through highs off news that Russia has invaded the Ukraine. We saw some resistance around 1917, with 1895 providing good support. But the news took us past 1936, through the vacuum zone to 1956 and then on to the 1970's, where we are finally encountering some resistance and potentially may have topped out for now. A red triangle on the KRI suggests this may be a high. The Kovach OBV has gained considerable strength, and does not appear to be leveling off any time soon. If we do pull back, consider 1956 or 1936 for support.

FREE BTC TRADE IDEA (300+ PIPS)I'm expecting a slight pullback to 36K or an entry below 35243 for 230+ pips
Play Safe

BTCUSD D1 LONG-TERMThe announcement of the new package of Sanctions on Russia are about to spike the #Bitcoin price as EU has just announced that they will cut out Russian participation in the financial sector.
With Russia owning most bitcoins, the EU's sactions to exclude Russian banks on the financial markets could be the biggest driver for Bitcoin to move bullish.
If $29700 level holds, I anticipate #Bitcoin to be heading towards $50206-$53536 in a long term.
Lets wait and see how the Russia/NATO tensions unfolds, as this has become a war between Russia and the West as opposed to Russia/Ukraine tensions.

Lookback - Russia annexation of CrimeaHistory never repeats itself but often rhymes.
Today marks the incursion of Russia into Ukraine.
Market fell by 30%+ as of writing.
Looking back, Crimea annexation only saw a fall of 16%. The event took place over 1 month.
MOEX bottomed out after 3 - 4 weeks.
Russia's invasion into Ukraine is seeing MOEX lower than COVID levels and nearing 2015 levels.
May be attractive to allocate into Russia with more than 1 year time frame of investment.

Markets In Guernica - Sad Day for Humanity 🤕🩸🥶''In Guernica Lyrics
In Guernica the dead children were layed out in order on the sidewalk
In their white starched dresses
In their pitiful white dresses
On their foreheads and breasts the little round holes where death came in as thunder while they were playing their important summer games
Do not weep for them, Madre
They are gone forever, the little ones
Straight to heaven to the saints
And God will fill the bullet holes with candy''
May Peace and Logic prevail immediately. Such a small planet, yet so much stupidity 🤕🩸🥶
the FXPROFESSOR

S&P500 - LongsOANDA:SPX500USD
Currently being supported by the 200 moving average, we are seeing outbreaks of the war talks with this morning we have seen, Russian troops attacking Ukraine.
Historically, we can see that buying invasions and wars like this is generally profitable with the S&P rising dramatically during; Vietnam war, Gulf war, afghan war, Iraq war and Crimean crisis.
I will be watching price action for long term buys, I believe we will see all time highs in equities by summer this year (June/July 2022).

$BTC oversold 👁🗨*This is not financial advice, so trade at your own risks*
*My team digs deep and finds stocks that are expected to perform well based off multiple confluences*
*Experienced traders understand the uphill battle in timing the market, so instead my team focuses mainly on risk management*
Buy Entry: $37450
Take Profit: $41000
Stop Loss: $36250
If you want to see more, please like and follow us @SimplyShowMeTheMoney

War has started, BTC as speculative asset will take a huge hit.As predicted in my thread before, it was indictated that war will come to europe.
We might see BTC dipping below 30k for a short amount of period, brave yourselves.

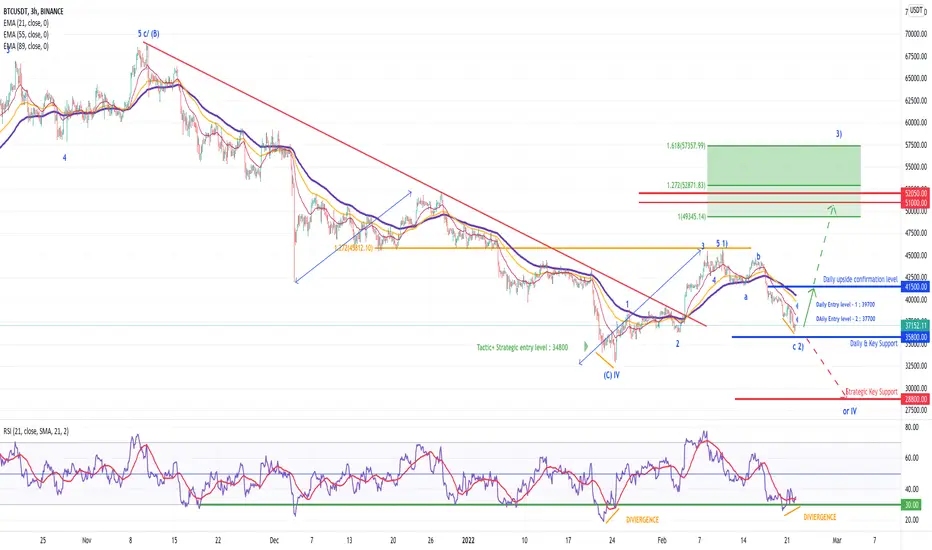
BTC/USDT Bullish Divergence above key support !BTC/USDT Bullish Divergence above key support @35800/37800
Context :
The recent setback reache the 61,8% Fibo retracement at 37800 corresponding also to a classic A=C pattern( harmonic) ending the wavec (2) and calling for an imminent recovery.
Clearly the market is questioning the behavior of the risk takers present in the Traditional market and crypto market by positionning the market at key hedging support on SNP500 and BTC
This kind of configuration is more bullish to be honest because it is the area where an intraday bearish trader on futur will take profit, because it is the inflection level to start a new recovery
The new bullish element this morning is the bullish divergence in progress like the one triggered on the previous bottom calling for an exhaustion of the Bearish momentum and an imminent bounce towards the daily blue resitance.
However a fail to hold on this support will confirm an extension of the previous bearish trend to 28800 (Long-term strategic support)
Tactical to daily view (1 to 3 days - before next 3 weeks)
As long as 35800 remains key tactical/daily support and 37700/39700 is acting as entry levels (buy) the market is expected to bouncing off towards 41500 (1 to 3 days) - only a clear break above 41500 in daily close will open 51K
Else Breaking below 35800 key tactical support a last downside leg towards the strategic key support at 28800 will occur before starting the multi- weeks significant bullish run expected
Key Leves to watch :
Strategic Horizon (3 to 12 Months):
Bullish - Key support @ 28800 - Target 1 @ 77000 - Target 2 @ 111 000 (Conviction = STRONG)
Tactical Horizon (1 to 3 Weeks):
Bullish - Key support @ 35800 - Target 1 @ 51 000 - Target 2 @ 52 000 (Conviction = Normal , Strong if 41500 surpassed)
Daily Horizon (1 to 2 days):
Bullish - Key support @ 35800 - Target 1 @ 41500 (Conviction = Strong because of the divergence)
Enjoy
Almost at buy levelThis is going nowhere since 2008 but for swingtraders there is some money to be made.

33k BTC is coming...europe on brick of warWell, it doesnt look good although there are lots of dip buyers, europe is on the brick of a huge war, i see a correction to 30-33k atleast!
this is not a recommendation to sell or buy bitcoin. Do your own research.

TOTAL rising wedge broken 22.2.24Total market cap broken rising wedge and it go to lower leves. Be careful and manage your positions.
⚠️ This Analysis will be updated ...
👤 Sadegh Ahmadi: @SDQ_Crypto
📅 24.Feb.22
⚠️(DYOR)
❤️ If you apperciate my work , Please like and comment , It Keeps me motivated to do better

Bitcoin crashes to 29K???I think Bitcoin can crash up to 29,000 and does not have significant support up to that area.
⚠️ This Analysis will be updated ...
👤 Sadegh Ahmadi: @SDQ_Crypto
📅 24.Feb.22
⚠️(DYOR)
❤️ If you apperciate my work , Please like and comment , It Keeps me motivated to do better


BTC USD Russia & Ukraine Blah Blah Blah! Same Sh*t!The charts speak for themselves. Russia and Ukraine have been going at it for years, its always the same crap, sabre rattling, threats, then talks! As you can see I show how many times this has happened since 2014, its ridiculous and I couldn't post nowhere near every article, just a few out of thousands that I saw from 2014 to present, and not counting duplicates.
I also compare the Dollar Strength to all this and how its touching the top of the trend line ready for another dip which means another nice move up for BTC. The BBWP is also at extreme lows not seen since the last run up from $8000 to $60000. The dollar is about to take a crap to some serious lows over the next few years as hyperinflation ramps up. Hold strong my friends, don't get shook.
This is not professional trading advice, just my opinion. Like if you appreciate this chart and follow me for more updates on many other coins. Leave a comment below and tell me what you think. Thank you.

SOL (Quick Analysis)SOL is currently forming lower highs and lower lows, this is a bullish falling wedge pattern. Considering BTC can stabilize or break $39k resistance we can see SOL and alts alike make more moves upwards. Watch for a candle to close above the resistance line for SOL or catch it at the support level . Please refer to my previous post for my view on BTC in order to understand market momentum. I've indicated a potential take profit zone if we see a bullish move, and the best buy zone incase of any correction.
Trade safely
