Pound is growth leader, dollar and ruble in danger and FEDThe best day for the pound over the past six weeks. Sum up, the result of its growth was the highest among the 30 other currencies on FOREX. Causes - a general correction in dollar pairs and possibility of Brexit progress. It is about the progress in the negotiations between Government and the leaders of the opposition Labor Party. As a result, by the middle of the next week, a compromise on Brexit may appear. In addition, a decision on the parameters of monetary policy in the UK will be announced on Thursday. But we will talk about it tomorrow.
Today, the Fed’s Open Market Operations Committee will announce its decision. With a 98% probability, the rate will remain unchanged. That is characteristic 2% put on a decrease in the rate. Obviously, the rate change is not worth waiting. But in general, if you look at the likelihood of lowering the rate until the end of the year, then the tendency is rather “dovish”: the probability that by the end of the year the rate will be decreased is 60-70%. What does this mean for the dollar? - Nothing good. Yesterday's sales - further proof of that. The weak inflation component in the latest report on US GDP indicates that the expectations of a rate hike in 2019 by the Fed are not that baseless.
Thus, yesterday the markets were discounted under a possible "pigeon" tone by the Fed. Note that as a reason for the Fed’s optimism is the latest figures for US GDP (they are much higher than forecasts). So the results are quite unpredictable in terms of the Central Bank’s comments. Our position as a whole is to sell the dollar. But, it will need to be adjusted in the process of results announcement.
Returning to the events of yesterday, we should note relatively good data on the Eurozone GDP (exceeded forecasts: 0.4%, with market expectations averaging 0.3%). But the GDP of Canada frankly disappointed: in February, the indicator fell by 0.1%. In addition, the situation with unemployment in the Eurozone was better than experts' expectations (7.7%, with a forecast of 7.8%). In this light, yesterday's growth of EURUSD above 1.12 can be considered as logical.
Democratic Leader Senator Chuck Schumer called on the United States to impose additional sanctions against Russia. And today, in the US Congress should pass a hearing on Russia, which could result in another tightening of sanctions.
As for our positions, today we are continuing to look for points for the dollar sales against the euro, pound, as well as the Australian and Canadian dollars. In addition, we will buy gold, as well as sell oil and the Russian ruble on the intraday basis.
Russia

Where investors will run to? OPEC +, it’s time to buy euroQuite unclear statistics on personal income and expenses in the United States appeared on Monday. The first one came out worse than expected, and the second - better. In addition, Europe has reported a low level of consumer confidence. Firstly, the euro is very cheap, and secondly, today we are waiting for data on the GDP of the Eurozone and a data block for Germany. Societe Generale recommends analysts to buy EURUSD with targets of 1.16. The reason - hopes for improving the economic situation in the Eurozone.
Nouriel Roubini (American economist, a professor at NYU's Stern School of Business) broke out with apocalyptic predictions about the future recession in the global economy and the early flight of investors into safe assets. Among the possible triggers of global problems, Roubini calls the huge debts accumulated by countries, especially the US, trade wars between the US and China, the bad shape of the Eurozone economy, the political risks of developing countries (Turkey, Venezuela, Iran, Brazil, etc.), as well as unpredictable Trump’s actions on the eve of the 2020 elections in the United States. In this light, we recall our recommendations for buying gold. If investors run, then this is determined by one of their goals.
Meanwhile, OPEC + is trying to stop the start of the correction in the oil market. In particular, Russian President Putin announced the fulfillment of the OPEC + deal, none of the participating countries raised the question of whether to withdraw from the deal as well. Recall the deal expires in June. And its non-renewal is fraught with the appearance on the market of an additional 1.2 million b / d. This will definitely lead to a sharp decline in oil prices. Our position on oil this week is unchanged - we look forward to the start of the correction and recommend selling the asset.
Another reason for reflection was the information that more than one-third of the 80 respondents (managers at Central Banks owning assets of € 7 trillion) made it clear that they are ready to reduce the share of British assets under their personal control (the results of a Central Banking Publications survey). Given that we are talking about tens of billions of pounds that could potentially be spilled onto the market, this news is very negative for pound buyers. However, while there are no facts, it’s obviously premature to panic.
As for our positions, today we are continuing to look for points for selling the dollar against the euro, pound, as well as the Australian and Canadian dollars. In addition, we will buy gold, as well as sell oil and the Russian ruble on the intraday basis.

USD bonds arbitrage opportunity: long RUSB short FXRULSE:RUSB is an ETF on 22 investment grade Russian USD denominated eurobonds. At current moment RUSB trades at significant discount to its own basket. This is a unique buying opportunity that can be captured either by long only investrors or by arbitrageurs. In case of long only - buy at 23.90 and hold enjoying the recovery of Russian eurobonds or put a sell order above fair value being 24.35 to earn about 2% absolute only on spread in approximately a month time plus appreciation of Russian eurobonds. For arbitrageurs - buy RUSB, short FXRU, to capture the spread.

Russian Ruble (USD/RUB) Sell limit 64.80 >>> 61.39Russian Ruble:
During breakdown of the first candle. growth is same size of candle. ( TD )
Current candle is big. So we size a little different.
Daily chart
Current = Trend is down
MN = time frame
We have a big candle (First candle (TD))
I'm waiting on daily chart 64.80 (RUB) and after that we have Low trade zone/support for fixing deal = Target is 61.39 (RUB)
---
Sell Limit = 64.80
Take Profit = 61.39
Stop Loss = 67.17
---
Profit = 5.26%
Risk = 3.66%

The ECB, Brexit, the Fed and capital flight from the RFThere were no particularly strong movements in the foreign exchange market on Wednesday. So let us analyze the main events of yesterday.
The ECB left the rate unchanged. The Draghi conference was perceived by the markets quite cool, at least judging by the dynamics of the euro. Although the head of the ECB did not say anything new. He noted that the output data remains weak. As for the details of the TLTRO program, they will be announced later and will depend on the economic situation. So we see no reason to change our recommendation on buying EURUSD from the current lower limit of the medium-term range.
UK Macroeconomic statistics appeared quite good on Wednesday. GDP turned out to be better than analysts 'forecasts (0.2% m / m with a forecast of 0% m / m) in February, industrial production was also higher than experts' expectations (+ 0.6% m / m with a forecast of +0.1). However, the reaction of the pound was quite restrained. The reason for this is the expectation of the EU Brexit decision. As we expected the EU gave Britain a Brexit delay on its own terms.
Brexit delayed until October 31. Such decision had no significant effect on our position. We will continue to buy a pound on descents. It is not necessary to wait for the pound growth in the foreseeable future above 1.40. In any case, it will not be boring. May still needs to convince Parliament that such a long delay is justified, so you should not relax.
Another important event on Wednesday was the publication of the minutes of the last FOMC Fed meeting. Despite the good dynamics of the US economy, the Fed sees a significant amount of risk from the outside. Accordingly, interest rate decisions will directly depend on the state of both the internal and external influence. At the same time, the Fed is prepared both to raise the rate and lower it. Well, while in conditions of uncertainty, the best option is to keep rates at current levels. Our position on the dollar remains unchanged - we are looking for points for its selling on the intraday basis.
We continue to talk about the ruble. The urgency of this increases with its attempt to grow. So yesterday, the ruble continued to strengthen, and we consider it our duty to recall why this is temporary and why it is worth selling. Yesterday we already wrote about a 10 trillion hole in the Russian banking system, and today we will talk about capital outflow from Russia.
According to the data of the Central Bank of the Russian Federation, the net outflow of foreign investments from the authorized capital of Russian companies of non-financial sector rose to $ 6.5 billion last year, which is a record value in the entire history of statistics since 1997. Against this background, Goldman Sachs released their forecast for the actions of the Central Bank of the Russian Federation in terms of the discount rate. Goldman analysts are expecting it to drop to 6.5%: in 2019 twice, each time by 25 basis points, and another three times by 25 basis points, that is 75 basis points, in 2020.
All this is definitely a bearish signal. They do not relate to immediate factors, but these are the things that determine the fundamental value of an asset. In this case it is the Russian ruble. So we continue to recommend its sales.

Brexit, trade wars, oil and ruble problems April 12, 2019 is the official Brexit date. There are two options: leaving without a deal (both are afraid of it, Britain and the EU, therefore, we regard this outcome as highly unlikely) or a delay. In our opinion, the second option is alternative. It is all about the terms. The EU summit will show whether it takes a year, as the EU wants, or a couple of months, as the Britain wants. Our trading tactics are unchanged so far - we buy a pound on descents.
Trade negotiations between the US and China over the end of the trade wars continue. This week promises to be quite intensive in terms of the negotiation process. Recall that the completion of trade wars is viewed by markets as positive for the world economy as a whole and for individual markets (commodity, stock) in particular.
Oil has reached its maximum in the last 5 months. The reasons for this we have already listed. The main thing is the OPEC + No.2 agreement, which provides for an artificial supply reduction in the oil market by 1.2 million b / d. In addition, a sharp drop in the level of mining in Venezuela and problems in Libya only only thrown oil on the flames. The result - the growth of oil quotations despite an increase in the production of shale in the USA. We continue to look for points for asset purchases on the intraday basis with small stops.
We recommend yesterday’s ruble appreciation in the foreign exchange market as a pretext for its selling. “Deadly” sanctions are already under consideration by Congress. Recall that one of the main strikes from the new package will impact banking system. Analysts of Raiffeisen bank calculated the total volume of problem assets on the balance of credit institutions of the Russian Federation in 2019 exceeded 10 trillion (problematic is considered “mortgage with indicators of impairment”, which include bad, toxic and simply non-performing loans). The coverage ratio of bank reserves of problem debts is only 54%, i.e. the amount of uncovered problem assets is estimated at 4.7 trillion rubles. The banks will not be able to cover this hole with their own capital - it simply will not be enough. Thus, the banking system is more vulnerable than ever, and sanctions may well destroy the delicate balance and lead to collapse. In this light, we recall our basic recommendation to sell the ruble at every available opportunity.
We want to highlight a recommendation on the dollar sales, as well as purchases of gold.


Brexit, inversion of yield curve, new sanctions against RussiaLast week ended with the “accompaniment” of the UK news. Theresa May was still able to vote on her plan to leave the EU. However, it would be better if she did not do this, since she suffered a third defeat. In theory, this should have been the final vote.
Since the UK was unable to reach an agreement last week, the postponement of Brexit until May 22 is not granted. Sum up the country must either leave the EU on April 12 or request another delay. In case of a delay, it is necessary to participate in the European parliamentary elections on May 23. Meanwhile, The European Union is scheduled for an emergency summit on April 10.
On Sunday, the British Prime Minister announced that she would again put her version of the agreement to a vote. This will be the fourth time (!). At the same time, she gave a none-too-subtle hint that if the deputies do not vote “for”, then early parliamentary elections will be called. This week might not be easy to the pound.
Last week, the pound was naturally under pressure. However, in our opinion, the situation continues to evolve as it has been doing recently. There is an absolutely conscious inhibition of the process. Obviously, the UK will ask for a reprieve, and the EU will provide it. Our position is unchanged - the descents of the pound, we continue to use for his purchases and earnings.
There's a lot of chatter about the inversion of the yield curve among the analysts recently. Last week, the yield on two-year US Treasury bonds was equal to the yield on 10-year. This is a rather atypical phenomenon, often a sign of a future recession in the economy. So concern is growing. Against this background, we continue to believe that buying gold on the intraday basis and in the medium term is a good trading idea.
About our trading ideas. Our recommendation on sales of the Russian ruble was just fine on Friday. We have repeatedly noted that the strengthening of the ruble is temporary, because it does not have “the ground”, and the ruble itself is vulnerable. It was confirmed clearly on Friday. New information on US sanctions brought down the ruble.
We are talking about the second set of sanctions related to the Skripal case. According to Bloomberg, the sanctions include measures against the Russian banking sector.
There is no chance to relax this week. A lot of static information led by statistics on the US labor market on Friday. Brexit news, new sanctions against Russia will not allow to relax. We will inform our readers about the biggest events.

Second stage of EM rally?After previously tracking the reversal (see attached: "Another key reversal in play in USDRUB") finally the break of 65 has come. From a technical standpoint this was important as it unlocked the 62.5 lows.
Russia has been one of the out performers on the currency board so far this year and I continue to see scope for more gains, irrespective of the very near term reversal in dollar.
The risk here to the setup is coming from sanctions related risk. Russian authorities have been quick to take measures to insulate the economy (reaction to DASKAA bill).
Best of luck all those trading EM and thanks for keeping the likes and comments rolling

MOSCOW STOCK EXCHANGE (MOEX) DAILY TIMEFRAME SHORTThis market is clearly bearish as shown by the lower highs and lower lows, with ranging tendencies as the price consolidates between the 94.71 resistance level and the 80.25 support level. Traders should look for potential sell entries close the 94.71 zone. The price could potentially form a triple top formation on the 4 hour timeframe. Keep your charts clean and save your soul from clutter.

Tracking the highs in Crude after Supply cuts are priced inHere we are tracking a retrace in Crude after expected supply cuts are fully baked into the market.
Bulls are going overboard here, forgetting that we have demand shocks coming with the global slowdown. The impulsive leg down last year was caused from the supply side, there is very little that can be done here to get back to these levels again.
Good luck everyone trade this live.

USOIL on path to 58.50 before falling towards 50. Pending short?Technical analysis uncovers path that may bring a lot of possibilities of trading, but also a lot of risk, stay close to the news and comments about USOIL, and also monitor the development of the pattern in the following days and weeks.
Time-frame: one month.
Resistance: 58.52
Support: 48.90
Trading setup scenario:
After price reaches 58.52 we short it on a daily close below it. Target 51.20, and 49.
-------------------------------------------------------------------------------------------------------------------------------------------------------------------------
Risk Warning: Trading on the Financial Markets, Stock Exchange and all its asset derivatives is highly speculative and may not be suitable for all investors.
Only invest with money you can afford to lose and ensure that you fully understand the risks involved.
Please remember that past performance may not be indicative of future results.
Supplied information is not an advice.

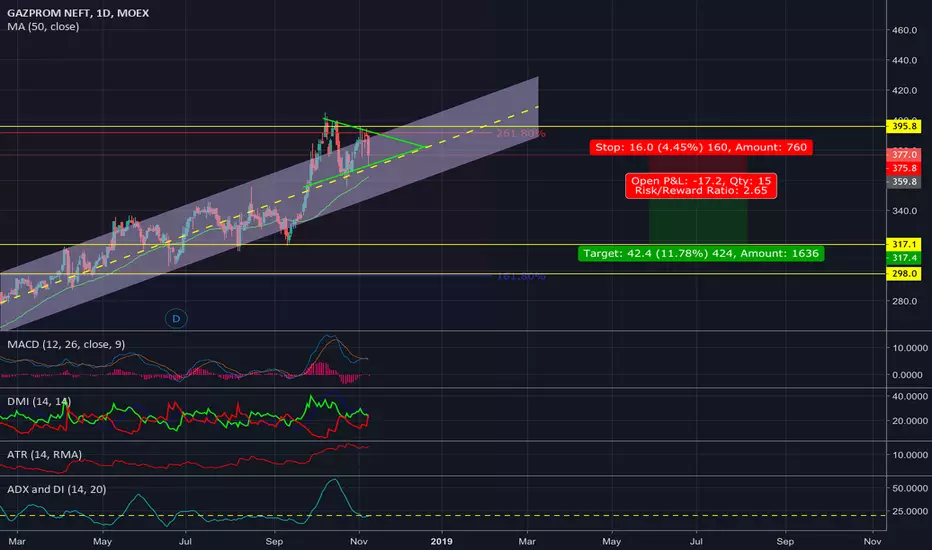
TURNING POINT IN INCREASE TREND OF GAZPROM NEFTTECHINCAL ANALYSIS OF MOEX:SIBN
What do we have?
1. From July 2017 to October 2018, share prices of MOEX:SIBN increased by more than 115%.
2. MACD is below 0, which indicates a decreasing trend.
3. The DM shows the beginning of the suppression of the negative trend of the extreme line from the bottom up, which also indicates the beginning of the declining trend.
4. ATR indicator, which is formulated as follows: the higher the value of the indicator, the higher the probability of a trend change; the lower its value, the weaker the trend direction. In this case, the indicator is located at the highest levels at the top (12.4) and indicates the damping of the uptrend. The last time this value was in February 2015 and after that the price rolled back by more than 40%.
5. The ADX indicator is in a low value, which shows a trend towards a reversal or correction of the market.
Conclusion.
Most likely, prices will decline to a minimum of 317 rubles, which corresponds to 38.2% of Fibonacci retracement from the current growth. The confirmation of this prediction will be a breakout of the current price of the triangle down below the 360 RUB.
Trading recommendation:
Open short position when reaching the level of 359.8 rubles, take profit at the level of 317 rubles (11.3% profit). Stop loss-the middle of the triangle 377 rubles. (4.45% loss)
Alternative scenario:
If the price overcomes the previous maximum of 404 rubles. it makes sense to open the long up to 485 rubles. (which corresponds to 361.8 Fibo expansion).
Russia US relationsRussia and the US are butting heads again. Senate Foreign Relations Committee and both Republicans and Democrats are pushing for much stricter sanctions. A new bill called the “Defending American security from Kremlin Aggression Act (DASKA)” of 2019 will impose new sanctions on Russia. The new legislation will target Russian banks and individuals as well as Russia’s oil and gas sector. This includes anyone who is providing services, financing, goods or any support to the development of oil in Russia. This is bone chilling for Russia.
USDRUB
The currency pair USDRUB is in a perfect channel. Between 64.75(65.00) and 70.00. Price did not drop below the 38.2% Fibonacci level and has stayed above the 200-EMA. Price has crossed over the 21-EMA and with this we received all the signals that we need to enter a long. If price continues to stay above the 67.00 mark, we recommend opening long positions with a target at the resistance line seen in bright pink on the graph, around 69.25.

The Ruble Carry TradeThe Russian currency has gained 5.7% against the Dollar thus far this year, following a large depreciation in December, resulting from an anticipation of more Western sanctions. The Ruble regained its strength in January though as the continuation of the US government shutdown and expectations of a global slowdown made the currency look more attractive. Most importantly, expectations of higher growth in the country came true as Russia grew by 2.3% in 2018, compared to forecasts of 1.8% growth. Not least, the 5.5% interest rate differential also assisted in attracting foreign money to gain from the carry trade and thus pull the rate higher.
The positive carry trade potential would mean that someone in a short position would be able to earn a 99-pip positive overnight swap rate. Over January 2019, this would have amounted to approximately 2,200 pips, increasing the investor’s profit to 6.1%, in just one month. To put that in perspective, a trader shorting one standard lot of $100,000 would earn $6,100 in January.
As with all things in life, things are not as simple as they seem. In this case, the caveat relates to the state of the Russian economy. In particular, the Russian economy appears to be following the rest of the world in a global slowdown, as a Reuters poll of economists suggested a consensus forecast of 1.4% in 2019, compared to 1.7% in 2018. High inflation and lending rates are expected to take their toll on the Russian economy, despite the improvement a value added tax reduction could potentially have. Most importantly, Russian Central Bank’s decision to purchase foreign currency in order to increase its reserves is likely to have a strong effect on the Ruble.
Overall, the above suggests that the Ruble has the potential for carry trade gains over the year but also has the potential for a currency depreciation which could eclipse any profits from the interest rate differential. Naturally, the possibility for rate increases in the case that inflation rises more than expected also holds which would also provide a boost to the currency. However, the situation for the Russian economy will, out of all things, highly depend on the price of Oil and this is what potential traders need to focus upon.
Come join us today at HotForex
Disclaimer: This material is provided as a general marketing communication for information purposes only and does not constitute an independent investment research. Nothing in this communication contains, or should be considered as containing, an investment advice or an investment recommendation or a solicitation for the purpose of buying or selling of any financial instrument. All information provided is gathered from reputable sources and any information containing an indication of past performance is not a guarantee or reliable indicator of future performance. Users acknowledge that any investment in FX and CFDs products is characterized by a certain degree of uncertainty and that any investment of this nature involves a high level of risk for which the users are solely responsible and liable. We assume no liability for any loss arising from any investment made based on the information provided in this communication. This communication must not be reproduced or further distributed without our prior written permission.

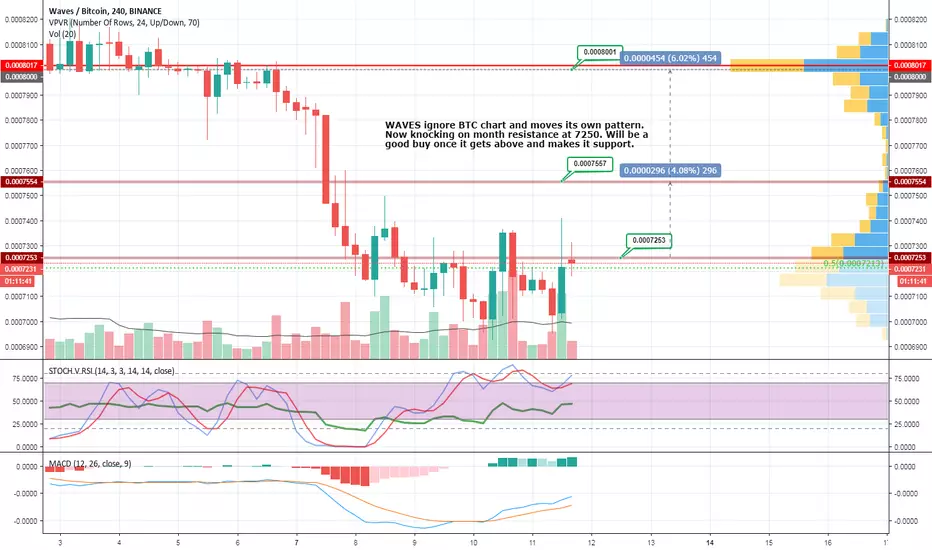
WAVES could be starting a new uptrend
Now is definitely not the best time for trading, considering weak BTC. but some coins do show some potential. Waves is the one of them as it has its own chart that ignores Bitcoin movements.
Food area for bounce. Since beginning of previous grow 0.5 correction. Once 7250 becomes support it will grow further, even against BTC (hopefully). If not stop loss can be set very close to buy zone now so risk in this trade will be minimum. Still I prefer to enter it only after it gets above that important resistance level.
Sberbank of Russia Sberbank of Russia
- large degree wavecount
- Abc correction in 3 wave painting itself nicely
- Crypto is setting up to eat into world markets dominance
Stay profitable

21% Potential in Russian Bear!AMEX:RUSS
21% Potential in Russian Bear!
Entry now if you're a bit more aggressive or
Entry after signs of higher highs and higher lows above blue EMA (15) line
2% Stop loss
MacD showing signs of reversal
RSI below 40

RTS index could drop to 800-530 following the Brent crudeThere will be no miracle. Less revenues from falling oil market will drag the index lower
as it should be around 800 already and could hit 530 when the oil would retest a multi-year low.
The correlation index for the past 12 months shows negative correlation but it is a temporary situation
as on the longer periods (20+ months) it is positive.
This will change gradually when the index will catch up with a falling "knife" oil.

Usd/Rub going down to 63-62 rubles per dollarMy vision and knowledge based on elliott wave theory, and I see usd/rub making a new low at 62-63. After that I am expecting USD to rise again. Currently we are in wave c of abc of 2 wave. Have a nice ride!


GAZPROM steps on the gasThis a clear buy for me.
It quickly went to the .618 of the last up trend, which was at the same level than the MA200.
AND BOUNCED.
Also look at the volume on bullish vs bearish days.
Buy buy buy.

How to date a Victoria Secret model. Description: Remember when Macklemore had the #1 raprecord? I dont.
Timeframe ~3 days
Indicators used: 0.123 x 29.53 = 3.63 days since New Moon.
Shout outs: Them 6 white speakers at Jackson Palmers latest speaking gig.
* Bull scenario if this dont break down here.
