Russia

FXMM could be building a bullish 5 wave, or is it really?FXMM continues growth after breaking 1220 resistance. It is building a bullish 5-wave pattern unless it breaks below broken resistance point (dotted red). The bullish momentum can mark the start of the new uptrend that can last for several years and most likely complete wave 5 at 1.618 fib level(1301.09). A bullish breakout above this level could see wave 6,7,8,9 push to the next Fib targets. The support zone 1114.4-1090 stays valid. We most likely will retest this levels if the Elliott Wave pattern breaks. I will recommend to buy a break to the upside, with profit targets based on structure support.

Long in Crude Oil up to USD38, STOP USD27.80After the production agreement between Russia and Saudi Arabia, it is possible that the imbalance between supply and demand decreases and even set aside in coming months.
Based on this statement and Fibonnaci retracemen of previous days rally, while the pet'roleo is over USD28 is likely to advance to USD38 .

Brent Near-Term OutlookBrent crude has been able to rally on little volume during the U.S. banking holiday and rumors surrounding a potential unified OPEC production cut, issued by the UAE energy minister just as WTI was carving out a 12 year low (and in the middle of the night, local time, no less.)
Four days later, there has been no new reports of said production cut proposal, but something interesting has been reported by Charles Kennedy at Oilprice.com - " UAE Offers India Free Oil To Ease Storage Woes ."
There is still no reason why OPEC would cut production now given the distress its tactics are already causing in the U.S. shale space. To cave in now, OPEC's squeeze on U.S. shale would be a failure and U.S. shale would be a beneficiary.
The same UAE that sparked the latest crude short-squeeze has so much oil, it's bribing India with free oil in order to access a underground Indian storage facility to park abundant reserves. Go figure.
Despite OPEC's true unwillingness to cut production, the technical outlook for Brent could prove positive unless risk sentiment is turned off.
Currently testing price resistance at $33.81, Brent crude has found support at two key weekly support levels: $27.83 and $31.59. The ADX is showing a lack of momentum in the current move, but +/- DMI could, potentially, have a bullish convergence.
The growing tensions between Saudi, Turkey and Syria could reignite risk premium, but many analysts have suggest that any substantial premium is unlikely due to the current supply glut. Even so, resistance at the 50-day EMA coincides with a minor downtrend.
However, a break north could test $38.46 to $40.34. If price breaks down, Brent could easily retest $27.83, while more talk of not cutting production would send the international benchmark to $22.98.
Please feel free to comment and share charts! And follow me @Lemieux_26
Check my posts out at:
bullion.directory
www.investing.com
www.teachingcurrencytrading.com
oilpro.com


Crude Technical OutlookCrude started the new year with volatility, as prices initially rebounded into price resistance near $38/bbl on geopolitical tensions between Iran and Saudi Arabia. However, the rally was short-lived and there looks to be no follow through in today's session.
There are a few key factors to take into account: slow global growth, a decline in global demand growth and a supported dollar.
As posted here and here , near-term resistance is near $38/bbl which has been tested and failed twice in the last two days. Technical breadth still remains negative, and the lower have of the demand zone is the next area of support between $33-34/bbl.
If the bottom of the range breaks, $27 is open for the taking. As mentioned in August :
"On a market technician's viewpoint, if fundamentals do not shape up quick with support from consumption economies, like the U.S. and China, crude could break 2009's low of $33.20 per barrel.
I also expect the dollar to continue to rise, increasing deflationary pressure throughout 2016.
Price support is currently $42.02, just $2.22 per barrel less from where it is trading today. 2008's high of $147.27 per barrel creates a "V" shaped support and resistance price channel, which will likely hold prices.
If prices break through this key support level, selling could amplify if there is no catalyst to bring prices back north. A "demand" zone - an area where confirmed buying took place - between $38.34 and $34.04 will be the last line of defense for crude prices.
A close below this level, and a target of $27.14 per barrel is initiated."
Take it back further to last February :
"A bottom in crude will be formed when a series of indicators and data show confluence."
"Growth has been lacking, and it is concerning that China – the largest consumer of oil – is showing real signs of trouble. GDP recently hit two decade lows, and the most recent import/export data is troubling. China saw a 3.3 percent decline in exports and a whopping 19.9 percent decline in imports YoY, the worst since 2009. It was was 16 percent lower than the general consensus.
There is also disinflation. Whether it is in the US, Eurozone, or China, prices for commodities will remain low. Crude is no exception.
A bottom in crude will not likely begin until fundamentals mingle with price action. Inventory builds of 5, 6, 10 million barrels per week will not help the case for higher prices, and oil companies could be forced to further slash rigs, jobs and CAPEX.
And considering the deteriorating economic data, more so in the US, 2008’s low could be retested."
If bulls could retake momentum, upside potential could reside at $42.75 and, potentially, $48.55. The situation remains dynamic as an unexpected production cut from a large producer could spark huge short-covering (unlikely to change long-term sentiment). Although, OPEC and Russia look to remain active, while production in the US is still near historical highs .
Please feel free to comment and share charts! And follow me @Lemieux_26
Check my posts out at:
bullion.directory
www.investing.com
www.teachingcurrencytrading.com
oilpro.com

Playing upcoming oil rally with YNDXOil will rebound, and Russian stocks is one of the best ways to play this rally IMO. Going long YNDX here based on its recent strength vs RSX. I think it's in the position to lead the market up when oil finally bottoms.

More upside for Ruble?We will see if RUB can break through triple top of 72 for the 5th wave up of around 80. We are also looking at a contracting triangle with a possibility of a breakout

India Could Be the Most Resilient of the BRICSThe BRICS (Brazil, Russia, India, China and South Africa) are highly watched emerging markets because they represented roughly 22 percent of global GDP in 2014. However, the global economic slowdown and increased geopolitical tension has weighed heavy on these markets. Although, India may be the most resilient economy out of the BRICS.
India has felt its share of the slower economic climate, as the Markit manufacturing PMI fell to a seven-month low in September, falling to 51.2 from 52.3. According to Markit, there are signs of sustainable growth but input costs decreased for two months consecutively, which has not happen since the financial crisis. Both manufacturing and industrial output have remained stable. Services PMI has seen improvement since late 2014.
In relation, the Chinese manufacturing PMI clocked in at 47.2 and has been contracting since March while near the worst levels since March 2009.
Due to the slack in the economy and less than expected inflation, the Reserve Bank of India cut the benchmark rate by 50 bps to 6.75 percent. This strengthened the rupee has investors look for it to hinder capital outflow. It also comes as the People's Bank of China (PBoC) devalues the yuan.
USDINR is likely to fall further as I expect the dollar to remain weak following the onslaught of poor economic data. Friday's non-farm payroll print of 146,000 was well below the 201,000 general consensus. To add insult to injury, August's jobs number was revised lower by 50,000 which left mouthpiece economists in bewilderment.
The Fed's inability to act, in regards to an interest rate boost, will leave the dollar on shaky ground. Fed fund futures traders are not pricing in a potential for Fed action until June/July of 2016 - although, I am forecasting a recession by then.
The USDINR is trending within a descending channel with support at 65.28, but the pair will travel to the 50 percent Fib. retracement at 65.15 (with the 72-daily EMA as further support). Secondary target is 64.83.
Resistance can be found at 65.6060, 65.8337 and 66.1374
Please follow me on Twitter @Lemieux_26
Check my posts out at:
bullion.directory
www.investing.com
www.teachingcurrencytrading.com
oilpro.com

MACRO VIEW: MICEX IN USD RISKS ANOTHER BREAKDOWNRusian MICEX index, measured in US dollars is on risk of another severe breakdown.
Price is now currently trading at a key level - converged lower 1st standard deviations from 1-year and quarterly means (@ 24.75)
If the level is taken out, price will be open to fall to its relevant lows @ 23
and If those are broken down, next target would be 18.5 - the 2014 lows, reached at the peak of USDRUB December spike

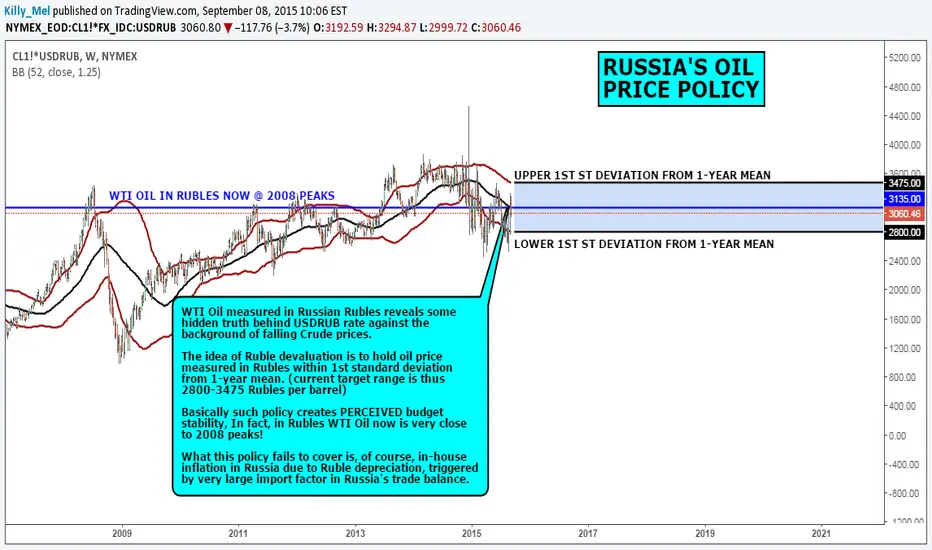
MACRO VIEW: RUSSIA'S OIL PRICE POLICYWTI Oil measured in Russian Rubles reveals some hidden truth behind USDRUB rate against the background of falling Crude prices.
The idea of Ruble devaluation is to hold oil price measured in Rubles within 1st standard deviation from 1-year mean. (current target range is thus 2800-3475 Rubles per barrel)
Basically such policy creates PERCEIVED budget stability, In fact, in Rubles WTI Oil now is very close to 2008 peaks!
What this policy fails to cover is, of course, in-house inflation in Russia due to Ruble depreciation, triggered by very large import factor in Russia's trade balance.
Shorting RTS if it breaks below 1041.57If RTS breaks the wedge(blue), it is likely to continue downwards. Stop loss is above the wedge's upper line. Pattern is invalidated if it climbs higher without breaking the wedge on the downside.

The Russian ruble might come back under pressure soonPeople are starting to talk about the Russian ruble again after 3 months of practically no chatter on the Twittersphere following the December RUB crisis. Amazingly, the ruble is one of the best currencies in 2015. Given the poor fundamentals in the Russian economy, I'm starting to become a bit skeptical on the potential for further USDRUB losses over the medium term (I told my Russian friends in December to hold tight and to NOT start converting to USD as there would likely be a bounce at the start of 2015 on people stopped talking about the RUB on CNBC). Looking at the USDRUB daily chart, I note that the RSI is in oversold territory for the first time since May 2014. At the same time, the USDRUB is about 100 pips from its 200-day moving average (49.47). I'd be looking for support and signs of bottoming somewhere between 47.70 (prior resistance in November) and 49.47. That said, I don't really believe that this pair is one that should be traded, and I'm not personally looking for any exposure here. I just think that the chart is interesting at a time where people are starting to talk about how much the ruble is bouncing back this year.


USDRUB - Friday Bullish Reversal at Range Support!!USDRUB hit the lower end of its 3 month range and reversed producing a Piercing Line candlestick pattern. Slight Bullish Divergence on the short term momentum indicator at the oversold zones suggests a pause and possibly a rebound which could see some profit taking in Equities (RTS Index). If a bounce materializes then the USDRUB will target 60.


$EURUSD Breaks Through Ascending Triangle Bottom$EURUSD Has broken below the ascending triangle bottom and looks set to break through the Double/Triple Top confirmation level 1.0720 (4h close). Another possibility is a rally off this level and a retest of 1.050 but we think this Triple/Quad Top/Double Bottom scenario is less probable. Look to sell any rallies into the broken triangle bottom or LT channel top.

"Tips for buying" _Russian Financial MarketStrengths:
-Enhancement The ruble by 18% from 2014 lows against the euro and dollario .
-Stock exchange ( MICEX ) since the beginning of 2015 to + 16 %
-Large Margin recovery for the ruble to reach the pre-crisis levels of June 2014 .
-Rate Interbank Repo 14% cut in view of the revision of reducing inflation (target 2017-4 % )
- Bond 10y 12%
- Bond corporate high
-a Ratio of debt / GDP ratio to a minimum ( 13 vs 132 Italy )
- Unemployment the US levels (about 5.8)
Points of weakness:
GDP in 2015 negative , reflects the impact of the devaluation of the ruble , the sanctions and the collapse of commodity prices .
Financial markets anticipate more than economic

Has Russia Bottomed Out?Russia has been a hot bed of geopolitical issues through out 2014. However, the Russian stock market has bounced by over 17% year to date(as measured by the RSX etf).
Fundamentals
Since Russia entered into a cease fire with Ukraine the sails have been in stock markets wind. Even with the major positive movement the Russian ETF, RSX is still at a 5 year low. The Russian economy depends heavily on oil and gas production, which accounts for 70% of Russian exports and approx 50% of the budget. Since entering into a recession in early 2014, clearly its economy has been hit hard by lower oil prices .
As Oil companies, adjust for lower oil prices, but reducing exploration and reducing rigg counts, you can clearly make a case for higher Oil, later on in the year. Also if there are any, reduction in OPEC supply this will be good for the Russian economy as well, which will directly translate to good earning for Russian oil companies.
Russia has been very volatile lately and has experienced a downgrade, however its not likely that there will be a debt default situation since Russia's reserves can cover them for at least 2 years, the debt to GDP is lower then most other countries and its depressed currency will help to increase exports on the open market. All of these factors have the potential to give the economy a bit of boost and deliver it out of recession.
The one dark cloud, is the continued sanctions that are being imposed by The US and other European countries, which have been extended for another year.
Technicals
After reviewing the monthly chart of RSX, its appears that its may have bottomed. The RSI indicator, has moved above over sold territory. The last time the RSI indicator was in oversold territory was during the 2008 market crash and it staged a massive rally over the last 5 years.
After reviewing the Fibonacci retracement levels the stock is just below the 23.6% level. Going at its current trajectory if it breaks that level it will indicate that its being a new uptrend.
The Trade
Currently, RSX is trading at $17.38. I see this as a long term investment, but I believe there is plenty of room to trade it.
Trading Targets ( 1 - 6 months)
Short Term profit target is: $21.35(23.6% Fib Level)
Short Term Stop Loss: 16.86 (3% Stop)
Investment Targets ( 1 - 5 years)
Long Term profit target: $40.16(61.8% Fib Level)
Long Term Stop Loss: $14.06( Previous Low)

"Crude Oil" a Huge profit to be madeCrude oil is making new grounds with it soon to
come with its reverse pull back, same thing
happened in 2009 although there is a possibility
that crude can slide to support at 40$. either
way i will be easing my way into a positions
using the ETF UWTI which is priced very cheaply
at 3$ a share. also a big shout out to @Ricker for showing me UWTI

$RSX, $USO, $UAE correlation. Consolidation before volatility. The market has shift anticipation period. Now should consolidate. Volatility around $60 per barrel should drag for awhile now.

WTI Near "Support" While Sentiment Still To The DownsideWTI has played out fundamentally, and the fundamentals (along with sentiment) still remain to the downside. Traders love to pick out bottoms by catching falling knifes, and they're usually cut up in the process.
On a risk:reward basis, sure WTI may seem like it's at a nice area to buy. Yet, I think it is still to early. Crude will likely find support at the longer-dated support in the low $43's per barrel. While I would suggest opening fresh shorts without a pullback, it still may be early to gobble crude futures.
The implications are still apparent. Supplies are still gluttonous, and shale companies are hurting. WBH Energy has become the first casualty of the oil warfare. I expect more to come, particularly Cheniere (idea to come).
I have been short since $74, and I wouldn't suggest serious upside unless $53.5 is retaken.

WTI Consolidates on WeaknessIn my previous analysis "Que 2008," I likened this drop in oil similar to the one we've seen in 2008. This was based on both over leverage in the oil and equity markets, diverging fundamentals and a strengthening dollar throughout 2009 - which brought on deflation.
Prices did collapse through $60 as expected, and nobody is willing to cut production to reserve market share. The UAE Energy Minister said $40 oil is quite possible and nothing to worry about within a three-month period.
The problem is, whether it's OPEC nations or US shale producers, lower prices will cause ongoing degradation of the sector.
US energy CAPEX looks to be reduced significantly (2/3 CAPEX in S&P500), as producers are already cutting jobs, future CAPEX and turning rigs offline - as we seen in 2008.
Some have hope that these moves will help position companies for a bounce back. However, I liken that to companies cutting jobs and buying back shares to boost earnings. It doesn't work in the long run.
Without demand, oil will remain much lower than previously seen. Limited growth in the US and emerging markets and no growth in Europe is setting the stage for subdued prices.
If WTI closes below $53.50 per bbl, I expect technical "trap door" selling, and we could see mid-$40s per bbl.
Conversely, a close above $59 could send prices to $65 per bbl in order to re-balance to sharp decline. However, if fundamentals remain weak, support will remain weak.
