XRP General MovesRecent Price Movements and Potential Future Outlook
XRP, also known as Ripple, has been in the news recently due to some positive developments, which have led to a price increase. However, the price of XRP has been volatile and has experienced significant fluctuations in the past few weeks. In this article, we will analyze the recent price movements of XRP and discuss its potential future outlook.
Price Movements
On March 31, 2023, the price of XRP reached a high of 0.588 USD, which was the highest it had been in several months. However, the price soon began to decline, and it currently sits around the 0.5 USD mark. This price decline can be attributed to several factors, including the overall market conditions, as well as concerns about the potential impact of Bitcoin's price movements.
Support Levels
Despite the recent price decline, there are some good support levels for XRP. The 0.5 USD mark is a significant support level, and it is possible that the price may bounce back from this level. Additionally, the 0.432 USD mark, which is where the rally started, could potentially be retested in the next few days. If this occurs, it may present an opportunity to buy XRP at a lower price.
Future Outlook
The future outlook for XRP is uncertain, and much will depend on the overall market conditions and the movements of other major cryptocurrencies, such as Bitcoin. If Bitcoin's price continues to decline, it is likely that XRP will also experience a price decline. However, if the market stabilizes and Bitcoin's price begins to increase again, XRP may also experience a price increase.
Conclusion
In conclusion, XRP has experienced significant price movements in the past few weeks, and its future outlook is uncertain. While there are some good support levels for XRP, it is important to be cautious when trading in these volatile market conditions. It may be worth waiting for further confirmation before buying XRP, especially if there are concerns about the potential impact of Bitcoin's price movements.
Russia

Bitcoin : Be Ready for the next moves Good Day Everyone
Bitcoin's Consolidation at 28/28.5k Areas Suggests Possible Retest of 25k Areas
Bitcoin, the world's most popular cryptocurrency, has been consolidating in the 28/28.5k areas for some time now. This consolidation phase suggests that a possible downside move may be in the cards, with the 25k areas being the likely target for a retest.
One of the key indicators that support this bearish scenario is the RSI (Relative Strength Index), which is currently in overbought territory on the daily timeframe, with readings above 60 points. This level of RSI typically suggests that an asset is due for a corrective move.
Furthermore, the wave 5, which was previously discussed, is now completed, and any further extension would require a breakout above the 29k areas. However, the current price movements and volume do not seem to support such an upward move anytime soon.
Given the current market conditions, the best trading strategy, in my opinion, would be to sell around the 28.4/28.5k areas, with a stop-loss set above 29k. For those trading on leverage, it is advisable to use a low leverage of 3-5x maximum to minimize potential losses.
Overall, while there is still some uncertainty in the crypto market, the consolidation phase at the 28/28.5k areas and the overbought RSI suggest that a corrective move may be imminent, with the 25k areas being a likely target for a retest. As always, it is crucial to stay up-to-date with the latest market developments and adjust trading strategies accordingly.
Good Luck And Have A Nice Weekend

GOLD AND WORLD TENSIONS GOOD DAY FELLAS
Gold, represented as XAU USD, is currently trading at 1980 USD. While many market participants expect gold to break its previous high of 2080 USD, there are diverging opinions on the future price direction of gold. In this analysis, we will explore the fundamental and technical factors that could influence the price of gold in the short and long term.
Fundamentally, gold is seen as a safe haven asset, and its price is often influenced by geopolitical tensions and economic uncertainty. The US dollar is also an important factor in the price of gold, as they are inversely correlated. As the dollar weakens, gold becomes relatively cheaper for holders of other currencies, and demand for gold tends to increase. Conversely, when the dollar strengthens, the demand for gold weakens.
Currently, tensions around the world are high, and there is economic uncertainty in various regions. The US dollar is also under pressure due to the increasing national debt and the ongoing tensions. These factors suggest that demand for gold could increase in the short term. However, I believe that the US will not allow markets to turn against the dollar, which could impact the price of gold.
From a technical perspective, i believe that gold is currently undergoing a correction on the weekly time frame. This correction is targeting the downward support zone, which intersects with the golden ratio of Fibonacci at 1370-1500 USD dollars. This zone is seen as an attractive level to buy gold. Fibonacci ratios are often used by technical analysts to identify potential levels of support and resistance in financial markets.
In summary, the current price of gold is 1980 USD, and there are diverging opinions on its future price direction. While geopolitical tensions and economic uncertainty could support the price of gold in the short term, the US dollar and government intervention in markets could limit its upside potential. From a technical perspective, gold is currently undergoing a correction, and a potential buying opportunity is seen at the support zone of 1370-1500 USD dollars
A LIKE ON THIS POST WOULD HELP ME A LOT IF YOU PLEASE ,,

bitcoin and world war 3Good Day Everyone
It is understandable to feel cautious about investing and trading in the current geopolitical climate. There are indeed tensions between several countries, such as China and the USA, Israel and Iran, and Russia and NATO, among others. These conflicts could potentially escalate and lead to a full-scale world war.
However, it is important to keep in mind that predicting the occurrence of a world war is complex and uncertain. While there are geopolitical risks, these do not necessarily mean that trading in decentralized assets like cryptocurrencies will inevitably result in the loss of all your money.
Investments, including trading in cryptocurrencies, always involve risks. Risk management is an essential aspect of investing, and it is up to each individual to assess and manage their own risk tolerance. While the current global situation may warrant caution, it is important to remember that diversification is key to managing risk.
Bitcoin, the world's largest cryptocurrency by market capitalization, has recently been trading at around 29,000 USD. This is a significant drop from its all-time high of nearly 65,000 USD in mid-April 2021. The volatility of Bitcoin and other cryptocurrencies is well-known, with prices often fluctuating wildly in response to a wide range of factors, from news events to regulatory changes and market sentiment.
One major factor that is currently contributing to the uncertainty and volatility in the cryptocurrency market is the prospect of a potential world war. While the likelihood of such an event remains uncertain, there are certainly many geopolitical tensions and conflicts around the world that could potentially escalate into something more serious. In such a scenario, investors may be looking to reduce their exposure to high-risk assets like cryptocurrencies and move their money into safer, more stable investments.
It is worth noting, however, that the decision to pull out of cryptocurrencies and other high-risk assets should not be taken lightly. While these investments can be volatile and risky, they can also offer potentially high returns for those who are willing to take on the risk. Moreover, there are many factors that can affect the price of cryptocurrencies, including government regulations, technological advancements, and changes in investor sentiment.
Therefore, it is important for investors to carefully consider their options and assess the risks and rewards of different investment strategies. It may be wise to consult with a financial advisor or investment professional before making any major investment decisions.
In the meantime, it is important to stay informed about the latest developments in the world and to monitor the situation closely. While there is no way to predict the future with certainty, having a solid understanding of the risks and opportunities in the market can help investors make informed decisions and navigate the ups and downs of the crypto market.

GOLD TRIPLE TOP - WAR END?All eyes are on Chinese President Xi Jinping’s state visit to Russia that begins on Monday. During the three-day visit, the leaders of the two nations will discuss the deepening of economic and political cooperation as well as the war in Ukraine.
If this meeting tends to reach a diplomatic solution to end Russia-Ukraine war then Gold will see a massive sell-off.
Also, FED is very likely to add a 25BPS to reach 5% interest rate, kinda expected but it brings more pain to markets.
I will keep updating this, follow to get alerts 🔔


European Gas March 2023: Bullish and Bearish FactorsThe idea has two parts: fundamental and technical analysis . The latter is based on the weekly chart.
On the fundamental side , several essential and minor factors affect and could affect March 2023 price change. Let's divide them into three groups.
Bullish :
Russian shutdown of gas supply to Europe
Russia has cut its European flows for the last months so that a total shutdown would be possible. Russian gas remains crucial for the European economy despite the American armada of LNG ships.
Freeport LNG plant Restart Shift
The company plans to restore the plant in January 2023. A possible postponement would support TTF prices in the winter season.
Limitations of US Gas Exports
Last winter, some US Senate members suggested limiting or prohibiting US LNG export. They estimated that the change would increase US gas supply for the internal US market, especially for New England, which is dependent on the import of gas from the gas-production states getting gas via pipelines and LNG. They said the prohibition would reduce high gas prices for customers and industry. In July, LNG winter 2023 prices for New England touched a record high of $40/MMBtu, while Henry Hub traded at about $8.6/MMBtu. I suppose that senators would return to the idea, especially since the US elections are in November. Although the risk is low, its realization could dramatically affect the TTF price assessment. Analysts and think tanks have considered possible Russian gas cuts but haven't accessed a potential US gas supply reduction.
French Nuclear Plants Outages
Since the end of 2021, the French nuclear industry has been weak with planned and unplanned maintenance. As a result, nuclear output has lost more than 40% YoY of its output. While serious issues are unlikely to arise, new minor obstacles could buoy TTF prices.
Dry Summer
The continuation of the European 2022 dry summer led to abbreviated hydropower production. On the back of hydropower reduction, natural gas-power generation increases its output and gas consumption, driving subdued gas injection into storage facilities. Subdued gas injection in summer means less gas for winter, creating a possible gas deficit.
Bearish:
Slowing European Economy and Demand Destruction
High inflation induced by the monetary policy of 2020-2021 provokes a decline in real incomes and makes some industrial production unprofitable or near break-even. These debilitate aggregate demand, particularly industrial output of fertilizers, ceramics, and other chemicals. Industries that are heavily reliant on gas are cutting their gas consumption today. Lasting historically high gas prices would promote a decrease in gas utilization. The demand destruction could happen among all consumers: power, industrial and individual. A new recession is near. ECB monetary policy with a growing rate also adds problems to the economy. The rate is still tiny, but debt bubbles are sensitive to interest rate change. The bust of bubbles would drop economic growth and curtail gas demand pushing TTF prices down.
Slowing world economy
The world economy suffers from high prices losing economic growth momentum. A move into a recession would trigger a decline in gas consumption lowering LNG gas prices and letting LNG producers increase LNG sendout to Europe.
Voluntary Demand Reductions of 15% and Gas Rationing
Energy ministers of Europe adopted plans to voluntarily cut gas demand by 15% from August until March 31, 2022. In case of emergency, like near zero Russian flows, the voluntary reduction changes to mandatory. i.e., gas rationing. The actions could divert rising prices.
Covid Lockdowns in Europe
Europe has prepared different measures to withstand possible gas issues in winter. Besides voluntary reduction or rationing Europe could return to the lockdowns of 2020, when gas consumption dramatically went down because industrial production of goods collapsed. Since June 2022, the media has published news about a new variant of Covid. Countries could impose Covid-related limitations this fall. Unstable gas consumption and gas shortage would drive for a Covid or climate lockdown. A good measure to cut gas demand and destroy the economy.
Covid Lockdowns in China
Despite possible lockdowns of 2022-2023 in Europe, lockdowns in China happened in the last months and could be imposed again. An effect of prohibitions has hit the Chinese economy and cut gas consumption resulting in freeing up the supply for other consumers, i.e., Europe. New Chinese lockdowns would mean more gas for Europe.
Joker :
The joker that could be a bullish or bearish driver is the weather. They can't predict winter weather today. Lasting temperatures above season norms in winter could be a lifesaver for Europe, dropping gas consumption and its prices. Cold spells and lingering temperatures under the winter season average would lift prices significantly. Near-average temperatures would put the significance of the factor on hold. While in summer, it is vice versa. Temperatures above the norms slow gas storage injection and slightly increase a lack of gas risk in the winter season.
On the technical side , there are no resistance levels cause the contract is traded near its record high. Only psychological levels like €200/MWh , €300/MWh , and higher. On the bulls' side, there are many support levels. For those practicing buy a bounce trading , essential levels are €125/MWh , €100/MWh , and €86/MWh . The last one developed in the December 2021-April 2022 period. I estimate that Gazprom made a significant contribution to its existence. Gazprom's export price to Europe, which was pegged to a fusion of lagged prices of fossil fuels, including TTF, was near to €86/MWh . So when the market price rose significantly above the level, market participants cut their demand because Gazprom sold cheaper. When the price tried to break through €86/MWh and went down, Gazprom trimmed its flows to Europe. All in all, this helped the company to control its revenues on the same level. Since then, it has not been the case because Gazprom has changed its approach.
Finally, I am afraid to forecast the price on the expiration date. I suppose the price would remain volatile, and we could see spikes above €200/MWh in the winter season.
Thank you for your reading, and have profitable trading! Comment your thoughts!

What commodities will move in the 2nd year Russia-Ukraine War Russia-Ukraine War entered the second year. Most of the commodities skyrocketed after the invasion had returned to or below the pre-war level. Energy is the market focus but the price dropped below the pre-war level and might not have enough geopolitical moment to rebound unless the war fully escalates and spreads to other countries. The weakness of wheat price might reverse if Russia refuse to renew the export deal.
Energy products are the main focus in this war since Russia is the world’s key energy exporter. NYMEX WTI crude oil price started from USD92.10 as of the close of 23 Feb 2022, and reached an intraday high of USD130.5 per barrel in March. NYMEX Natural gas is even more volatile, jumped from USD4.623 per MMBtu to reach over USD10 in August. However, despite the sanction and price cap imposed by western countries, the energy exports from Russia maintained at high level, and European winter weather is relatively mild together with the effort to secure supply from non-Russia energy sources, the supply and demand situation is much less bad than many had feared, and the energy price retreated significantly and dropped below pre-war level. As of 24 Feb 2023, NYMEX Natural gas closed at USD2.548, while NYMEX WTI crude oil closed at USD76.32.
Assuming the war are restricted in Ukraine and haven’t spread to other European countries, the war will no longer have a material impact on energy price. Western countries don’t want to shut down Russia’s energy supply completely, they just don’t want Russia to make a lot of money from energy exports to finance the war. The ideal situation is Russia selling cheap oil and gas to global market. In fact, Russia is still exporting a lot of their energy products to China and India, and the reduced demand from them in the global market pressured the price. I can’t predict the outcome of a war, but a win by Ukraine might further pressure the energy price since Russia might probably need to aggressively sell their energy for war compensation and rebuilding the country. Even the war maintains the status quo for an extended period of time, it will not stimulus the energy price like last year since many countries had already reduced the reliance on Russia’s energy.
What I worry more is grain price. Russia and Ukraine together are supplying one third of global wheat. Many of the Ukrainian grain planted in the Southern and Central part of the country, that had been seriously affected by war. Ukrainian grain exports dropped nearly 30% in the last marketing year. Not only the plantation area will be affected, all the input including labour, fertilizer and chemical supply are also affected, not to mention the harvest and the logistic to export the grain. Grain export deal with Russia is expiring on 19 March, whether Russia will renew it could be a catalyst for market movement, and the lower price of Ukrainian grain because of this uncertainty might also reduce farmer’s willingness to plant wheat.
Russian grain production hasn’t been affected yet; in fact, the harvest of wheat is pretty good. When energy crisis didn’t realize, whether Russia will weaponize grain will need further monitor. At this moment, grain export is not targeted by western countries, so Russia might try to export as many grains as possible to improve their financial situation, but if the war situation turned sour, I can’t rule out the possibility of some form of export ban which might make the inflation situation in western countries more complicated.
CBOT wheat price started from USX 884.75 as of the close of Feb 23, and reached an intraday high of USX 1363.5 per bushel in March. As of 24 Feb 2023, it closed at USX 721.75. Of course, the weakness could also be explained by bumper crop from Australia and an expected high US production in the coming year. Technically USX 712.5 is an important support, and RSI is approaching oversold level. We might consider a long position @ 715, stop loss @ 680, target @ 800.
Disclaimers
Above information are for illustration only and there is no guarantee on the accuracy of the information. They should not be treated as investment recommendations or advices.
CME Real-time Market Data help identify trade set-ups and express my market views. If you have futures in your trading portfolio, check out on CME Group data plans in TradingView that suit your trading needs www.tradingview.com

SBER - largest Russian fintech company - 30-50% growth til AprilHere is my look at the largest Russian bank and fintech company - Sberbank (shorted from "sberegatelniy bank" - "bank for savings"). It's bee called Sber for several years because it's more of a fintech company than just a bank now.
The idea is simple. You can see a sine wave which is mirrored relatively to the symmetry center (centerline). The timing it: 205 rub minimum, maybe 240 rub per 1 stock till the end or March.
It should mean that overall Russian stocks market would feel great too.


Crude Oil to go higher in March?"Russia will reduce crude oil production by 500,000 barrels per day from March after major economies imposed a price cap on oil products." as reported by BBC News online portal few days ago.
Saudi Arabia and OPEC already cut crude oil production in January 2023. We may see energy prices go higher, due to restricted supply.
Cost of goods and services will be more expensive, contributing to inflation once again. Price caps are looking like its going to back-fire and everyone will be affected by it.
Well, it is sideways now. Let's see what happen when March comes.
By Sifu Steve @ XeroAcademy

Russian stock market doubled - now signs of a TOP after electionNews shows Putin's party probably won parliamentary elections in Russia
The Russian MICEX index rallied from 200K at the bottom (March 2020) to over 400K (Sept 2021).
The index put in a small bearish shooting star last week.
Confirmation would be if it broke the rising uptrend connecting lows of past few months

Short Russia"By the time you come to, you're gonna need a new haircut" - Gary Bertier, Remember the Titans.
Russia looks like it is setting up for another wave down. Kinda hard to grow when the economy is cutoff from the world. The Ruble is also getting trashed (has been for decades), despite some "professionals" pumping lies about the ruble being "so strong" in 2022.

Rheinmetall bullish ascending triangleThe ascending triangle points to a potential increase in the value of Rheinmetall's stock. These indicators include a bullish trend in the stock's price over the past several months, positive momentum, and strong support levels. Additionally, historical data shows that Rheinmetall's stock tends to perform well during times of military threats or escalations, which may indicate that current global events could be contributing to the stock's upward trend.
Hopefully, the war in Ukraine will come to an end, but Rheinmetall is still looking strong, possibly indicating an upcoming real-world event.
It is important to note that technical analysis is not a guarantee of future performance and should be considered alongside other forms of analysis such as fundamental and news analysis. Additionally, it is also important to consider the company's overall financial health and any recent company-specific news or announcements.

GOLD ( You can buy and sell gold from regions )Hello, it is a simple analysis based on support and resistance. I hope you trade with caution, because there is news that will be issued soon
You can buy gold when you have strong liquidity
gold note to 2000 !
I wish you a wonderful holiday

GAZP Gazprom to 206$ Buy Now !!!According to my chart analysis , GAZP GAZPROM Show strong signal to buy , buy max as you can .

BCO Technical Analysis On a we weekly we have gotten close to our resistance level
we can get the following two plays: price going up and closing above 86.149 on a weekly chart or we may get pullback where then we will have to evaluate longs
for now i am bullish since levels held perfectly
my entries are pullback after retest (roughly as demonstrated on the chart)
Let me know your ideas on oil!

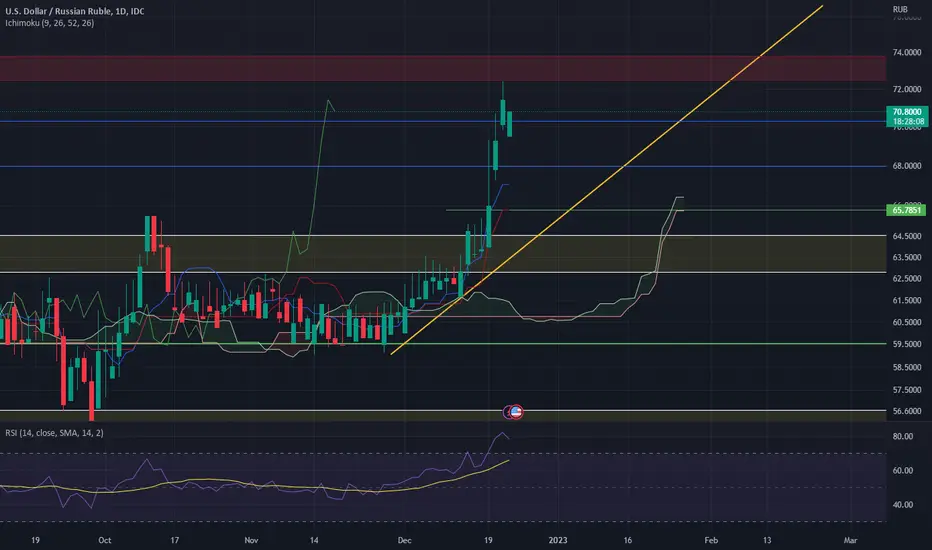
forex usd rubits so hard to find but it possible will be increase till 73 after that we have pullback
so u should be carefull
at all its so good
BCO/USD Technical Analysis Hello Traders!
Based on the fact that we stopped without hitting a 72.0 level tells me that its is very likely that buyers who bought set out their sl on the next support.
Furthermore, trend hasn't changed and what is happening is a pullback. Im looking to sell on two levels risking total 3% of my trade position.
82.3 and 86 are two levels of my interest for the short side.

Is US Oil Running Low on EnergySUMMARY
Lowered demand projections for Crude Oil as per IEA and OPEC+, softer demand for Crude Oil in China despite partial loosening of restrictions as per EY, the G7-Russian Crude price cap which would lower demand for WTI Crude.
We are short-term bearish on WTI Crude Oil. However, it should be noted that there may be very limited downside in price as the Biden administration plans to replenish the Strategic Petroleum Reserves at prices between $67-$72.
As such, this case study argues that a short position in CME’s NYMEX WTI Crude Oil Futures (February 2023) could provide an interesting trading P&L profile at an entry price of $77.80/barrel with a target of $73.65/barrel with a reward-to-risk ratio of 0.86. A stop loss could be set at $82.61/barrel or the Pivot Point.
OIL PRICE HISTORY
After temporarily dipping at the start of the pandemic, WTI Crude Oil prices rallied through 2021. This was a result of demand bouncing back rapidly as economies re-opened post-pandemic.
This led to dwindling oil reserves in the US and the wider OECD countries. Shortage was further exacerbated by OPEC+ choosing to boost supply gradually.
Finally, prices were pushed even higher given the Russian-Ukraine conflict which threatened to limit the available supply of Crude Oil, of which Russia is the third largest producer according to the IEA.
However, following this peak, prices started to cool off as high inflation dampened demand for oil. This led WTI to erase most of its 2022 gains. WTI prices have retracted back to the start of 2022 twice since then, in September 2022 and in November 2022 again. However, price quickly rebounded off this level as OPEC+ announced supply cuts totaling 2 million barrels per day (real cuts were estimated at 1 million barrels per day as mentioned by Prince Abdulaziz, Saudi Minister of Energy). OPEC+ maintained its lowered output targets at a meeting on the 4th of December 2022.
OPEC also lowered its oil demand forecast for 2022 and 2023 by 100k barrels per day in November.
WTI price has declined 43% from its peak in March.
CHINA
China is experiencing a sharp resurgence in COVID-19 cases this year. Combined with the government’s zero-COVID policy, this led to large scale and strict COVID curbs. This further impacted the demand for oil, of which China is the 2nd largest consumer.
However, at the end of last month, Beijing notably changed its stance and has started to ease restrictions somewhat in parts of the country. Expectations are for China to open in entirety in Spring 2023.
According to EY, demand for Crude Oil in China is expected to be 1.2M barrels per day lower in Q4 2022. This further provides a short-term bearish outlook for crude oil.
STRATEGIC PETROLEUM RESERVE
To better manage spike in oil demand following the pandemic, Biden administration has been drawing large amounts of crude oil from its Strategic Petroleum Reserves. They drew nearly 200 million barrels from the Strategic Petroleum Reserves in 2022. In a mid-term election year, the administration was forced to resort to this to tame sky-high gasoline prices at pumps.
The Biden administration’s move has been seemingly successful in managing the price of gasoline which has declined from $5 to $3.5. Unsurprisingly, this has also drained a large portion of the US strategic reserves, taking it down to 389.1 million barrels, its lowest level since 1984.
The Biden administration has stated intentions to replenish the Strategic Petroleum Reserves when prices are between $67-$72 per barrel. This provides a potential floor on the price of oil if the plan is followed through, limiting potential downside in price.
Starting end of November, the administration followed its promise to wind down the use of the Strategic Petroleum Reserves. They drew just 1.4 million barrels in the week, far lower than the average of 6 million barrels/week over the past two months. However, this led to crude inventories in the country to plummet sharply by 12.79 million barrels. Still, this poses a potential challenge for the administration as it can no longer supplement crude supply in the country using Strategic Petroleum Reserves leading to higher demand in the open market.
US CRUDE INVENTORIES
Crude oil inventories in the US have seen large declines over the past three weeks. Contrasting this with Gasoline and Distillate stockpiles, which have instead increased. This is a result of high crack spread, which represents refining profit margins. As a result, US refineries are running at 93% of capacity highlighting that although crude oil stocks have been declining, it is primarily due to windfall margins available to refiners instead of high demand for crude oil.
G7-RUSSIA PRICE CAP
The EU has imposed an embargo on imports of Russian Crude Oil by sea using G7 and EU tankers.
G7, Australia, and 27 EU countries imposed a price cap on Russian crude oil transported by ship. The cap is aimed at reducing the margins that Russia makes on crude oil sales which it is alleged to fund its military actions in Ukraine. The price cap provides third countries the ability to acquire Russian Crude Oil at or below the price cap.
The price cap was set at $60 per barrel, while Russian Crude Oil closed at $67 per barrel on Friday. The level will be reviewed every two months, starting in mid-January, to make sure it stays at least 5% below the average price for Russian crude as determined by the IEA. Each change in the cap will be unanimously agreed by all 27 countries of the EU and then by the G7.
The price cap makes it challenging for Russia to sell its Crude Oil at a higher price as most shipping companies are based in the G7. This could provide a source of cheaper crude for countries that still trade with Russia, thereby lowering the demand for the more expensive WTI Crude oil.
Notably, Russia stated that it would not accept the price cap and would not sell its oil subject to the price cap, even if it is forced to curtail production. Additionally, Russia is already selling its Crude Oil at discounted rates to China and India relative to WTI or Brent.
TECHNICAL SIGNALS AND PEEK INTO COT REPORT
CME’s NYMEX WTI Crude Oil Futures (February 2023) closed at $77.37, below the Pivot Point $82.61 as on Tuesday. R1 from the pivot indicator was at $91.62 while S1 was at $71.48. CME’s NYMEX WTI Crude Oil futures hit a low of $73.6 on November 28 before rebounding.
Stochastic indicator was at neutral as on Monday while RSI recently intersected its declining SMA which could point to a potential reversal in the downtrend.
100-day moving average is currently declining and stands at $87.4757, in case the short-term moving average (10 days) intersects this, it could point to a potential breakout. 10-day MA is currently at $78.77. For now, the 100-day moving average acts as resistance.
According to the CME Commitment of Traders tool, we observe that Users, Managed Money, and Swap Dealer short positions declined between November 22 and November 29. Other reportable and non-reportable short positions went up. Long positions also declined by a similar margin while spread positions increased 3.3%.
ATM Implied Volatility from WTI Crude Oil options on CME was at 48.25% on Friday, down from ~53% in the prior week. This provides a daily expected move of 3.04%. As such the low on 28/November is within 1x standard deviation of the pivot support ($73.65) and 2x standard deviations of the pivot support is at $75.83.
TRADE SETUP
CME NYMEX Micro WTI Crude Futures provide exposure to 100 Barrels of WTI Crude oil with a maintenance margin of $750. This provides a cost-effective way to get exposure to movements in Crude’s price.
Short Position on CME NYMEX Micro WTI Crude Futures – February 2023 Contract
Entry: $77.80/barrel
Take Profit Target 1: $75.83/barrel
Take Profit Target 2: $73.65/barrel
Stop Loss: $82.61/barrel
Establishing a short position CME NYMEX Micro WTI Crude Futures (February) with an entry price at $77.80/barrel with a potential take profit target at $75.83/barrel by February could provide exposure to a short-term correction in the price of WTI crude yielding 26.27% returns or $197. A stop loss at the Pivot Point $82.61/barrel would protect against an unexpected rally resulting in loss of $481 or -64.13% providing a reward to risk ratio of 0.41. Alternatively, holding the position until 1x standard deviation of IV of ATM option above the pivot point would lead to 55.33% returns or $415 resulting in a reward-risk ratio of 0.86.
CME’s full-size NYMEX WTI futures provide exposure to 1,000 barrels of WTI crude with a maintenance margin of $7,300 at the time of writing and provide improved liquidity in case of larger positions.
MARKET DATA
CME Real-time Market Data help identify trading set-ups and express market views better. If you have futures in your trading portfolio, you can check out on CME Group data plans available that suit your trading needs www.tradingview.com
DISCLAIMER
Trade ideas cited above are for illustration only, as an integral part of a case study to demonstrate the fundamental concepts in risk management under the market scenarios being discussed. They shall not be construed as investment recommendations or advice. Nor are they used to promote any specific products, or services.
This material has been published for general education and circulation only. It does not offer or solicit to buy or sell and does not address specific investment or risk management objectives, financial situation, or particular needs of any person.
Advice should be sought from a financial advisor regarding the suitability of any investment or risk management product before investing or adopting any investment or hedging strategies. Past performance is not indicative of the future performance.
All examples used in this workshop are hypothetical and are used for explanation purposes only. Contents in this material is not investment advice and/or may or may not be the results of actual market experience.
Mint Finance does not endorse or shall not be liable for the content of information provided by third parties. Use of and/or reliance on such information is entirely at the reader’s own risk.
These materials are not intended for distribution to, or for use by or to be acted on by any person or entity located in any jurisdiction where such distribution, use or action would be contrary to applicable laws or regulations or would subject Mint Finance to any registration or licensing requirement.

USDWTI D1 - Short Signal PendingUSDWTI D1 - Finally starting to see a bit of support here on crude oil… 76.50 is still out preferable sell zone, healthy correction from latest swing high to swing low, which ties is nicely with out preciously broken support zone.
Simply looking for the retest of that broken zone to position ourselves short, in aim of fresh lows.

EUR/USD Technical AnalysisReversal trend has formed. Looking for pullback to enter long and confirmation of strong support level.
Need to hold 0.99 level in order to keep the bullish trend.

The West Takes Aim at Russian Oil MarketsAs tensions continue to escalate between the West and Russia, a new development has emerged in the ongoing struggle over oil shipments. The West has been using shipping insurance as a tool to put pressure on Russia, but this strategy has had limited success so far. Insurance is only available for shipments valued at less than $60 a barrel, and as it happens, Russian oil already trades just below this cap. As a result, it's not yet clear how much of an impact this will have on oil prices.
But this raises an interesting question: why would the West set the cap at this level? The answer, it seems, is that they've calculated it in such a way that it provides just enough incentive for Putin to keep pumping oil. This is because the West is understandably concerned that Putin might choose to remove Russian oil from the international market, causing prices to rise significantly. And if global oil prices do rise much above where they currently are, the situation could become much more heated.
This is just one example of the complex dance that goes on between petronations and the West. On the one hand, the West has the ability to put pressure on petronations by limiting their access to the global market. But on the other hand, petronations have the power to put significant pressure on the West via energy prices. So it's a delicate balancing act, and it's not always clear who has the upper hand.
But what does this mean for the future? Well, it's difficult to say for certain, but it's clear that the West is trying to find a way to put pressure on Russia without causing a major disruption in the global oil market. And if they're successful, it could have significant implications for the ongoing struggle between the West and Russia.
Of course, there are many other factors at play here, and it's impossible to predict exactly how things will unfold. But one thing is clear: the discussion around this issue is only going to become more heated as global oil prices continue to fluctuate. So it's definitely a topic worth keeping an eye on in the coming months and years.
