RUSSELL 2000

Nasdaq Market Update for 10/23Trend lines drawn from 9/3 (36d), 9/24 bottom (22d), 10/12 pivot day (10d), 10/19 (5d), and today 10/23 (1 day).
Friday, October 23, 2020
We were runnin' against the wind
Facts: 0.37% higher, Volume lower, Closing range: 100%, Green Body: +11%
Good: Held above key support at 21d EMA
Bad: Low volume, not much price movement
Highs/Lows: Higher high (by a fraction), higher low
Candle: Long lower wick as investors bought up the lows to end nearly where the day started.
Advance/Decline: 1.63, more advancers than decliners
Sectors: Communication Services (XLC) led the day with +0.94% gain. Consumer Discretionary (XLY) also had a good day at +0.88%.
Expectation: Higher
One more day of reversals to close a choppy week. Every day this week had a morning move that reversed once or more by close. Earlier in the week it was higher highs that reversed to lower lows. At the end of the week, it was lows that reversed to close with gains. Today the Nasdaq ended with a +0.37% gain. The candle has a tiny 11% green body and 100% closing range as the day ended at its high, but not much above where it started. There were more advancing stocks than declining stocks at a ratio of 1.63. Volume was lower than the previous day and much lower than average volume over the past few weeks. The index tested the 21d EMA again and stayed above it.
The S&P500 had an even tighter range between open and close and ended with a similar +0.34% gain. Communication Services (XLC +0.94%) had the best gains among sectors fueled by positive gains from social platforms. Consumer Discretionary (XLY +0.88%) also did well today, with a mix of discount retailers, auto parts and restaurant/service companies doing well. Technology (XLK -0.11%) and Energy (XLE -0.49%) were the worst performing of the day. The Russell 2000 capped off a winning week with another +0.88% gain.
Google (GOOG +1.59%) continued the momentum it has gained the last few weeks while Microsoft (MSFT +0.62%) and Amazon (AMZN +0.88%) finally found some support with significant gains. Apple (AAPL -0.61%) and Amazon remain under their 21d EMA and 50d MA lines. The story of the week has been Snap (SNAP +10.78%) which continues to have incredible gains after it’s earnings release. More growth stocks have turned back toward gains which is a positive sign for continued gains next week.
Continuing today’s trend into Monday would mean around a +0.66% gain, splitting the difference between the 1d trend line and the trend drawn from the 9/3 correction. The trend from the 9/24 bottom is +2.67% from today’s close and is a possibility if good news comes over the weekend to fuel gains.
As the index continues to test the 21d EMA, it’s possible it can find itself below that line. That would continue this past week’s trend to a -1.29% loss and land under the October Support area. Further losses would find the 50d MA and the index would likely get support at that level.
I'm keeping the June Support line in view, but its ~13% below the Friday close and there are 4 key support levels that the index would have to break thru. If we have a significant downside that takes the index below 11,300, then I'll add that possibility back to the chart.


Nasdaq Market Update for 10/22Trend lines drawn from 9/3 (35d), 9/24 bottom (21d), 10/12 pivot day (9d), 10/16 (5d), and today 10/22 (1 day).
Thursday, October 22, 2020
Livin’ on a prayer.
Facts: 0.19% higher, Volume lower, Closing range: 76%, Red Body: -12%
Good: Reversed from morning lows to end day positive
Bad: Dipped below 21d EMA
Highs/Lows: Lower high, Lower low
Candle: Looks like a hammer, 12% red body with 76% closing range.
Advance/Decline: 1.76, more advancers than decliners
Sectors: Energy (XLE) had a huge 4.13% gain. Financial (XLF), Health (XLV) and Utilities (XLU) also had good days.
Expectation: Sideways or Higher
Finally, there is a bit of character change in the market. After several days of morning gains selling off in afternoon trading, the opposite happened on Thursday. A big morning loss that took the index below the 21d EMA was bought back in the afternoon to end the day with gains. The Nasdaq ended the day with a 0.19% gain. The candle, with a 76% closing range and 12% red body looks like a reversal hammer. That will need to be confirmed with the next few days of trading. Volume was lower (my indicator above is based on QQQ volume) for the Nasdaq and continues to be lower than average volume in recent weeks. For a true hammer candlestick, we'd want to see higher volume. There were more advancing stocks than declining stocks at a ratio of 1.76. It’s a positive sign that the index regained it’s ground and closed above the 21 day EMA.
The S&P500 had a similar pattern and closed the day with a 0.52% gain, led by Energy (XLE +4.13%) and Financial (XLF +1.99%). Most of the sectors saw gains on the day. Technology (XLK -0.24%) and Real Estate (XLRE -0.70%) were the worst performing. The Russell 2000 Index had gains of 1.65% as investors looked for good opportunities in small cap stocks.
Google (GOOG +1.38%) led the mega-cap stocks with it’s second day of solid gains. Apple (AAPL -0.96%) and Amazon (AMZN -0.27%) had losses on the day and continue to trade below their 50 day MA. It would be a positive sign for an overall upward trend if these mega-caps got back above this key line. Chevron (CVX +3.57%) and Exxon Mobil (XOM +5.13%) along with almost every energy stock saw gains after talk of consolidation in the industry and layoffs at Exxon. Snap (SNAP +6.77%) continued it’s rally after an earnings breakout. Several growth stocks such as Restoration Hardware (RH +4.34%) and Zoom (ZM +1.43%) had gains after several days of losses. This is all a good sign, but needs to be confirmed with additional gains from more growth stocks.
If the candlestick hammer is confirmed and we see gains from here, trend lines point to two possibilities. The first is a +1.01% gain in the area between today’s trend line and the trend drawn from the 9/3 correction start. Additional positive news could accelerate gains to reach the trend line draw from the 9/23 bottom. That would mean a +3.42% gain.
If the index cannot hold above the 21d EMA, then the 5 day trend and trend from the 10/12 pivot would point to a -1.50%. This is where the 50d MA line is at and where we’ve seen support from September trading.
I'm keeping the June Support line in view, but its ~13% below the Thursday close and there are 4 key support levels that the index would have to break thru. If we have a significant downside that takes the index below 11,300, then I'll add that possibility back to the chart.

ridethepig | Buyers in Difficulty📌 A timely update to the S&P weekly chart, where we can see clearly sellers are provoking the breakdown into some sort of waterfall.
All Global Equity charts look very similar with the traditional struggle between the defending fast money crowd and the more MT and LT sharks who are aware that the momentum is stalling and are itching to load at cheaper levels.
What is becoming clearer by the day is that Fed has blown a bubble which is exposed to a second round of lockdowns and a contested election will prevent any from hanging on. Here sharp speculators will have to bite the bullet and hold shorts while looking to reload full positions at the highs. Tracking closely 3,000 and 2,900 as the next areas of interest.
Thanks as usual for keeping the feedback coming 👍 or 👎

RUT - Small & Midcaps since 2008 - Upside down C&HThe next 10 years are looking bleak. The fundamentals of small/midcaps has been on a long decline. Is it really that difficult to imagine a future where a handful of corporations manage all of the goods and services? Throughout the index, companies showing increasing debt, declining revenues, declining cash flows. Thoughts?

IWM - a TOP of massive H&S!
a massive H&S for IWM/Russell is forming
next days SHORT to 148/141 levels
LONG from there to a second shoulder till mid December
final DROP to March lows in December

RUT - a diamond on Mt Everest TOP!
a DIAMOND reversal patterns on H&S top 1647
a DROP expect today or tomorrow
see more in my previous analysis

RUT US2000USD - Mt Everest top 1647!
Mt Everest reached! Officially 1647
This should be a TOP of a massive H&S 1608 - 1647 - 1608 pattern
Short to 1550/1520/1490/1430 levels UP and ZIG ZAG from there to 1608+
Nov 6th - the presidential election - should reach the second shoulder levels
the BIG DROP should be around 8th/9th December in this scenario

Bullish Russell (RUT)MACD indicator breaking out before price.
The PMO also trending up successively.
Interesting Small Caps Strength... IWM
Market history of cycles suggests small caps perform best in the early innings of a new bull market.

RTY Update 10/9Well, I was all cash and overslept, lol. I'm on the west coast, not waking up at 6am when I'm all cash.
I warned everyone last night about "stimulus" news, everything overbought but still rallying. If they agree to a deal over the weekend, we get a huge gap up on Monday, despite all indicators. All other world indices were slightly red, which I expected and I wasn't going to bet against my indicators, so I stayed out.
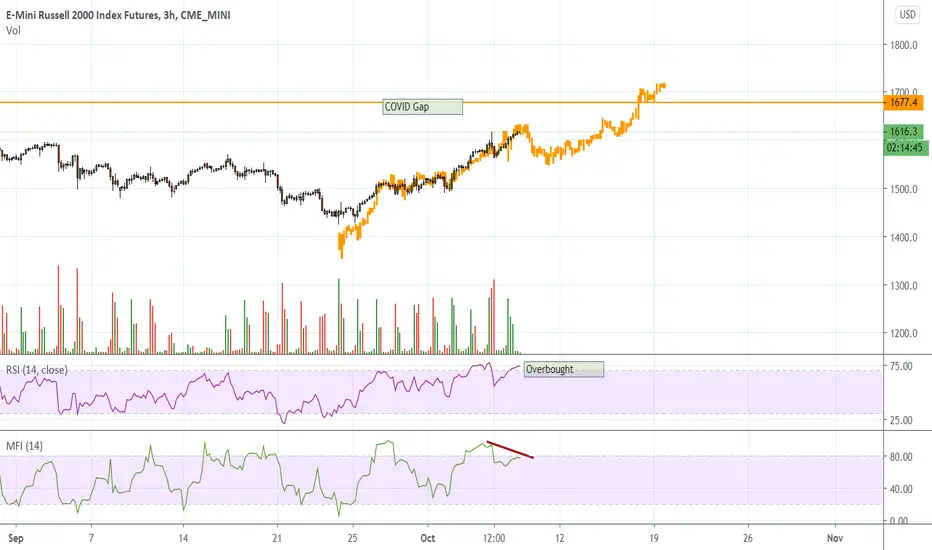
RTY MFI did drop, and it will pop again when MFI gets oversold, so look for another pop next week on stimulus to close the COVID gap. YM (Dow) dropped when it closed the gap, expect the same here.
Wish I had bout FTNT or DLTR calls, both were on my radar. Oh well.
Also, don;t short on Friday afternoons, market always seems to rally. I think all cash and fade the gap when stimulus news is announced.

Russell: The formation of a descending pattern 3W is possible.The formation of a descending 3W pattern is possible if the resistance level of 1575 is not broken upwards.

RTY OverboughtSmall Cap Madness, lol.
I think it needs a pullback, but maybe they just take it straight to the COVID gap. Note, every other index has closed the original Feb COVID gap,
October 7 PlanAlongside news that President Trump halted relief talks with Democrats until after the election, markets fell apart, retesting the prior week balance and the VWAP anchored from the September highs. Since the cash close, markets have recovered substantially off their overnight lows alongside comments Trump could send $1,200 checks to Americans. The action has been constructive and we're now sitting right on top of a major high-volume concentration that denotes recent value and should allow responsive sellers favorable entry if there has been an actual change in conviction.
Auctioning through the high-volume area and recovering the SOC (Scene Of The Crime) would increase the odds we test the 61.8% retracement (i.e., $3,440).
Overall, remaining above the $3,370 high-volume area is bullish. Below $3,370 is bearish. This will likely be a go, no-go level in today's trade.
Note: Prior to the sell-off, the market was showing signs of a balance-area break-out, piercing through the "Ledge". The fact that it was building value north of the ledge gave initiative longs confidence to discover higher.
Given that the news event brought us back into range, there's potential that the responsive participants auction price lower to the other end of balance, near the $3,320 area (i.e., a boundary of the low-volume area which denotes upside directional conviction). Defense of the low-volume area is paramount. Should price probe into and auction through the area, then a likely target would be the recent $3,198 swing low.

RUT 1620 TOP heading down to 1490 in H&S pattern next few days
1620 is local top on RUT
H&S pattern to 1490 levels
after that ZIG ZAG uptrend to 1620 levels
final crash after Nov 6th from 1620
SPX, NQ in similar pattern

RUT up to 1550, 1570 next days AND than another bottom 1480
next days UP to 1550 and 1570
Oct 7th local BOTTOM 1480
long term UP /ZIG ZAG sideways/ to 1600 election day 6th November
SPX, NQ tracking a same pattern

RUT calling bottom! Tomorrow GAP UP to 1500 and sideways to 1600
Today is a bottom on RUT/US2000USD on 1450.
We can see H&S reversal. LONG/SIDEWAYS till an election day November 6th.
It is going GAP UP to 1500 tomorrow overnight.
Than sideways up to 1600 level on the election day. Falling to lower levels afterwards.
Today is starting a second FED EAGLE wing. A very unique pattern! :)

September 27 Market Update | Technical, Fundamental, NewsDescription:
An analysis for the week ahead.
Points of Interest:
$3,200 High Volume Area; Friday’s Divergence From Value; Balance Area.
Technical:
Broad-market equity indices ended lower with the S&P 500 correcting as low as $3,200.
Recapping last week’s action, Monday's test of the $3,200 high-volume area offered responsive buyers an opportunity to get in at favorable prices. Buying continued through Tuesday, before resisting an area of resting liquidity at $3,300.
After disappointments in business activity data and stimulus talks, on heavy-volume and supportive delta, Wednesday's liquidation erased the entire week’s gains. Alongside improvements in home sale data, mega-caps and technology led the market higher, through Friday's close, away from value.
Overall, in the bigger picture, the market is churning above $3,200, the site of a large high-volume area which denotes the market’s recent perception of value. When prices trade to a high-volume area, on a swing up auction, then trade should slow allowing responsive longs a good place to enter. Should prices trade and spend time below this area, then perceptions have changed and longs are no longer favorable, at least in the near term.
Scroll to bottom of document for non-profile charts.
Fundamental:
John Authers, a Bloomberg columnist, suggested gold is falling due to rise in real yields.
“When real yields rise then gold, which pays no income, can be expected to fall. This is true even if real yields are rising from deeply negative territory. To explain the intuition behind this, gold is widely regarded as a hedge against central banking irresponsibility. Recent speculation is that the Fed may not print money and cut rates with quite the gay abandon that had been assumed. This may or may not be good news for the U.S. economy, but it raises real yields and for investors in gold and in risk assets, who might benefit from currency debasement, it is definitely bad news.” bloom.bg
Simply put, the theory that the Federal Reserve exhausted itself has buoyed real yields, which have an inverse relationship to metals.
Key Events:
Monday: Fed Mester Speech.
Tuesday: Goods Trade Balance, Fed Williams Speech, Fed Harker Speech, CB Consumer Confidence, Fed Williams Speech, Presidential Debate.
Wednesday: MBA Mortgage Applications, ADP Employment Change, GDP Growth Rate, Core PCE Prices QoQ Final, Corporate Profits, GDP Price Index, PCE Prices QoQ Final, Pending Home Sales, EIA Cushing Crude Oil Stocks Change, EIA Distillate Stocks Change, Fed Kashkari Speech, Fed Kaplan Speech.
Thursday: Core PCE Price Index YoY, PCE Price Index YoY, Continuing Jobless Claims, Core PCE Price Index MoM, Initial Jobless Claims, Jobless Claims 4-Week Average, PCE Price Index MoM, Personal Income MoM, Personal Spending MoM, Markit Manufacturing PMI Final, ISM Manufacturing PMI, Construction Spending MoM, ISM Manufacturing Prices, Fed Williams Speech.
Friday: Non-Farm Payrolls, Unemployment Rate, Average Hourly Earnings MoM, Average Hourly Earnings YoY, Average Weekly Hours, Non-Farm Payrolls Private, Participation Rate, Fed Harker Speech, Michigan Consumer Sentiment Final, Factory Orders MoM, Michigan 5 Year Inflation Expectations Final, Michigan Inflation Expectations Final.
Recent News:
Fed publishes scenarios for the second round of 2020 stress tests, a credit positive. bit.ly
Sea level rise increases credit risk for U.S. coastal states and local governments. bit.ly
Airlines are calling for COVID-19 coronavirus tests before all international flights. reut.rs
Intel Corporation (NASDAQ: INTC) gets U.S. licenses to supply to Huawei. reut.rs
China air force video appears to show a simulated attack on U.S. base on Guam. reut.rs
How secular shifts will force the U.S. commercial real estate market to adapt. bit.ly
Government aid and stock gains pushed U.S. wealth to pre-pandemic levels. reut.rs
As U.S. business activity loses momentum, home price inflation accelerates. reut.rs
JPMorgan Chase & Co (NYSE: JPM) to pay nearly $1 billion in spoofing penalty. reut.rs
Higher inflation regime in medium term after decade of persistent undershooting. bit.ly
A jump in U.S. coal railroad volumes, 2021 forecasts are driving up sentiment. bit.ly
Global banks seek to contain damage over $2 trillion of suspicious transfers. reut.rs
Amazon Inc (NASDAQ: AMZN) pushes security with indoor drones, car alarms. reut.rs
Crude, product prices diverge as market looks to U.S. stimulus, COVID situation. bit.ly
IEA analysis of innovation in batteries and electricity storage, based on patent data. bit.ly
U.S. upgrades accounted for three-fourths of affected debt in the latest period. bit.ly
Hedge funds see opportunity in the New York, San Francisco apartment markets. reut.rs
Low interest rates create pension and investment challenges but lower debt costs. bit.ly
China is on course for record LNG imports as industries recover and expand. reut.rs
General Electric Co (NYSE: GE) plans to stop making coal-fired power plants. reut.rs
COVID ‘firepower’: Britain imposed six month curbs against a second virus wave. reut.rs
Microsoft Corporation’s (NASDAQ: MSFT) acquisition of ZeniMax credit positive. bit.ly
Bombardier Inc’s (OTC: BDRBF) agreement to sell transport unit credit negative. bit.ly
Coronavirus resets Latin American economies at lower base, driving asset risks. bit.ly
California banning sale of new gasoline-powered passenger vehicles in 2035. reut.rs
Data is suggesting that splits fundamentally change how stocks perform. bit.ly
The corporate bond issuance boom may steady credit quality, on balance. bit.ly
Per earnings and interest rate forecasts, valuations not supported fundamentally. bit.ly
Data expected to confirm sentiment eased across most European countries. bit.ly
Wary buyers and softer foreign demand, likely raised Japan’s unemployment rate. bit.ly
On balance, 2020’s bond issuance boom enhanced overall financial flexibility. bit.ly
Demographics and the rising cost of funding retirement may affect valuations. bloom.bg
Key Metrics:
Sentiment: 24.9% Bullish, 29.1% Neutral, 46.0% Bearish as of 9/23/2020. bit.ly
Gamma Exposure: (Trending Lower) 1,152,474,010 as of 9/25/2020. bit.ly
Dark Pool Index: (Trending Higher) 42.2% as of 9/25/2020. bit.ly
Product Snapshot:
S&P 500 (ES): TVC:SPX AMEX:SPY TVC:NDX NASDAQ:QQQ TVC:RUT AMEX:IWM
Gold (GC): AMEX:GLD AMEX:GDX TVC:GOLD
Crude Oil (CL): TVC:USOIL AMEX:USL AMEX:DBO AMEX:USO
Treasury Bonds (ZB): NASDAQ:TLT
Disclaimer:
This is a page where I look to share knowledge and keep track of trades. If questions, concerns, or suggestions, feel free to comment. I think everyone can improve, especially me.
In no way should this post be construed as investment advice.

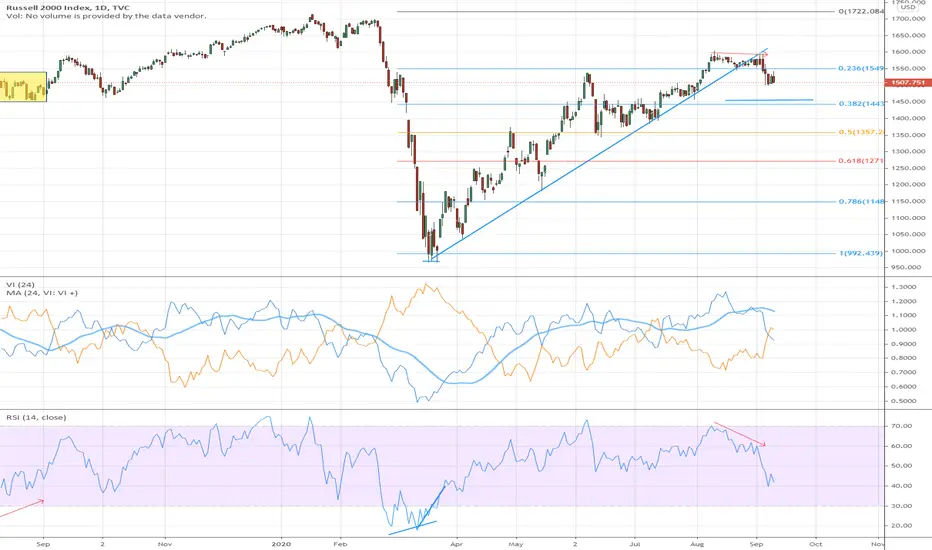
RUT Russell Small CapsSmall caps have not been as enthusiastic about the rally as tech and SPX in the run up since March. We see that it's been making lower lows and lower highs since August 11 peak, and RSI has been showing continuing weakness on the daily chart. If SPX is going to have a meaningful sustainable rally, it's going to need the small caps and financial sector to follow suit. This has not been the case.

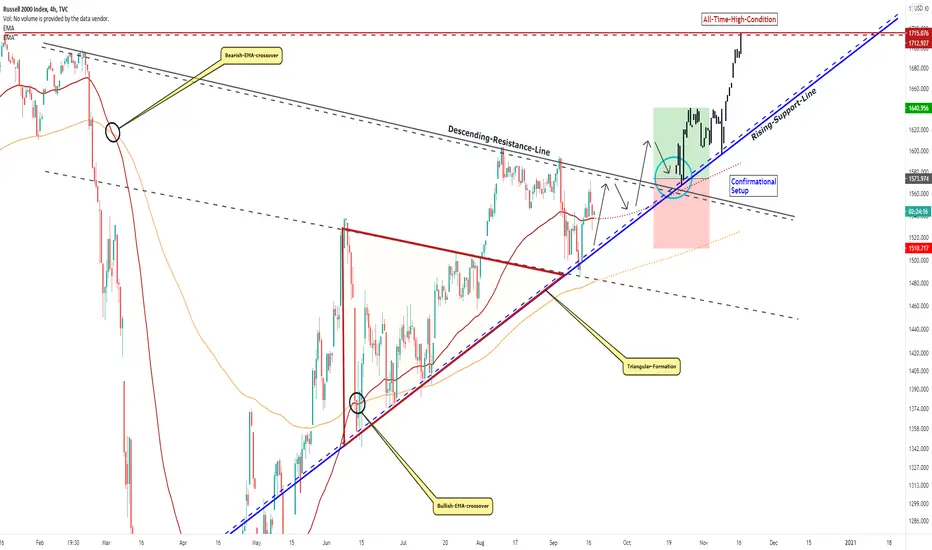
RUSSELL 2000, Above Preliminary Level, These Steps Can Follow!Hello Traders Investors And Community, Welcome to this analysis where we are looking at the RUSSELL 2000 index 4-hour timeframe perspective, the recent events, the current formational structure and what we can expect the next times. The main market and other indices like the SPX or DOW recovered steeply from the heavy corona-breakdowns and lows established this year where they already managed to form new all-time-highs, in this case, the RUSSELL 2000 is still below the major all-time-highs established before the corona-breakdowns, this does not mean it can change, however, therefore, it is important that the index shows up with the proper price-action and don't invalidates the possible bullish scenario substantially, therefore I detected all the important levels and possible outcomes we should consider for the index and its destinies.
Looking at my chart you can watch there the triangle-formation marked in orange which already broke out to the upside where it also bounced already from the upper boundary and the blue rising-support-line marked in my chart, what is also a good sign is that the index formed a bullish-EMA-crossover already before the triangle-breakout occurred, currently, as you can watch marked in my chart the index has still resistance at the descending-resistance-line marked in grey above the level, when the index manages to move above it this will cause a decent entry setup as the index has taken out its major resistance, as you can watch in my chart, this mechanism can be entered immediately aggressive in the current price-action or conservative when the breakout occurred, although the aggressive approach is also possible the conservative should be preferred.
In this manner, thank you for watching, support for more market insight, good day to you, and all the best!
“Trading effectively is about assessing possibilities, not certainties.”
Information provided is only educational and should not be used to take action in the markets.
Vix Testing 26 while SPX Rejects the UTL as per B-WedgeThis is a tricky one but at a critical spot. The VIX classically needs to be below 26 to sustain a bull market. It's that simple. Now, this doesn't mean that the advance/decline ratio will negate any complacency with over 200b in options contracts traded each day. The guess for me is down from here. This would allow rates to normalize, which until the spx when formulated for inflation and real growth won't happen.

ridethepig | Small Caps Breaking DownA timely update to the Russell 2000 after running into sellers at the 1600 resistance which was previously support. Small caps have seen a huge uptick in selling interest and momentum is starting to kick in.
Buyers giving up the diagonal support is opening up a world of trouble and asking for sellers to apply more pressure. The V shapers and naysayers that its not different this time will continue with the necessary text, the question is whether real money decides to step in and stop the bleeding. After losing support the next key level in play is 1350, and a deeper extension towards 1,175.
Thanks as usual for keeping the feedback coming 👍or 👎

$RUT Small CapsQuick look at the small caps - RUT hasn't been as enthusiastic as the SPX and the Nasdaq. We see that, while it's had its own run since the March bounce, this upward trend line has been broken below in the past few sessions. Next major support is 1450 area. As i've mentioned in my previous post, look to small caps and financials to act as a drag to any bull rallies in the SPX and tech. For the time being, technical indicators doesn't seem to support a bounce or a rally in small caps.