$SPY no longer underperforming $RSP or $RUTLooks like the idea of BTD (Buy the Dip) is still in place.
IMO not enough EUPHORIA for "crash" (like many are calling).
AMEX:RSP (equal weight SP:SPX ) was outperforming AMEX:SPY but that is no longer the case as of yesterday.
TVC:RUT AMEX:IWM also lagging but the chances are that it will likely catch up in time.
#stocks
RUSSELL 2000

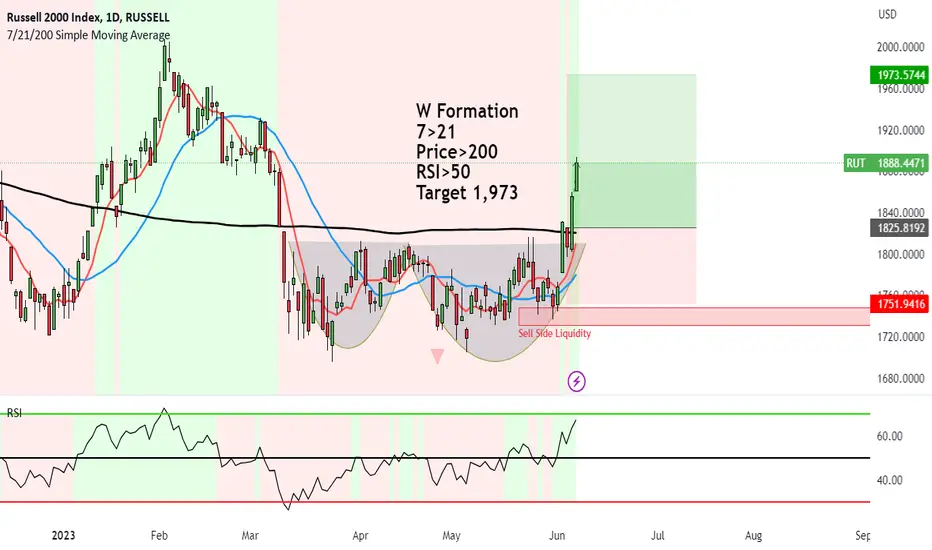
Russell 2000 showing strong upside after W breakout to 1,973W Formation formed on Russell 2000.
I missed the boat on this one. There are just so many markets so little time to focus on.
It had the perfect buy setup with all the criteria.
Anyways, those that got in, there is more upside to come.
7>21
Price>200
RSI>50
Target 1,973
ABOUT THE RUSSELL 2000
The Russell 2000 is a stock market index that measures the performance of approximately 2,000 small-cap stocks in the United States.
It was created by the Frank Russell Company in 1984 and is maintained by FTSE Russell, a subsidiary of the London Stock Exchange Group.
The Russell 2000 is widely considered a benchmark for small-cap stocks and is used by investors to gauge the overall health and performance of the broader small-cap segment of the U.S. stock market.
The Russell 2000 has a diverse range of constituents, covering various sectors such as technology, healthcare, finance, consumer goods, and industrials.
The Russell 2000 is often used as a benchmark for mutual funds and exchange-traded funds (ETFs) that focus on small-cap stocks.
CRITERIA TO GET INTO RUSSELL 2000
To be eligible for inclusion in the Russell 2000 index, stocks need to meet certain criteria set by FTSE Russell.
Market Capitalization:
The primary requirement is that a company must have a market capitalization within the defined range for small-cap stocks.
I'm not sure what this is set to at the moment. But I imagine it's smaller than the large cap stocks :P Somewhere around within the range of a few hundred million dollars to a couple of billion dollars. This is out of my knowledge point as I'm a South African :)
FTSE Russell determines the specific range annually during the reconstitution process.
U.S. Listing:
Stocks considered for inclusion in the Russell 2000 must be listed on a U.S. exchange, such as the New York Stock Exchange (NYSE) or NASDAQ.
Share Price:
Stocks need to meet a minimum share price requirement to be eligible for the Russell 2000.
The specific threshold is determined by FTSE Russell.
Also not sure but I believe it's typically in the range of a few dollars to tens of dollars (can we say that?).
If you know more information please let me know as I'm a South African and not really sure about criteria with US stock exchanges and markets. Sorry. Regardless, it looks like it's going to continue up!
$RUT $IWM & $RSP looking better = Breadth picking upTVC:RUT went above the SUPPORT line again before it closed
AMEX:IWM (Russell 2k) looking BETTER and better
AMEX:RSP (equal weight #SPX) also looking GOOD, look @ BUY VOLUME! It's performing better than SP:SPX
While we were wrong for couple days, we were RIGHT in the analysis that breadth was going to get better
#stocks

$RUT broke resistance & struggling to stay above, Yield top?TVC:RUT broke resistance & is trading back under again
The only consistent up mover is the NASDAQ:NDX
6Month is at its HIGHEST levels this year
1Yr Struggling here but hit highs
2 & 10Yr nowhere near highs TVC:TNX
All #yields look as if they're going to roll over soon
Historically, #stocks follow this downside on yields
Is this time different?

$IWM, #RUTAMEX:IWM , the Russell 2000, experienced a significant move on Friday, June 2nd, accompanied by high trading volume. On the daily chart, it successfully broke out of its structure, indicating the next potential levels at $185-190. If it manages to surpass this range, it could potentially reach $200 and even $220. It is worth noting that there are several bullish setups observed in mid-cap stocks.

RTY UpdateES and NQ are oversold but small caps arn;t yet, and it looks like we won;t see a bounce until it does.
Not chasing the drop at this point, so just waiting for tomorrow, lol

RTY UpdateWell, small caps look bullish....
Retail numbers are supposed to be good, numbers come out before market open tomorrow. Probably should have gone long on XRT on the dip.
I assume BUD will gap up with retail tomorrow, gonna short it when it does.


Watch Russell/IWM, banks are in thereKeep an eye on RUT Russell 2000 index for signs of bank troubles and smaller businesses. Smaller businesses will be more sensitive to economic changes.

RTY UpdateStill the weakest index, RSI is already oversold.
RTY indicators are the least reliable, not going long yet.

Head and Shoulders Topping Formation on the Russell2000The recent failure of First Republic Bank highlights the problems facing the US banking system. These problems include the continued increase of delinquency rates on Credit cards, Commercial Real Estate & Automobiles, as well as a decrease of commercial bank deposits and M2 money supply (-4.2% YoY). These problems, among others, are causing banking institutions to rein in their lending to build reserves and take on debt from the FED & FHLBs to meet deposit withdrawals. This reduces the profitability of banks and restricts credit into the economy, which reduces economic activity as a whole. The economy had already begun slowing heavily before the credit crunch began in March 2023, but the current business cycle downturn, combined with 3 large regional bank failures and rising continuing jobless claims, portend a severe & lengthy economic contraction. The Conference Board Leading Economic Indicators registered a -7.2% YoY Contraction recently. Since 1968, Any Conference Board LEI contraction of more than -2% YoY has never yielded a false positive in regards to a coming recession.
Over 40% of Russell2000 companies are unprofitable and over 24% of S&P500 companies are zombie companies. Markets are still very overvalued within the context of a 5% Fed funds rate, contracting earnings, a credit crunch, and ongoing quantitative tightening by the FED. The markets have been seeing less buying volumes as well as carving out a head and shoulders top on the Russell2000. Other problems facing the banks include the popping auto & commercial real estate debt bubbles, as well as increasing large corporate bankruptcies (The most since 2010 thus far this year). The IPO market is the weakest it has been since 2009 (by total proceeds), which is also hurting Investment banking profits. I see the potential for 5%-10% possible upside and 35%-50% downside for the Russell2000 & S&P500 over the next 9 -18 months.
Thank you for reading,
Alexander C. Lambert

RTY UpdateMFI dropping fast, but RTY barely even dipped. There's a weird short squeeze on garbage stocks today. AFRM, PTON, BYND, TSLA (lol) all green by a lot.
No trades, but I'm hoping for the market to tank so we finally get some tradable action.
Note: Some of the garbage stocks appear to have rolled over, might be a play there.

RTY MFI OverboughtYeah, I said overBOUGHT. That means don't BTFD.
Wanted to post this early since I said BTFD earlier this week. I have NO intentions of going long today. Will post ES and NQ updates later since they are not overbought yet.
Also, I was right about playing GM puts for TSLA earnings, looks to be 175% return on open. I didn't play it, lol. Gonna kick myself on this one, I mentioned it twice before close yesterday.

RTY UpdateJust drifting sideways, indicators are neutral. I think MFI goes oversold tomorrow morning on RTY and ES, will wait until then to BTFD, lol.
I think it's gonna be a whipsaw day. Futures need to sell off but lots of dip buyers already. Slept in (kinda obvious now, lol) because I was all cash, no positions. Will take a potshot at the market again tomorrow if indicators go oversold.
No idea which way the market gaps tomorrow, I'm not bullish on TSLA earnings. FDAX MFI is dropping but the index isn't. Maybe another small gap down again? i dunno.
Really thinking it might be a good time to take a break from the market... but PCAR earnings next Tuesday. Maybe after that.

RTY UpdateCPI pump and dump as predicted, RTY went overbought on RSI with MFI divergence.
Fed meeting minutes at 2pm, unemployment and PPI numbers premarket tomorrow and retail numbers premarket Friday. Garbage stocks didn't even last 15 minutes, lol. PTON shot down so fast I couldn't even catch up to it. Managed to snag a few BYND puts, we'll see where taht goes.
Might snag some CAT puts EOD for unemployment number tomorrow.

RTY MFI OverboughtRTY MFI is overbought as is YM, but all other indices including ES, NQ, FDAX, and GC1! (gold) are all neutral. Not getting the pre-CPI pump I expected so far.
Might just sit this week out, not feeling all that well. Don't need the heartburn, lol.

IWM/RUT down to 130+ zoneRUT is in 1-2 structure and is ready for a move down in wave 3 of C. It might still try to push up until mid April though I don't expect to see a major move. Whole structure should bottom by mid August in 130+ area.

IWM Russell 2000 RUT affected by the SIVB collapse! Puts to buy!After the last RUT Russell 2000 Price Target was Perfectly reached:
Now you need to know that many of the Russell 2K companies will be impacted by the SIVB collapse.
Roughly 50% of the US venture capital-funded startups are clients of SVB , potentially putting 65,000 startups at risk of payroll disruptions. Such a situation could have significant consequences for the startup and tech sectors.
Silicon Valley Bank did business with FTX, plus many other formerly overvalued tech companies.
With $210 billion in assets, $SIBV was the 15th largest bank in the US in terms of deposits.
IWM puts considering buying:
2023-4-21 expiration date
$169 Strike Price
$3.65 Premium
Looking forward to read your opinion about it!

RTY UpdateThe algos are pumping money into RTY trying to hold that blue line. You can see MFI climbing.
Problem is MFI will go overbought Monday so we'll see a drop Tuesday, if not Monday afternoon. Plus Euro markets tanked so we might even see a gap down Monday. Seems to me garbage stocks are done tanking so there's really no choice but to go long here.
Crappy whipsaw market to trade.
RTY UpdateNo idea what the other indices are doing, looks like a melt up on ES and NQ because MFI is dropping while RSI is rising.
RTY is oversold, and PTON is up so it means short squeeze time, lol. Small long position, don't need the heartburn.

$VIX hits top part of Symmetrical triangle$VIX rarely tends to trade in a small & tight range.
#VIX Sold off big last couple months & traded in a decent range for a bit & recently, including today, popped big.
As you can see it hit the top part of the Triangle Formation.
Hard to call here but stocks gaining some momentum, being that many were OVERSOLD, including $DJI & $NDX, $SPX and so on, is not out of the question.
Risk reward @ day lows in #stocks was good. A lot of fear out there is good for reversals.
Keep eye out on 4 hour charts for a good idea of where we stand.
FYI $DJI 4hour close was NOT the best setup BUT it did form a BULLISH Engulfing with GOOD VOLUME.
IMO 32.5k on #DJI is good & if it breaks & holds that is a good sign.

$VIX, 1, 2 forming LOWER HIGHS, $TNX stalling🚨#Yields are still forming lower highs🚨
$TNX bucks trend but it lags (inverted curve)
$VIX LOWER LOW
This can be very good short term for #stocks & #crypto

📉 Stoch Markets: Is the worst really over? 🚀⁉️📝 I will try to analyze the market as a whole, with reference to the Russell 3000 index , which is broader than the S&P 500 .
(Russell 3000 is a capitalization-weighted stock market index that seeks to be a benchmark of the entire U.S. stock market. It measures the performance of the 3,000 largest publicly held companies incorporated in America as measured by total market capitalization, and represents approximately 97% of the American public equity market).
📈 On the top chart we have the Russell 3000 .
📉 On the bottom chart, we have the Russell 2000 Growth divided by the Russell 2000 Value .
(The Russell 2000 Index is a small-cap stock market index that makes up the smallest 2,000 stocks in the Russell 3000 Index).
The intention here is to see how the companies classified in the 'Growth Investing' category are performing, using the 'Value Investing' companies as a parameter.
🤔 As a rule, it is to be expected that when traders and investors are more prone to risk, they invest more money in 'growth investing' companies than in 'value investing' companies.
1) Analyzing divergences
1.1) 2006-2008
In the period from 2006 to 2008 we had a divergence: the Russell 3000 had lower funds, while the Growth companies had higher funds. The apex was found precisely in the blue diagonal channel, on 12/30/2008. Note that Russell's bottom was only found on 03/10/2009, 3 months later. There is a clear anticipation in the contribution of 'Growth' companies.
1.2) 2014-2016
Russell tests the support of the green line several times, the last one being on 02/11/2016.
Meanwhile, Growth companies remain on the rise, however reaching the blue diagonal channel again on 02/02/2017, 1 year later.
In this case there was an outflow of 'Growth' companies, at least until reaching the blue diagonal channel. After that the increase continues.
1.3) 2018-2020
In this period we have a classic book divergence.
The Russell peaks downwards on 21/12/2018, and later on 23/03/2020, featuring lower bottoms.
Meanwhile, 'Growth' companies continue to 'respect' the green close with ever higher funds, reaching a low peak on the same date.
1.4) 2022-?
Considering the bad macro-economic scenario, with the high cost of money and inflation, it would be surprising that the 'Growth' companies had a better performance than the 'Value' ones. Despite this pessimistic bias, if this indicator breaks above this green diagonal line and stays there, I will reconsider this opinion. If not, I think it is more likely that it will hit the blue diagonal channel again to form the final divergence.
🟢 For comparison purposes, considering a more global aspect and not just the small companies of the Russell 2000, the same analysis could be done on the ratio between the RAG and RAV indices (Russel 3000 Growth/Russel 3000 Value):
2006-2008
2014-2016
2018-2020
2022-?
🔵 What's important to note is that these key moments happened in December and March.
