RTY UpdateThis one is a bit more obvious, oversold.
Watch out EOD because there will be shorts covering. Lot sof garbage stocks tanked this week including cryptos.
RUSSELL 2000

Russell 2000 potential for rise towards overlap resistanceLooking at the D1 chart, my overall bias for RUT is bullish due to the current price being above the Ichimoku cloud, indicating a bullish market.
Looking for a pullback buy entry at 1889.4148, where the 38.2% Fibonacci line and overlap support is. Stop loss will be at 1722.0208, where the recent swing low is. Take profit will be at 2134.1183, where the overlap resistance is.
Please be advised that the information presented on TradingView is provided to Vantage (‘Vantage Global Limited’, ‘we’) by a third-party provider (‘Everest Fortune Group’). Please be reminded that you are solely responsible for the trading decisions on your account. There is a very high degree of risk involved in trading. Any information and/or content is intended entirely for research, educational and informational purposes only and does not constitute investment or consultation advice or investment strategy. The information is not tailored to the investment needs of any specific person and therefore does not involve a consideration of any of the investment objectives, financial situation or needs of any viewer that may receive it. Kindly also note that past performance is not a reliable indicator of future results. Actual results may differ materially from those anticipated in forward-looking or past performance statements. We assume no liability as to the accuracy or completeness of any of the information and/or content provided herein and the Company cannot be held responsible for any omission, mistake nor for any loss or damage including without limitation to any loss of profit which may arise from reliance on any information supplied by Everest Fortune Group.

Bunch of copy paste quotes on Fed Meeting, $DJI $NDX GREAT DAY!Apologize for the LATE post on this
We posted this elsewhere, documented, and bringing it here
----
Yesterday
So, #fed tomorrow.......
We get 25, likely rally and fade next day or few days later
We get 50, likely sell off decently & then rally
This could reverse in one day or take week or more
#FederalReserve meeting
#stocks #crypto #inflation
Done for today :) Good day overall
----
Early Today, after announcement-
Was at least expecting a pop first before the fall
Interesting day today
Maybe we get the fall and then the rally...
However how we end the day, the next day tends to be a reverse of some sort
$DJI $NDX $SPX
----
After-
For a second we though we were going to get put (sold a bunch of put options when $DJI was off 340 points and $NDX was closer to day lows) a ton of #stock ROFL
Limits being filled, not being greedy
#crypto green
US #Dollar $DXY hitting lows (did say HISTORICALLY doesn't hold)
-
We've been cautious #BULL for a bit & we need 2b weary of EUPHORIA
We're watching for that, IMPORTANT!
$VIX @ bottom trend (we'll know VERY SOON what's up)
#yield falling $TNX, 2yr not as much, hmmm
#stocks huge turnaround
#crypto as well
What about volume? Soon
----
$NDX & $DJI BUY volume is still there but it's lowering
#DJI looking GOOD atm
$NDX NO slouch testing downtrend soon
#markets ARE IRRATIONAL
Look at volume, patterns & trend!!!
----
Recent
Awesome #stock day today! Good for the week!
Raised cash again for trading
Have some longs still
$DOW $META (taking some off here), $KHC $INTC $ATVI & some others BUT aggressive TRADING still 1/3 in bonds, expire soon, & cash for tomorrow & other days
Done for day &👀direction
---
Look at $RUT $IWM
RISK is ON ON ON
Has been on
Volume is ok
#stocks have been looking ok
$DJI breaking symmetrical = continuation pattern
Staying cautious BULL!
More haters of rally = GOOD!
Keep eye on EUPHORIA!

YOU need to see this now - THE DANGER LINEThis is a wave trend indicator on the S&P 500 index that is based on relative strength with straightforward oversold or overbought conditions. Relative strength is a measure of momentum where both speed (time) and magnitude (change) is measured and plotted with simple or weighted moving averages.
What you are seeing above is a snapshot of a RSI/wave trend of the S&P 500 index based on monthly candles. Understand that it takes the measure of a month of time just to get a single plot of data and this particular snapshot represents over two decades. But right before your eyes are very clear trends. The data is just pure and simple math and math does not lie. Ignore the news. Follow price, volume, momentum.. just follow the data.
I will try not to state my opinion too much.. and just follow the data. What I see on the chart is concerning. If this decline continues over the next month or two, momentum is going to accelerate and volatility go up while the market basically crashes... i.e. if the DANGER LINE is breached. I found it odd that volatility (VIX) has been quite docile considering the amount of downside we've seen in the indices this year. That is concerning. It is entirely possible that the September thru November monthly candles are positive and this trend finds support.. and the danger line is not breached. On the flipside, this decent can continue and really pick up speed and we see a 2000-2003 correction or 2007-2009.
Here is an overlay snapshot with those corrections to similar scale. That is what could happen if the current trend continues.. we could see 12-24 months of recession and very steep drops and sharp bearish reversals. Be careful, manage risk, consider hedging certain positions, and know that you DO NOT know what is going to happen.

Stuck in a RUTWell not really
It did a perfect Gann retracement
Half the move from corona lows to ath in half the time
It’s broken the downtrend
We have another bullish weekly
It’s double bottomed
Sorry bears u had your chance
Target is ath mid 2023
NOT TARDING ADVICE
GRI 2022

Russell 2000 Potential for Bullish ContinuationLooking at the H4 chart, my overall bias for RUT is bullish due to the current price being above the Ichimoku cloud, indicating a bullish market.
Look for a potential buy entry at 1789.4537, where the overlap support and 61.8% Fibonacci line is. Stop loss will be at 1722.0208, where the previous swing low is. Take profit will be at 1911.6949, where the overlap resistance is.
Please be advised that the information presented on TradingView is provided to Vantage (‘Vantage Global Limited’, ‘we’) by a third-party provider (‘Everest Fortune Group’). Please be reminded that you are solely responsible for the trading decisions on your account. There is a very high degree of risk involved in trading. Any information and/or content is intended entirely for research, educational and informational purposes only and does not constitute investment or consultation advice or investment strategy. The information is not tailored to the investment needs of any specific person and therefore does not involve a consideration of any of the investment objectives, financial situation or needs of any viewer that may receive it. Kindly also note that past performance is not a reliable indicator of future results. Actual results may differ materially from those anticipated in forward-looking or past performance statements. We assume no liability as to the accuracy or completeness of any of the information and/or content provided herein and the Company cannot be held responsible for any omission, mistake nor for any loss or damage including without limitation to any loss of profit which may arise from reliance on any information supplied by Everest Fortune Group.

RUT @ the gate of "Havens", if rejected only "Hell" is the ALT !Golden Cross vs. Death Cross: An Overview
Technical analysis involves the use of statistical analysis to make trading decisions. Technical analysts use a ton of data, often in the form of charts, to analyze stocks and markets. At times, the trend lines on these charts curve and cross in ways that form shapes, often given funny names like "cup with handle," "head and shoulders," and "double top." Technical traders learn to recognize these common patterns and what they might portend for the future performance of a stock or market.
A golden cross and a death cross are exact opposites. A golden cross indicates a long-term bull market going forward, while a death cross signals a long-term bear market. Both refer to the solid confirmation of a long-term trend by the occurrence of a short-term moving average crossing over a major long-term moving average.
KEY TAKEAWAYS
A golden cross suggests a long-term bull market going forward, while a death cross suggests a long-term bear market.
Either crossover is considered more significant when accompanied by high trading volume.
Once the crossover occurs, the long-term moving average is considered a major support level (in the case of the golden cross) or resistance level (in the instance of the death cross) for the market from that point forward.
Either cross may occur as a signal of a trend change, but they more frequently occur as a strong confirmation of a change in trend that has already taken place.

How NOT to loose money, 1st do not trade people's ideas do your Home work, do your research and learn learn learn till you become aware of what is
going on in mkts and then being able to choose the right path for your and being able
to distinguish right ideas and analysis from the wrong ones.
*****Passing this cool info (Not mine) :
2. Set realistic expectations
When you're investing, your expectations of what you could earn should be realistic. And sometimes, measures like average rates of return can be misleading.
For example, if you invested in large-cap stocks between 1926 and 2020, you would've earned an average rate of return of 10.2%. And if you earned this rate of return over 30 years, $100,000 invested would've grown to $1.84 million.
But during that same time period, you would've earned a high of 54% in 1933 and a low return of -43% during 1931. If you invested for the first time during a year of losses, it could make you wary of investing.
Understanding that your returns won't be linear but instead, an average of positive, negative, and flat returns is important. And understanding this may help you withstand the bad years.
3. Know the difference between a realized and unrealized loss
When you look at your account balance and see that it's lower than it was the month before, it may feel as if you've lost money. But the numbers you see on your statement or when you log in to your account are called unrealized losses or gains. These numbers change for better or worse throughout a day of stock market activity and are only considered actual losses or gains when you realize them by selling your holdings.
For example, if your account balance was $10,000 last month and you experienced losses this month, it may now be worth $9,000. But you would only lose money in reality if you sell this investment before it gets back to its original value. Over the long term, the stock market has always increased in value, and your investments should, too, as long as you stay invested.
4. Have an appropriate time horizon
How soon you need your money could impact how well you keep your money invested during stock market crashes. If you won't need your money for 25 years and you suffer a 30% loss, you may shrug it off knowing that your account value could return back to that value in a few years. But if you plan on using the money next year, you may panic at the idea of losing any of it.
Before you invest one penny, think about your time horizon. And the closer it is, the more conservatively you should invest. Without the threat of missing your goal looming over your head, losses may not seem so devastating, and you'll be less likely to give up on investing due to a short-term drop.
5. Control emotions
Controlling your emotions is no easy task, and when you're losing money, it can feel like it will go on forever. But declines have never lasted forever. Learning how you can control your emotions when you're feeling this way can be the difference between experiencing subpar returns that lag benchmarks or keeping pace with them.
When you feel as if the sky is falling and it seems as if there's no end in sight, revisiting stock market corrections of the past can be helpful. Even during some of the periods of the most extreme losses, investors who stayed the course often recouped their losses within a few years. From 2000 through 2002, if you'd invested only in large-cap stocks, you would've lost about 38% in total. If you had $100,000, it would've decreased to around $62,000. But by 2006, you would've regained all of your money and been ahead slightly..
6. Invest in line with your risk appetite
How do you feel about volatility? Do you barely notice it and realize that it's a normal part of a market cycle? Or does it make your stomach drop every time it happens?
You can earn more over the long term if you have more aggressive investments, but in a year of losses, these types of investments could also lose more money. And if the losses seem too big, these investments may be too risky for you.
If this happens, staying invested may be harder. Making sure that you're invested in line with your risk tolerance can help you prevent this. You should also find an asset allocation model that suits your appetite for risk, even if it yields a lower average rate of return.
Investing should help you meet your goals instead of putting you further away from them. While your account value increasing or decreasing regularly is normal, you don't have to lose money. And controlling your fears, making sure you hold suitable investments, having realistic expectations about how your accounts will grow and the time frame in which those gains will happen can help you avoid it.

RUT Russell 2000 Santa Rally U.S. stocks tend to rise during the Santa Claus rally period.
The Santa Rally is considered the last five trading sessions of the year and first two of the new year.
Since 1950, the S&P 500 has traded higher 78% of the time during the Santa rally period for an average gain of 1.3%.
My price target for RUT Russell 2000 is $1860.
Looking forward to read your opinion about it.

Feels like the market is coiled up like a spring Bulls take a position, get trapped; bears jump in and get trapped as well. A coil.
Stops are placed. As they should.
If the coil breaks out, half the crowd will quickly be wrong and bail.
The market will eventually pick a way, discover price. Up down, cant do sideways forever.
Crypto is rising, cpi is slowing. gasoline is cheaper.
Cnn sentiment index is at 'greed".
Percentage of stocks above moving averages is elevated. Vix is in downtrend and low end of range.
Valuation is still above historical 15 PE and shiller PE is near 29.
Many stocks are at 20 plus PEs, especially large caps, despite analyst show slower growth.
old trader sayings:
"from failed moves come fast moves"
"stocks move in the direction that hurts the most people"
"stocks always go up"
"buy high and sell higher"
Sound financial guidance recommends you only invest money you wont need for 5 years or more.
Good luck and dont risk money you can't afford to lose.
QQQ RTY IWM

Yearly open price actionStocks closed pretty strong for the year, and the yearly open filled a gap very quickly. At the moment, I see very little evidence that the year will start with a massive dump, especially after 2022 was so brutal for stocks, bonds, and crypto. It looks more likely that things will first go up and then potentially go down. The market resuming its bounce makes more sense before it goes down again.
In my opinion, Q1 has the potential to be a bullish quarter, with SPX getting even up to 4400. It might be a massive bull trap, but it's possible. I think the Q1-Q3 period has the potential to be very choppy and much choppier than people imagine. Instead of having a clear trend, we might see a ton of chop that frustrates both bulls and bears, and then eventually a resumption either to the upside or downside, depending on what global liquidity is like and how markets force Central banks to act.
Even though I see a recession coming, I've been talking about how it wouldn't come in 2022 and that all we saw in 2022 was a slowdown and inflation, giving its place to disinflation. I doubt the recession will start in Q1 2023 and that markets might not crash until Q4 2023. At the same time, it's clear that the USD is in a challenging position and that the Fed is cornered while other central banks are increasing liquidity while raising rates. Maybe the market finally accepts that interest rates won't be higher than inflation over the next few years, and they price that in. Finally, we need to remember that the Fed started hiking in March 2022 and that the impact of their hikes could take anywhere from 12 to 24 months until they genuinely impact the economy.
So let's focus on what the current price action is telling us on SPX, NDX, and RUT. On my main chart, I have S&P 500 and the potential scenarios I see. I see the Monthly Pivot and the critical breakdown zone being tested. We currently have a double top at 3880 which will most likely be broken. A lot will then depend on whether the market will close above the Monthly Pivot. If it does, it may go significantly higher toward 4350-4400. Until I see a close below 3750, I don't think it makes sense to be very bearish, as the market is trading in a range, so it could first take out the highs, then the lows, and then move higher. It's, therefore, better to take it step by step.
For NDX below, we can see that the market has found decent support and could bounce. In my opinion, we will see new lows on Nasdaq much faster than all other indices, and I am pretty sure we will get new lows in 2023, even if we don't see other indices make new lows. For RUT, we are in a mini range, which is part of a more extensive range. And I think we first take the highs and then the lows. In my opinion, the market will trade both at 1630 and 1910, so it's all a matter of how we get to each point. Either way, both look very attractive for going long or short.

Equity market outlook - January 2023Purpose
This analysis is meant to provide a long-term outlook for equity markets.
I also use this to support my data-driven, long-term investment decisions. Sharing this with the public helps me avoid one of the most common mistakes investors make in the market - missing the forest for the trees.
Table of contents
Central banks policy
Economic growth outlook
Earnings growth outlook
Liquidity in the financial system
Summary
Central banks policy
Central banks around the world are still tightening monetary policy which is a headwind for economic growth - see the section below.
Tight monetary policy means there will be potentially more pressure on 10Y real yields - if inflation will be persistent.
There has been a strong correlation between 10Y RE and S&P 500 Forward P/E since 2018. Tight monetary policy + persistent inflation = lower Forward P/E = higher pressure on S&P 500.
What has already been embedded into the price? Eurodollar futures term structure can help answer this question. The market expects rate cuts in September 2023. This would support a higher P/E, but it would also mean that something has been broken on the market. The shape of the curve suggests that the market expects rather hard landing than soft landing.
No one knows for sure what FED will do in the future, but if they follow the path outlined by the eurodollar futures market then we are near the bottom of forward P/E. In that context, the cheapest stocks are in the S&P 600 index = small cap index. Forward P/E is 12.5. Their lowest value was during the GFC - just below 10. The most expensive is S&P 500, with a forward P/E of 16.7.
Economic growth
Central banks' policy leads economic growth / contraction that can be measured by CLI Diffusion Index:
The index suggests we should not expect positive stock indices YoY growth yet. What's more important, it says a high volatility period might be around the corner.
However, the National Financial Condition Index has already been elevated, so lots of depression fears have already been discounted.
Earnings growth outlook
I use the Nominal Broad U.S. Dollar Index, BBB US Corporate Yield, WTI price, and ISM New Orders less ISM Customer Inventories to measure the impact of current conditions on future corporate earnings.
As a result, I get an indicator that tends to lead stock indices YoY changes, especially Russell 2000 - because it is the index that is the most sensitive to real economy changes.
We should not expect earnings to grow in that kind of environment.
Liquidity in the financial system
I use three indicators to measure liquidity. I normalized the readings to z-scores - just to look at them from the same perspective.
1. FED Balance sheet less Reverse Repo (Overnight Reverse Repurchase Agreements) less TGA (U.S. Treasury General Account): there is still plenty of money flowing in the financial markets despite ongoing QT
2. Top of the ES futures order book (the number of contracts in buy orders and sell orders): despite the end of the year period, the liquidity (on average) is just fine. No need to worry about air pockets right now.
3. Finra margin debt - the deleveraging is ongoing. $292B has been removed from investors' margin accounts so far, but there is still plenty of money borrowed from brokers - we're at levels last seen in 2018.
Summary
Forward P/E trough might be just around the corner, but central banks policy still does not support growth. It can be seen on the CLI Diffusion Index.
On the other hand, tight financial conditions should soon impact corporate earnings.
In that kind of environment - where EPS should not be rising and P/E not falling - selling the rip and buying the dip strategy might benefit more than just buy&hold.
I'll wait with my long-term investments.

RUT equilibrium Rut looks nicely balanced
It has retraced time and price in a controlled and balanced manner and is now in a clear range
All moves look balanced over the last few years
There is no evidence of a bear market in small caps at present…
GRI 2023

US Small Cap 2000 - Bears are in controlUS2000 - Intraday - We look to Sell at 1785 (stop at 1805)
Buying pressure from 1720 resulted in prices rejecting the dip. The current move higher is expected to continue. The bias is still for lower levels and we look for any gains to be limited. We therefore, prefer to fade into the rally with a tight stop in anticipation of a move back lower.
Our profit targets will be 1730 and 1630
Resistance: 1780 / 1830 / 1875
Support: 1725 / 1630 / 1530
Please be advised that the information presented on TradingView is provided to Vantage (‘Vantage Global Limited’, ‘we’) by a third-party provider (‘Signal Centre’). Please be reminded that you are solely responsible for the trading decisions on your account. There is a very high degree of risk involved in trading. Any information and/or content is intended entirely for research, educational and informational purposes only and does not constitute investment or consultation advice or investment strategy. The information is not tailored to the investment needs of any specific person and therefore does not involve a consideration of any of the investment objectives, financial situation or needs of any viewer that may receive it. Kindly also note that past performance is not a reliable indicator of future results. Actual results may differ materially from those anticipated in forward-looking or past performance statements. We assume no liability as to the accuracy or completeness of any of the information and/or content provided herein and the Company cannot be held responsible for any omission, mistake nor for any loss or damage including without limitation to any loss of profit which may arise from reliance on any information supplied by Signal Centre.

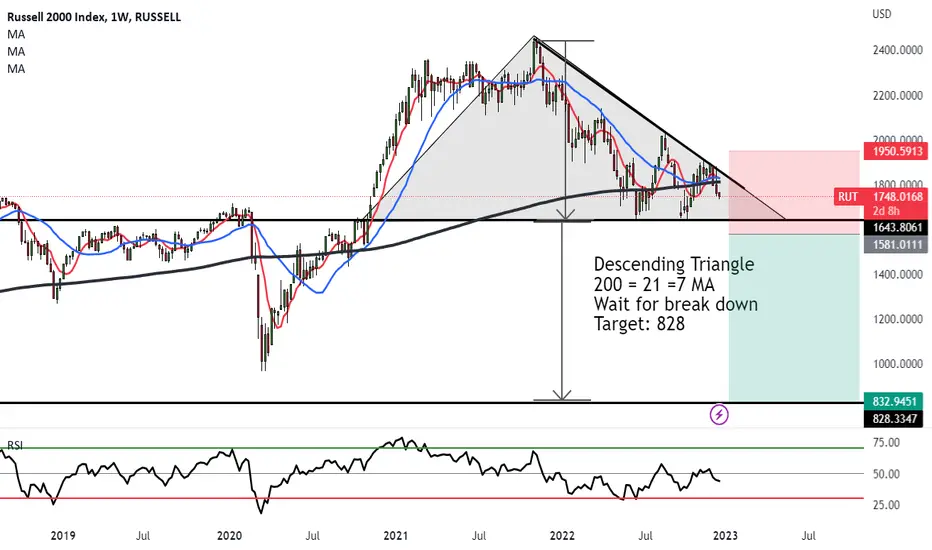
Russell 2000 Index Descending Triangle to cause a major breakdowDescending Triangle has formed on Weekly for the Russell 2000 Index.
The moving averages are all touching and seem to be at deciding point 200 = 21 =7 MA
We need to wait for the official breakdown which will take the price to a target of 828.
There are major warning signals for a Recession in 2024 with the inflationary pressures in the US, UK and Russia.
We haven't seen these levels in decades and with interest rates on the constant rise, this will attract investors to fixed income assets and deposits int he bank.
However, the Recession is one aspect. The markets are actually setting up for a meltdown. We just need to wait for the catalyst to send it.
Until then, we keep our eyes opened for possible opportunities.
Russell 2000 Index - EXPLAINED - What, Why, Where, How?Small cap stocks, Penny stocks and pink sheets are the high adrenaline stocks investors play games in.
They are generally the cheaper, highly volatile, some are illiquid and can fluctuate 50% - 1,000% a day.
From the Wolf of Wallstreet glamorizing the potential returns for investors to your every day salesman broker trying to sell you the next winner.
But what is the Russell 2000 Index and what should we know about it?
I’m going to sum it up a bit of information about how it works and important facts you need to know
Enjoy!
WHAT IS IT?
The Russell 2000 Index (listed in 1984) is a stock market index that tracks the performance of small-cap publicly traded companies in the United States.
It is named after the Russell Investment Group, which operates the index.
The share price can vary significantly, as it is made up of a diverse range of small-cap publicly traded companies.
MARKET CAP
Small-cap stocks are generally ones with a market capitalization of between:
$50 million and $2 billion.
CRITERIA TO LIST STOCKS
There are a few criteria that needs to be met to qualify for the inclusion in the Russell 2000 Index:
• The company must be a publicly traded U.S. company.
• It must market capitalization of at least $50 million.
• Must be ranked in the bottom 2,000 of the Russell 3000 Index, based on market capitalization.
• Must meet certain liquidity requirements, including having a minimum average daily trading volume of at least 250 shares over the previous six months.
• Must have a minimum of one year of trading history.
WHAT IT CONSISTS OF
The index is made up of the smallest 2,000 publicly traded companies in the Russell 3000 Index, which represents approximately 98% of the total market capitalization of all publicly traded companies in the United States.
HOW IT OPERATES
The index is reconstituted annually, with new companies added and removed based on their market capitalization and other factors.
VOLATILITY & LIQUIDITY
The Russell 2000 Index has a high level of volatility (greater price swings) and low liquidity (ease of flow of orders) compared to other large cap stocks.
DANGERS WITH THE INDEX
Currency risk: When the US dollar drops the index can follow
Diversification: There is no sector for the stocks. When the index drops the stocks follow.
Liquidity: You might find difficulties finding buyers or sellers to ease in or out of your positions.
Volatility: The jumpiness in the market is highly erratic.
Lack of analyst analysis: You’ll hardly see news coverage via the media which means, you could be left in the dark with what is going on in the companies.
Liquidation risk: You have a higher chance at being in a company that is about to be liquidated due to financial issues, no growth, manipulation and cooking the books.
Economic issues: When global economies collapse, stocks drop with it. Small cap stocks are no exceptions. This can affect the investment prospects
.

US Small Cap 2000 - Bears are in controlUS Small Cap 2000 - Intraday - We look to Sell at 1790 (stop at 1810)
Although the bears are in control, the stalling negative momentum indicates a turnaround is possible. A higher correction is expected. With the Ichimoku cloud resistance above we expect gains to be limited. We therefore, prefer to fade into the rally with a tight stop in anticipation of a move back lower.
Our profit targets will be 1730 and 1630
Resistance: 1780 / 1830 / 1875
Support: 1725 / 1630 / 1555
Please be advised that the information presented on TradingView is provided to Vantage (‘Vantage Global Limited’, ‘we’) by a third-party provider (‘Signal Centre’). Please be reminded that you are solely responsible for the trading decisions on your account. There is a very high degree of risk involved in trading. Any information and/or content is intended entirely for research, educational and informational purposes only and does not constitute investment or consultation advice or investment strategy. The information is not tailored to the investment needs of any specific person and therefore does not involve a consideration of any of the investment objectives, financial situation or needs of any viewer that may receive it. Kindly also note that past performance is not a reliable indicator of future results. Actual results may differ materially from those anticipated in forward-looking or past performance statements. We assume no liability as to the accuracy or completeness of any of the information and/or content provided herein and the Company cannot be held responsible for any omission, mistake nor for any loss or damage including without limitation to any loss of profit which may arise from reliance on any information supplied by Signal Centre.

From "Hovercraft" to IHS pattern? WAY EARLY but interesting 2cDo you see it? $DJI
Is it easier to see on weekly?
The "Hovercraft" patter COULD be a precursor to an Inverted Head & Shoulder!
See it now?
IT'S WAAAY early & it doesn't mean it'll happen
$ETH had one recently & went kaput
Can $DJI #BEAR be ending? Time will tell
IMO chances are NOT for
BUT
As stated MANY TIMES #markets are NOT logical
What about $NDX $SPX & $RUT?
Short answers
no, bleh & actually looks like head & shoulder recently lol

🟨 January effect - SPX vs RUTWHAT IT IS
Since 1988 the Russell 2000 has outperfomed the SPX 73.5% of the time during the end of December into 1st of January.
Classical David vs Goliath. Read more below👇
THE DETAILS
Testing from 1988 to 2021 the period of 15th Dec through to 1st Jan, we see that Russell 2000 has outperformed the SPX 25 out of all 34 years.
This is a win rate of 73.5% . Moreover, the times the Russel outperforms the SPX were greatly oversized when the Russell underperforms. Gains in the years of outperfmrance are 5 times bigger. Totals outperformance vs Total underperformance is (42.80% vs -7.81%).
And there was only 1 year (1988) when there was a loss larger than 1%. The last few years we have not been so consistent but it is worth the consideration.

RUT Short Idea -AGGRESSIVE- An Extremely aggressive short idea on the RUT if one didn't nail the Mother of All Trend Lines on the S&P500
Regarding support as resistance w/ Hourly Hidden Bearish Divergence on MACD + RSI , regarding Fast EMA as Resistance
Daily Double Top Confirmation Line Broken

Russel 2000 Bear Market?It seems by all indications that we are heading into a bear market. With raising interest rates, tapering, and shrinking of balance sheets, we will see the Russel take at least a 20% tumble from the current price. The 100MA puts the Russel 2000 at around 1400, and further down on 200MA. A couple of key points:
Only 40% of Russel 2000 are above 50-Day MA.
Only 45% of Russel 2000 are above 50-Day MA.
MACD is crossed and looks bearish.
Fed slowing down its QE.
I was a bit curious why the Russel 2000 took a dip in 2018-2019 with the economy doing so well then. The one thing that I could overlay to make some sense to it was the Federal Funds Rate went up to 2.42%
Even mainstream investors like Jon Najarian has taken short positions in the IWM for February. The economics speak it, the Fed speaks it, the indicators speak it, and now even mainstream economists are accepting there is some market shaking coming.

Stocks can go higher, but how much higher?I will start by sharing a Twitter poll, which shows the sentiment we are seeing now. Most think we are going lower. Therefore, the market could go higher in the short term. twitter.com
I believe our target is the critical breakdown level that was never retested on the chart above. The maximum upside is the R3 Monthly Pivot + Yearly Pivot, which will most likely reject the price. Recession or no recession, the market has room to the upside for reasons different from what most people think. Won't get into these things here, as I want to keep this idea simply about the key targets I have for stocks.
For Nasdaq, it is hard to tell how high we will go as there is more than one target. For the S&P500 and the Russell below, the targets are very clear. However, for QQQ - NDX - NQ, more than one gap must be filled.
Based on the above, I expect the market to top about 6% higher from here, and potentially as much as 10% for the Nasdaq 100.

Overall market still in bottoming processA good leading indicator is comparing the Russel 2000 against the S&P 500.
For the last 6 years, every time the market bottoms its been with small cap stocks outperforming the general market.
And RUSSELL:RUT has been outperforming the SP:SPX since January
Just another thing to keep an eye on.
