RVN preparing to launch for a 70% move (part two)RVN looks really good for a bounce in the coming days/weeks.
Bullish divergences, slowing selling momentum, volume showing signs of accumulation, all indicating a bounce is just around the corner.
Entries in the 327-320 area.
Targeting:
1. 409 for a 25% move in the near term
2. 559 for a 70% move in the medium term
Daily candle close below 290 or any kind of new low from here would invalidate the trade.
Previous 50% move on RVN:
Rvn

RVN/BTCKeep it simple!
Green box is the range where I buy, the Orange box is where I take profit. At each profit target I take out 20% of the initial trade.
For a long term swing trade we need to see RVN hold the green box as supports, test the previous resistance and then come back down to hold a higher low. If this happens we can see RVN test many of these profit targets.

RVNBTC | Potential 28% ProfitHi Everyone,
- RVN looking for a healthy bounce
- Taking the risk for this trade
- Nothing Special
| Rootselaar Crypto |

RVN Symmetrical Triangle 50/50. Pivot Points. Price clamped.RVN / BTC on the coin a month ago a downward wedge was formed, which was broken up. In this regard, a local upward trend for 1 month has formed. This trend gave a price increase of + 52%. Then the local uptrend changed to a downtrend and the price returned back to the purchase zone.
Also in the purchase area you can see a huge shadow of 18%. They directed the price there specially, broke through the previous support, collected liquidity, as most traders thought that there would be a continuation of the downtrend. But it was not there. We collected all the liquidity at the lowest prices and pulled the price of the bistro up 18%. I think that the one who worked the stop loss under the support will not want to buy a coin more expensive by + 18%. Passengers are thrown off .
The coin has a clear presence of a major player who skillfully manipulates the price. At the moment, a symmetrical triangle has formed on the coin. The chances of a breakthrough rise / fall in such formations are 50/50. The price is in the corner. Coming soon.
Entrance on the breakthrough of the triangle. Or at a rollback of the price, depending on who has what strategy and manner of trading. I don’t specifically write about stop loss, it is a moot point to use on such coins. You yourself see how the shadow of a candle collected stop loss from the crowd. What matters here is not the size of the stop loss, but the moment you enter the trade and understanding what is happening. I showed all levels and pivot points on the chart.
________________________________
I have been trading this coin for several months. Here are the old trading ideas that worked well.
RVN. Cycle. Coin for the pumps. Global target. Published September 17th.
RVN Falling Wedge. First target + 30% Figure potential + 100% Published September 17th.
And the result after 3 weeks + 50% If you do not trade on the waves, and so much more profit.
_______________________________________
Symmetrical triangle.
The figure is a symmetrical triangle is a very common figure, which does not have a pronounced direction, as it is characterized by a balance between supply and demand. 50/50. The figure is formed of two converging lines (resistance line and support line). The intersection of these lines is called the top of the triangle. The amplitude of fluctuations within the figure decreases, as indicators of trade volume gradually decrease. Support and resistance lines have equal angles of inclination. This triangle shape resembles an isosceles triangle when the bisector divides it exactly in half (pink line).
The price when breaking through a triangle can go both up and down. You need to understand that this model of a triangle gives a chance to go up or down in a ratio of 50/50. In such models it is very important to work from the situation.
____________________________________
Features to which you should pay attention when forming this model of a figure.
1) There must be a minimum of 4 points of contact 2 touches to the ascending line of support and 2 to the descending line of resistance. Then later touch points on both sides should tend toward the horizontal center of the triangle. And it is worth noting that the more points of contact, the more reliable the figure.
2) The trading volume as the formation of the figure should decrease.
3) if inside the symmetric triangle (component of the triangle wave) the price increase is accompanied by an increase in volume indicators, then it is most likely that the figure will be broken up. And vice versa, if inside a symmetrical triangle a price drop is accompanied by an increase in volume indicators, then most likely the figure will be broken down. Do not forget to look in the tape of sales.
4) The ideal moment for a breakthrough is considered to be the moment starting from half to 3/4 of the figure. A break in the first half of the figure, as a rule, turns out to be premature, and in its last quarter, most likely, will be insignificant.
5) Symmetric (isosceles) triangle - a figure of the continuation of the trend. Most likely, the price will break through the support / resistance level and go in the direction of the trend. This is in most cases. It happens that an isosceles triangle reverses the trend. The direction of the price movement depends on the side on which the price has left the figure. Therefore, the direction of the price movement into which the triangle made its way, rather than the previous trend, is more important. A symmetrical triangle can very rarely reverse a trend.
6) the proximity of significant levels of support / resistance can also affect the direction of price movement.
7) Sometimes, the horizontal center of the triangle becomes a line of support or resistance (pink line in the picture).
8) If the upper resistance line has been broken, it becomes a support line. The broken bottom support line later becomes a resistance line. Sometimes after breaking through the price as a result of correction may temporarily return to this line.
9) The breakthrough of the figure should be convincing. It is desirable that a breakthrough in the direction of the dominant trend be accompanied by an increase in trading volume. When breaking against the trend, a sharp increase in trading volume is a prerequisite for confirmation.
10) An important breakthrough is not so important, namely, fixing the price outside of support / resistance.
11) The goal when working out a symmetrical triangle after a breakthrough is equal to the absolute value of the base (the widest part of the triangle) added to the price exit point.
______________________________________________
The target of practicing the shape of a symmetrical triangle.
The target of working out the figure is equal to the height of the widest part of the "Symmetrical Triangle" (price range from support to the highest peak). We measure the distance of the widest part of the figure and debug it down at the point of breakthrough of the triangle.

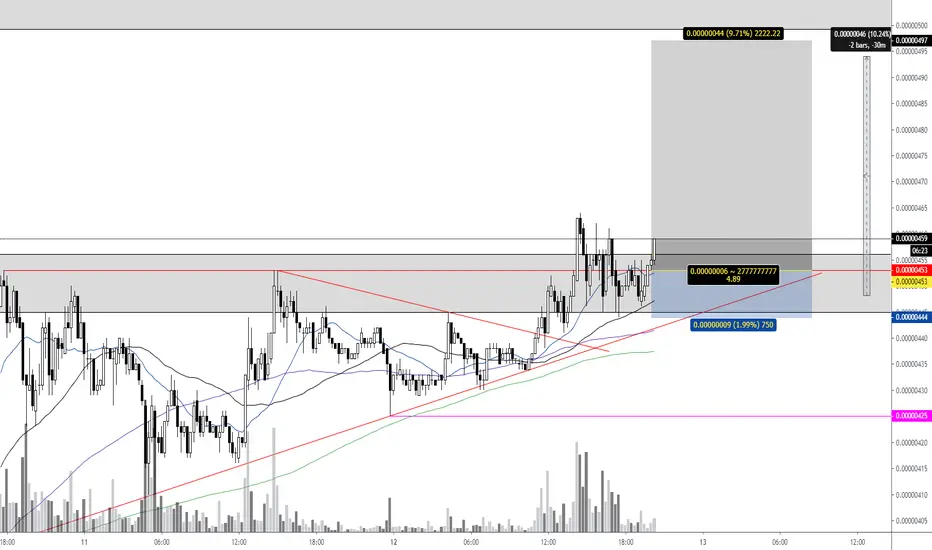
$RVN, Looking good here as its breaking from descending channel $RVN
Looking good here as its breaking from descending channel as it bounces from ~300sats support with volume...
UCTS indicator starting to show buy signals on low TFs
MACD bullish divergence..
As immediate target ~355 sats
#RVN

$RVN, Descending channel testing support level at ~305 sats...$RVN
Inside a descending channel testing support level at ~305 sats
Breaking from here could lead to big recovery back to ~350+ sats
For now just set alerts and wait for it to happen or take a risk with a SL under support...
#RVN
Over the last few weeks I have been managing my Stop losses, Take profits and trading in general through the "Smart Trade" platform that 3commas offers... It has been a really nice experience
Thanks


RVNBTC BullishRVN is going back to upper trend line of raising channel. RVN is ending ABC correction and perfert Buy zone is 618 retracement + it is support zone. Targets are basic Fib. retracements + double top ;) Stop Loss, Targets, Buy zone, Support, Important values you can see in chart ;)


rvnbtcthis is a triangle pattern
after completing the 'd' wave, just buy it in the correction wave (e)

RVNBTC | Potential 85% ProfitHi Everyone,
- RVN had a perfect hold on it's support
- Support showed strength signs
- Good Fundamentals
| Rootselaar Crypto |

LONG - RVN - Trading OpportunityGreat consolidation right below the cloud, TK cross about to happen as well which gives us a signal for a possible edge to edge move.
Entry: 0.00000373
SL: 0.00000347
TP 1: 0.00000400
TP 2: 0.00000487
TP 3: 0.00000613
CryptoCue is not providing investment advice and is not taking subscribers’ personal circumstances into consideration when discussing investments. Investment involves a high degree of risk and should be considered only by persons who can afford to sustain a loss of their entire position.
CryptoCue is not registered, licensed or authorized to provide investment advice and is simply providing an opinion, which is given without any liability or reliance 1.71% whatsoever. The information contained here is not an offer or solicitation or recommendation or advice to buy, hold, or sell any security. CryptoCue makes no representation as to the completeness, accuracy or timeliness of the material provided and all information and opinions provided by CryptoCue are subject to change without notice and provided on a non-reliance basis and without acceptance of any liability or responsibility whatsoever or howsoever arising. You hereby irrevocably and unconditionally waive, release and discharge: (a) any and all accrued rights and/or benefits you may have against CryptoCue in respect of any opinion expressed or information conveyed by CryptoCue at any time; (b) any and all Claims you may have against CryptoCue arising out of any opinion expressed or information conveyed by CryptoCue at any time; (c) CryptoCue from all and any claims (whether actual or contingent and whether as an employee, office holder or in any other capacity whatsoever) including, without limitation, Claims you may have against CryptoCue arising out of any opinion expressed or information conveyed by CryptoCue at any time. ("Claims" shall include any action, proceeding, claim, demand, judgment or judgment sum of whatsoever nature or howsoever arising.) You hereby agree to indemnify and hold harmless CryptoCue in respect of any and all Losses paid, discharged, sustained or incurred by CryptoCue in the event of bringing any Claim against CryptoCue. (“Losses” shall include any and all liabilities, costs, expenses, damages, fines, impositions or losses (including but not limited to any direct, indirect or consequential losses, loss of profit, loss of earnings , loss of reputation and all interest, penalties and legal costs (calculated on a full indemnity basis) and all other reasonable professional costs and expenses and any associated value-added tax) of whatsoever nature and/or judgement sums (including interest thereon).)


RVN/BTC MAKE TRIANGLE PATTERN ON BINANCE EXCHANGE RVN/BTC MAKE TRIANGLE PATTERN ON BINANCE EXCHANGE 1HR CHART


Ravencoin Price Analysis RVN / USD: Flight FatigueRavencoin has undergone a bearish reversal after rallying to its highest trading level since late August. The RVN / USD pair has given back around ten percent of its trading value as the broader cryptocurrency market comes under pressure.
The RVN / USD pair has been one of the top performing digital assets inside the top 50 this month, with the cryptocurrency adding close to thirty-five percent to it value from its monthly price open to its monthly price peak.
The recent reversal in the RVN / USD pair happened at a critical technical area, as the cryptocurrency tested towards the neckline of a large head and shoulders pattern on the daily time frame.
The bearish pattern was triggered last month, leading to a sharp decline towards the $0.240000 level. The neckline of the head and shoulders pattern is currently located around the $0.370000 level.
Looking at the lower time frames, the early month rally has now created a bullish ascending triangle pattern on the four-hour time frame. The pattern suggests that the RVN / USD pair could rally towards the $0.470000 level if the pattern is fully ignited.
It is worth noting that that the RVN / USD pair would need to rally be close to one hundred percent to invalidate the head and shoulders pattern on the daily time frame.
According to the latest sentiment data from TheTIE.io, the short-term sentiment towards Ravencoin is neutral, at 56.50 %, while the overall long-term sentiment towards the cryptocurrency is also neutral, at 49.00%.
RVN / USD Daily Chart by TradingView
Upside Potential
The four-hour time frame highlights that the RVN / USD pair has now reclaimed its short-term bullish status. The 200-period moving average on the mentioned time frame is now located at the $0.307000 level.
The daily time frame highlights that the $0.370000 and $0.400000 levels are key upcoming resistance. It is worth noting that the pair’s 200-day moving average is currently located around the $0.470000 level.
Downside Potential
The four-hour time frame is showing that major short-term support for the RVN / USD pair is located at the $0.315000 and $0.307000 levels.
The daily time frame is showing that the RVN / USD pair’s 50-day moving average is located around the $0.317000 level, while major trendline resistance is found at the $0.303000 level.
Summary
Ravencoin is starting to come under minor technical selling pressure, after reaching levels not seen since late August this year.
The lower time frames are projecting that the recent rally in the RVN / USD pair may still have legs, with the $0.470000 level the likely short-term bullish target.

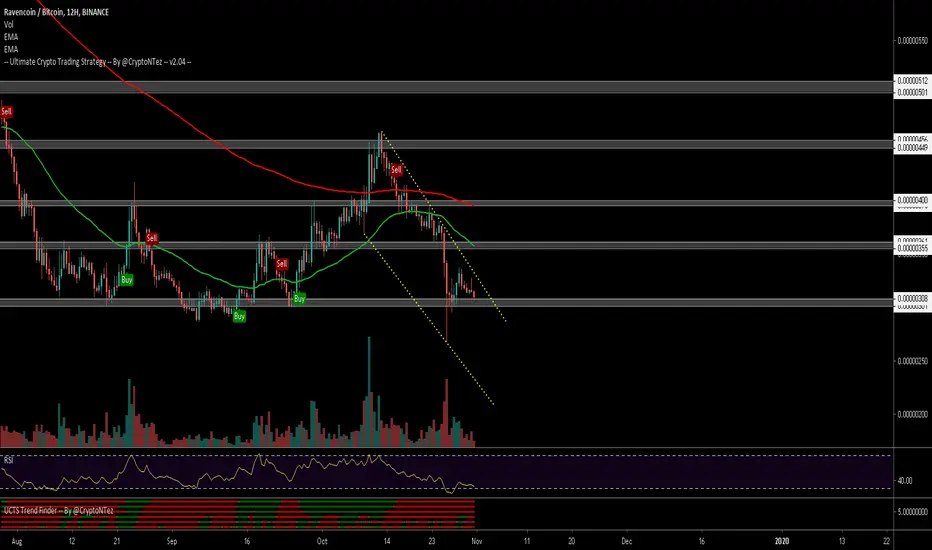
$RVN Retested ~400sats and seems to be hodling/flipping it...$RVN
Retested ~400 sats level and seems to be hodling/flipping it on the 12H chart into support
If continuation happens from here (volume!), then we should aim for a new leg up with target at ~500 sats
UCTS Buy signal active on the 1D & lower TFs
SL under support
#RVN
RVNBTC Buy SignalPattern: Channel Up on 1D.
Signal: Bullish due to the RSI divergence, and the fact that the price has completed the most days trading above the 1D MA50 since April.
Target: 0.00000600 (expected contact with the 1D MA200).

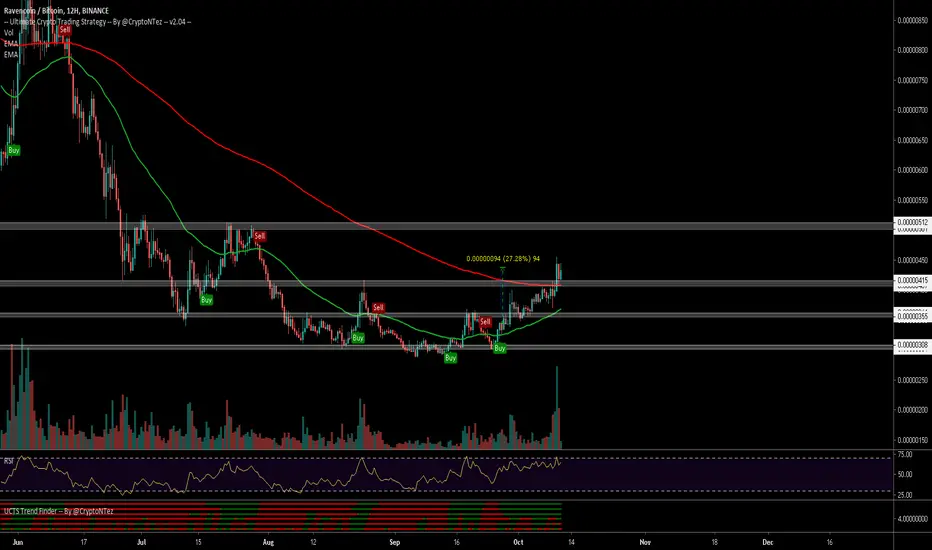
$RVN, Testing for 1st time reclaimed level at ~350 sats$RVN
Testing for 1st time reclaimed level at ~350 sats and showing signals of bouncing/flipping it into support
Volume looks kinda low, but still worth taking a shot
If continuation happens, then aiming for ~400 sats retest as 1st target
UCTS Buy signal active on the 12H
#RVN

Ravencoin (Oct 06) #RVN $RVN #BTC $BTCBuy : 375-350
Sell : 400-430-460
Mid-Hold : 550
Stop : Under 300

Ravencoin (RVN): Go With ItRavencoin (RVN) may be in the process of making a genuine breakout to the upside.
Ravencoin (RVN) is breaking above a speed resistance line at 420. The next upside target could be 636. That is the location of another Fib speed resistance lines.
One of the reasons that we think Ravencoin (RVN) could go on a bullish rampage is that the "previous 4th" wave is up at 935. After a significant downtrend, Elliot Wave practitioners believe a market can rally back to the point where the big crash began. In Elliot jargon, this is called a rally to the "previous 4th." So, while wave counting is a highly subjective business, we believe the previous 4th is up at 935.
Ravencoin also makes sense fundamentally. Ravencoin (RVN) can help tokenize assets like real estate. To us, it's a matter of time before sophisticated institutional investors, and even banks, want to start trading tokenized versions of legacy assets.
Bottom Line: If there is ever a time to close your eyes and go with a rally in altcoins, Ravencoin (RVN) may be that opportunity.
