BAC: Quantitative Analysis and Targets Should you invest in BAC, or even more generally, banks right now?
No.
BAC is likely going to come down. If we look at its scatter plot chart below we can see more clearly the likely trajectory here:
Touching that linear line is almost a guaranteed IMO, which is a price point in the mid 30s.
I also expect it to come to or at least close to that quadratic line which is between $20 and $26.
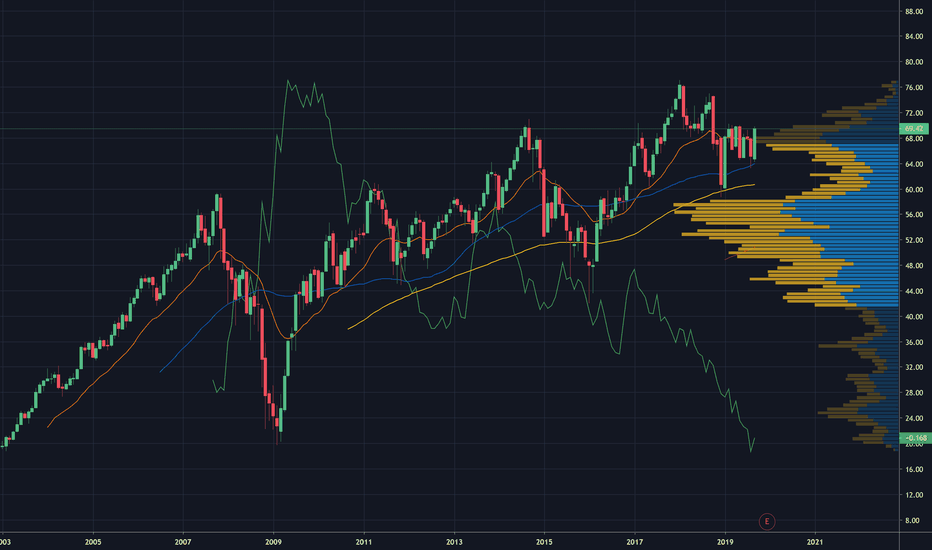
If you look at the monthly chart (Above), I have plotted out some key technical support/resistance areas as well.
Bank stocks are not inflation resistant but tend to be more hardy against recessions. However, if this is what you are looking for, I would probably shift my interest to Canadian banks. They tend to perform better and are more secure. However, I wouldn't advise investing in anything Canadian right now, because the Canadian stock market is still currently trading at ATHs. RY is in ATH territory and its really interesting to see the huge disconnect between the NYSE/US market in general and the Canadian market. Canada is like, in a different world apparently, with no concerns of inflation, recession or anything, lol. Check out XIC (The SPY version of the TSX):
My thoughts, no financial advice!
Feel free to comment/question/critique.
Thanks for reading!
RY
RYIntermediate target is $80. Long term is $20.
Earnings for Canadian banks is in late August. With the pressure the BoC is placing on Canadian homeowners, already declining home prices, in addition to unrelenting inflation this earnings season could spur a massive wake-up call throughout the Canadian economy.
It appears the BoC intends to lift rates 350bps by years end. This comes with the potential of triggering fixed payment variable-mortgages, of which account for over 40% of total Canadian mortgages.
Characteristics of a Massacre.
RY - Time to Close Long Positions and Short the Banks?Is the largest bank in Canada, Royal Bank of Canada , able to have another push to the upside considering the looming recession or is it time to eject and reverse to short positions?
Fundamental indicators:
Revenue and Profits - demonstrated consistent long-term earnings growth over the past 10 years
Profit margin - impressive 32% last year
P/E - reasonable ratio of 11.5x
Liabilities - although debt has increased in the last 5 years it is still reasonable for the bank industry
Technically:
The sharp fall in March 2020 completed the global correction since the great financial crisis in 2007
Since then the bull run has been clearly formed by an impulse where the last 5th wave is currently developing with Ending Diagonal (Elliott Wave structure)
The remaining part is the zig-zag ABC to update the historic high of $119.41
Thereafter, it is possible to observe a lengthy and very deep correction to the level of the previous correction $49 or even deeper
Note - in order for this scenario to be viable the price cannot go higher than $122.39. This is because wave 3, following Elliott Wave rules, cannot be the shortest in impulse, hence the constraint on the price level of the fifth wave
Looking at both fundamental positive indicators and potential wave structure what do you think about this scenario?
Are you planning to trade Royal Bank of Canada ?
Please share your thoughts in the comments and like this idea if you would like to see more stocks analysed using Elliott Waves.
Thanks
Royal Bank of Canada not so royal anymore. RYImmediate targets 111, 109, and 106.
We are not in the business of getting every prediction right, no one ever does and that is not the aim of the game. The Fibonacci targets are highlighted in purple with invalidation in red. Fibonacci goals, it is prudent to suggest, are nothing more than mere fractally evident and therefore statistically likely levels that the market will go to. Having said that, the market will always do what it wants and always has a mind of its own. Therefore, none of this is financial advice, so do your own research and rely only on your own analysis. Trading is a true one man sport. Good luck out there and stay safe
RBC $RY large head and shoulders patternRBC $RY large head and shoulders pattern forming, as the correction in September 2011 and January 2016 formed the base for the left shoulder. While the rally from 2016 to 2018-2019 formed the head of the top.
Looking for RY to retrace to the base at $44 by March 2020.
Short term retrace to lows of December 2018.
Canadian Banks (UPDATE)Canadian bank stocks haven't really moved in 2 years. This consolidation has confused both bulls and bears, but it will come to an end by the end of this year (2020). Breaking above the all-time high will be a big buy signal, as it will indicate that the cyclical bull market is still intact. However, breaking below the major upward trendline will confirm a change in trend. Current the bias is to the upside, but this can quickly change if time runs out and price doesn't make it above the all-time high.
Based on my own fundamental analysis of the Canadian banking sector, there are significant problems brewing that could heavily impact equity values. Bank assets that are included in this bank index are mainly composed of speculative loans (+75% of bank balance sheets) to the real estate and financial sector. In China it's the opposite situation, where most bank assets are held by corporations who are engaged in some kind of productive activity. Thus, in Canada if there is a shock in the asset values of the speculative assets underlying the loans it will have a severe negative impact on Canadian bank equity.
Also, remember that Canada's yield curve is currently negative. This is a big sign of a recession ahead for the country. Households are holding a significant amount of debt (almost the highest ratios in the world), and are staring at some of the highest asset valuations in history. Moreover, manufacturing is contracting. There are no industrial policies in Canada at the moment that could counteract these trends, and it doesn't seem like Canadian governments are shifting away from laissez-faire policies.
PS. If you found this idea useful/interesting be sure to follow me on my Twitter account where I post more frequently. The link can be found on my TradingView profile or @ErikFertsman.
RY (Royal Bank of Canada) | 10% Short Trade SetupConfirmation: 103.60
Invalidation: Local high
Type of Trade: Countercyclical (EMA50 above EMA200)
Target: 92.19
TF:4HR
Leverage: 2x
Pattern: 1) daily double top with 2) trendline break, 3) untested 8/1 Gann, and 4) frothy fundamentals (insufficient loan loss provisions).
RY (RBC BANK) | Watch For Rejection and New DowntrendRY has filled a gap created back at the beginning of 2018 and we also see a potential large double top formation on the daily and weekly timeframes that is being formed by rejection. This is an opportunity to position short for a new downtrend on the lower timeframes, looking for support on the 8/1 Gann and as low as the 4/1 Gann.
On the larger timeframe, don't forget Steve's trade (targets are my own though):
PS. Some Index funds might be worth shorting as well.
Steve Eisman's Canada TradeSteve Eisman (depicted as Marc Baum in The Big Short movie) has publicly revealed the institutions he is shorting in anticipation of the next wave of credit normalization. They include RBC, CIBC, Home Capital Group, and Laurentian Bank. Steve has not revealed his targets or how far exactly the trade will go, so the estimates on the chart are my own.
As you know, I have been establishing net short positions on numerous banks around the world since the end of last year.
Short Royal Bank of Canada (RY)Short NYSE:RY
Fundamentals
NYSE:RY has over $222 billion in debt, which are mostly mortgages sensitive to interest rates rising.
Interest rates will remain low, which will cause a falling dollar.
The Canadian oil industry is a lot worse than USA and other parts of the world with break even costs at $60-65+ for oil sands. See the WCS Western Canada Select index.
Falling oil prices lead to a weaker dollar, but help exports.
Other Central Banks are raising interest rates, which will cause the CADUSD to weaken compared to others. This could cause a currency crisis which could lead to raising interest rates quickly.
Falling CADUSD is negative on Canadian equities.
Technicals and Trends
The long term trend line has been broken.
The 200 day moving average has been broken.
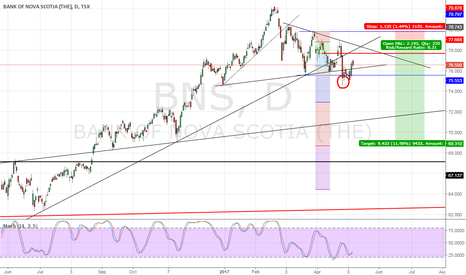
Notice the green oval, it is the same pattern in 2016 when the USDCAD was rising (CAD falling).
Disclaimer:
I am not a professional trader.
These are my personal notes for my use only.
I do not give trading advice.
I take no responsibility for any actions taken or losses occured from using the information provided.
Thanks and enjoy.


