Coinbase Global Inc. Bullish Confirmed Confirms Bullish BitcoinCOIN's chart looks very similar to Ethereum. Today's action reveals something great; bullish confirmed.
Always, since this stock started trading, it has been moving as a unit together with Bitcoin and the entire Cryptocurrency market.
When Bitcoin is bullish, Coinbase is bullish.
When Bitcoin is bearish, Coinbase is bearish and vice versa.
Here we have a very strong, high volume bullish breakout on COIN. This means that Bitcoin, Cardano, Ethereum, XRP, Dogecoin, Avalanche and the rest of the Cryptocurrency market is about to break bullish really strong.
There was a low point 7-April 2025. The same with the projects I just mentioned above.
Here this 7-April low marks a double-bottom compared to September 2024. After this low, the recovery starts and we have a strong rise.
In late May, there is a price peak and we enter a consolidation phase, in this case a small retrace. The chart is identical to ETHUSDT.
After a strong higher low, some minor bearish action with no bearish pressure, Coinbase is going up. You can expect the exact same dynamic happening to Bitcoin and all the Altcoins. Bullish confirmed. The market will resolve green.
Today Coinbase hits the highest price since February 2025.
Namaste.
S-COIN

Coinbase Shares Rise Following Stablecoin Legislation ApprovalCoinbase (COIN) Shares Rise Following Stablecoin Legislation Approval
Shares in Coinbase Global (COIN) surged by 11% yesterday, making the company the top performer in the S&P 500 index (US SPX 500 mini on FXOpen).
The sharp rise was driven by news that the US Senate has approved the GENIUS stablecoin bill, which sets out a regulatory framework for the use of stablecoins — crypto assets whose value is pegged to another currency or financial instrument, such as the US dollar.
The bill (which still requires approval from the House of Representatives) would pave the way for banks, fintech companies, and other financial market participants to use stablecoins. This development acted as a strong bullish catalyst for COIN shares.
Technical Analysis of Coinbase (COIN) Share Price Chart
In our previous analysis of the COIN share price chart, we:
→ identified an ascending channel (shown in blue);
→ suggested that the COIN share price could rise towards the psychological level of $300.
That projection has played out — the price is now very close to the $300 mark. So, what comes next?
In a bold, optimistic scenario, buyers may hope for a continuation of the rally, with the share price pushing towards the upper boundary of the long-term ascending channel, especially following the recent news. In the medium term, the blue ascending channel may remain relevant, given the strong signal of improved cryptocurrency regulation in the US legislative framework.
However, we also note some vulnerability to a pullback, as:
→ the $300 level may act as significant resistance;
→ the price is approaching the upper boundary of the blue channel, which also shows resistance characteristics;
→ once the initial wave of positive sentiment fades, some investors may look to take profits, especially given the more than 20% rise in Coinbase (COIN) shares since the beginning of the month.
This article represents the opinion of the Companies operating under the FXOpen brand only. It is not to be construed as an offer, solicitation, or recommendation with respect to products and services provided by the Companies operating under the FXOpen brand, nor is it to be considered financial advice.

COINBASE: Is it a guide on how to trade PEPE??Coinbase saw a massive surge yesterday as the Senate cleared the path for stablecoin regulation. This turned its 1D technical outlook almost overbought (RSI = 68.001, MACD = 11.870, ADX = 26.090). Our TP = 348.50 on COIN remains but oddly enough, we see a stronger than expected correlation with PEPE. Since it is now lagging after the Senate decision, this may be a great time to buy PEPE as this pattern shows that soon it will follow Coinbase upwards anf they will converge.
See how our prior idea has worked out:
## If you like our free content follow our profile to get more daily ideas. ##
## Comments and likes are greatly appreciated. ##

ANOTHER COVERED CALL ON COINI bought to close my previous one. That is linked below.
I sold for 2.33. BTC for .80 on Friday. With today's LARGE move AND being a retest gap, I will sell another one. TREND is still bullish. Buy dips and hold on!

covered call on COINCryptos are pumping.. Trend is bullish. Moving averages, gaps, volume, everything looks like this should eventually resolve higher.

DOGE/USDTDogecoin is currently in a trading range and could enter a trend if it breaks the upper and lower lines. We'll have to wait and see what happens.

$COIN i following this gann arc quiet nicely!once price breaks the arc it will gravitate to the next one

BTCUSD : SELL IN 4HR CHARTBTCUSD SELL @ 106000 or below
Target : 100000
Stoploss : 107500
BTCUSD formed a perfect sell trend in 4hr chart. I am short on BTCUSD

ApeCoin (APE) Cup Pattern (1D)After a deviation below demand, BINANCE:APEUSDT formed a clean rounded bottom, reclaimed the zone, briefly consolidated, and it's now attempting to break above resistance.
Key Levels
• $0.79: Current resistance
• ~$0.65: Current support, breaking it might lead to the formation of a handle
• $0.50-$0.60: Main demand zone and logical pullback target in case of a handle
• $1.20: Measured breakout target, and previous swing high
Worth watching it closely for a daily close above $0.79 with good volume to activate the target.
Alternatively, look at the $0.50-$0.60 area for a reversal in case of a rejection here.

Bitcoin Brewing - A large move is coming!Bitcoin has been under pressure over the last few trading sessions.
Despite the equity markets going higher this asset is stuck in a holding pattern.
We are currently forming a wedge pattern that has given us a directional bias to trade.
Price action is at a 50/50 in terms of falling lower or rallying higher.
Being the fact that the bulls have been forming higher lows & higher highs, we have to give them due respect.
However understand this BTC is showing some distribution signs and is likely going to have a decent selloff within the next 15-45days. We may have 1 more spike higher but we may not.
1 note of interest is the 7day & 20 day moving average just signaled a bearish crossover which is something you need to monitor closely.
I do think the upside is limited to about 115K if we have 1 more move higher.

Bearish Divergence on Bigger tf
CMP 105228.47 (02-06-2025)
Bearish Divergence on Bigger tf (Cautious
approach should be taken).
However, if 109350 is Crossed, we may
witness 115000 & then 120000 - 121000.
and if 112000 is crossed & sustained, be ready
to get New Highs :-)
Lets be more cautious & dig out 3 Important
Support Levels.
S1 around 103000 - 102500
S2 around 97800
S3 around 93400 - 93500.

BOXCATUSDT Hourly Technical AnalysisBOXCATUSDT Hourly Technical Analysis
Boxcat, one of the newly listed coins, has moved sideways after the initial listing drop. Currently, it is pricing above the 0.0729 support level. In case of a possible reversal, Boxcat coin may present a high profit potential. With indicators also showing a positive outlook, we expect a possible upward movement in the near future. If a rise occurs and the price reaches the 0.10525 resistance level, there could be a profit potential of around 44%.
Resistances: 0.10525 - 0.11718
Support: 0.07290
THIS IS NOT INVESTMENT ADVICE.
The information, comments, and recommendations provided here do not constitute investment advice. Investment advisory services are provided under a contract between the investor and authorized institutions such as brokerage firms, portfolio management companies, and non-deposit banks. The content on this page reflects personal opinions only. These views may not be suitable for your financial situation or your risk and return preferences. Therefore, no investment decisions should be made based solely on the information and commentary provided here.
We’d greatly appreciate it if you follow and like us to avoid missing our analyses with positive or risky technical indicators.

COINBASE: 3rd Bollinger Squeeze is a pullback buy signalCoinbase is bullish on its 1D technical outlook (RSI = 65.834, MACD = 21.140, ADX = 19.909) as it is extending the bullish wave following the S1 rebound. The Bollindger Bands are now expriencing a squeeze, which is the 3rd since the bottom. The 2024 bullish wave also had three Bollinger Squeezes with the 3rd being the last that made the 349.50 High but not before a pullback to the Bollinger bottom. If that takes place, it will be a signal to go even stronger on the bullish side and target the R1 level (TP = 348.50).
## If you like our free content follow our profile to get more daily ideas. ##
## Comments and likes are greatly appreciated. ##

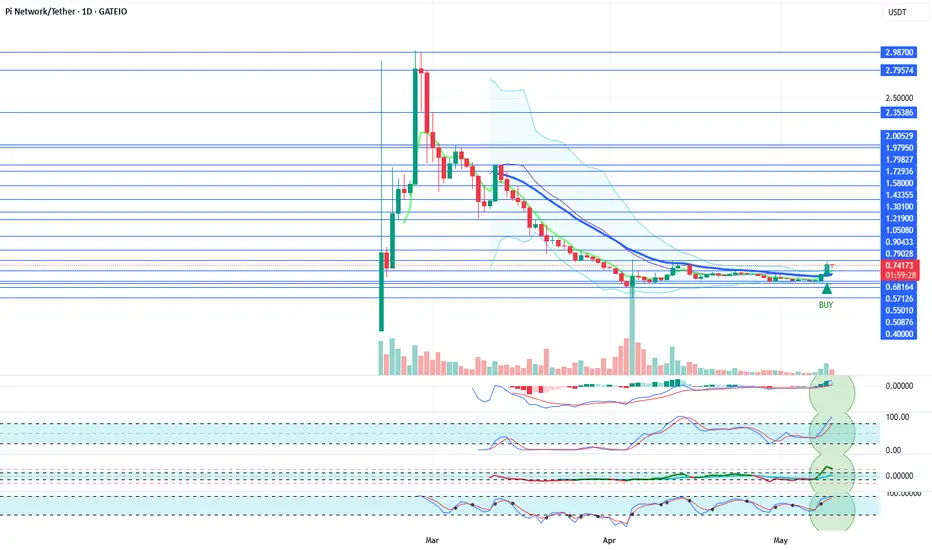
PIUSDT Daily Technical AnalysisPIUSDT Daily Technical Analysis
Pi Network Coin Indicators Are POSITIVE.
The price has broken above the 21-day moving average and successfully held above it. Currently, Pi Network appears to be targeting the $0.905 resistance level. After a wave of profit-taking, its recovery has increased the likelihood of continued positive price action. Resistance levels will be monitored closely. Indicators have turned positive from lower levels and are now pointing upward.
Resistance Levels: 0.900 – 0.963 – 0.999
Support Levels: 0.830 – 0.810 – 0.787
Positive news from the Pi Network team could support further upward price movement. Accumulating Pi Network Coin at these price levels for long-term investment might be considered potentially profitable. However, the decision is entirely yours. This is not financial advice. In the long run, Pi Network Coin may test the $3 levels again — or it might remain at a lower price range.
NOT FINANCIAL ADVICE
The information, commentary, and suggestions provided here do not constitute investment advice. Investment advisory services are offered only through a formal agreement with authorized institutions such as brokerage firms, portfolio management companies, or non-deposit banks.
The content on this page reflects personal opinions only. These views may not align with your financial situation or your risk and return preferences. Therefore, investment decisions should not be made solely based on the information provided here.
If you’d like to stay updated on our technical analyses — whether positive or risky — please follow and like us. We’d really appreciate your support!

ALPACAUSDT HourlyTechnical AnalysisALPACAUSDT HourlyTechnical Analysis
Alpaca Finance Coin indicators are POSITIVE.
The coin saw a strong upward movement following the news of its delisting from Binance. High returns continue in this cryptocurrency. Alpaca Coin, which experiences periodic price surges, is currently priced near its 21-day moving average. Due to low liquidity, it exhibits sharp price movements, making it a favorite among short-term traders.
While it appears calm at the moment, we believe Alpaca Finance may resume its upward trend over time.
If it breaks above the 21-day moving average, the 0.254 resistance level will be the next target.
In the case of sharp sell-offs, the 0.160 support level will be monitored.
Based on 2-week price movements, Alpaca has shown returns of 558% - 285% - 93% - 110% - 106% - 61% at various points.
This is a high-risk cryptocurrency. This is not investment advice.
Resistances: 0.254 - 0.260 - 0.268 - 0.279 - 0.306 - 0.314 - 0.345 - 0.372 - 0.410
Supports: 0.220 - 0.205 - 0.160
THIS IS NOT INVESTMENT ADVICE.
The information, comments, and suggestions here do not constitute investment advisory services. Investment advisory services are provided under a formal agreement between clients and licensed institutions such as brokerage firms, portfolio management companies, and non-deposit banks.
The content on this page reflects only personal opinions. These opinions may not be suitable for your financial situation or your risk and return preferences. Therefore, investment decisions should not be made solely based on the information and commentary provided on this page.
We’d appreciate it if you follow and like us so you don’t miss our analyses with positive or risky technical indicators.

PIUSDT Daily Technical AnalysisPIUSDT Daily Technical Analysis
Pi Network Coin indicators are POSITIVE.
It has broken above the 21-day moving average and managed to stay above it.
The announcement that the Pi Network team will make about its ecosystem on May 14th could significantly benefit the project and increase activity around the cryptocurrency.
Resistance: 0.79028 - 0.90433 - 1.05080
Support: 0.68164 - 0.57126 - 0.55010
New and positive news from the Pi Network team could support a price increase.
At these levels, accumulating Pi Network Coin for long-term investment could be considered potentially profitable. The decision is yours. This is not investment advice.
In the long run, there is a possibility that Pi Network Coin could retest the $3 levels.
For users who use the Pi app and hold locked Pi Network Coins, if there is no urgent need, they may consider re-locking their coins for another 2 weeks. They can continue this strategy by monitoring the price every two weeks.
In the long term, the probability of the price reaching much better levels remains high.
THIS IS NOT INVESTMENT ADVICE.
The information, comments, and suggestions here do not fall under investment advisory services. Investment advisory services are provided under an agreement between clients and authorized institutions such as brokerage firms, portfolio management companies, and non-deposit banks.
The content of this page reflects only personal opinions.
These views may not be suitable for your financial situation or your risk and return preferences. Therefore, investment decisions should not be made based solely on the information and content on this page.
We’d appreciate it if you could follow and like us so you don’t miss our analyses with positive or risky technical indicators.
Coinbase (COIN) Shares to Be Added to the S&P 500Coinbase (COIN) Shares to Be Added to the S&P 500
According to media reports, shares of the cryptocurrency exchange Coinbase Global (COIN) are scheduled to be added to the S&P 500 index (US SPX 500 mini on FXOpen) on 19 May, replacing Discover Financial Services (DFS), which is in the final stages of being acquired by Capital One Financial (COF). The deal, having received all necessary approvals from regulators and shareholders of both companies, is expected to be completed on 18 May 2025.
As a result, Coinbase Global will become the first cryptocurrency-related company to be included in the S&P 500 index — a development that sent COIN shares surging to their highest level since late February. Inclusion in the S&P 500 is considered a bullish catalyst, as it suggests increased demand for the stock from index funds and signals improved prospects. Analysts have taken note; Rosenblatt Securities raised their price target for Coinbase Global Inc. (COIN) from $260 to $300.
Technical Analysis of COIN Stock Chart
In previous analyses of the COIN stock chart, we:
→ drew a descending channel;
→ identified a resistance zone in the $225–240 range (highlighted in purple).
However, the surge in demand triggered by the news of COIN’s inclusion in the S&P 500 has led to:
→ the descending channel appearing to lose relevance entirely;
→ the price gapping above the purple resistance zone;
→ increasing grounds to draw a potential upward trend trajectory (shown with blue lines).
Given the current momentum, it is possible that the COIN share price could rise towards the psychological $300 level, which acted as resistance earlier in 2025.
This article represents the opinion of the Companies operating under the FXOpen brand only. It is not to be construed as an offer, solicitation, or recommendation with respect to products and services provided by the Companies operating under the FXOpen brand, nor is it to be considered financial advice.

COINBASE and ALTS going hand in hand! Massive break-out expectedCoinbase (COIN) and the Crypto Total Market Cap (excluding top 10) are going hand in hand in this Cycle as their patterns since the November 08 2021 High have been virtually identical.
Right now we are on a strong rebound which was initiated on both after breaching below the 1W MA200 (orange trend-line). That is basically a Double Bottom, aiming at a break-out above their respective Resistance levels, which is expected to be massive.
Notice how even their 1W RSI patterns are similar, both Falling Wedges. Also their Bull Cycles both started on an Inverse Head and Shoulders pattern, so there is every reason to expect that the two will continue hand in had until their very peaks of the Cycles.
-------------------------------------------------------------------------------
** Please LIKE 👍, FOLLOW ✅, SHARE 🙌 and COMMENT ✍ if you enjoy this idea! Also share your ideas and charts in the comments section below! This is best way to keep it relevant, support us, keep the content here free and allow the idea to reach as many people as possible. **
-------------------------------------------------------------------------------
💸💸💸💸💸💸
👇 👇 👇 👇 👇 👇

COINBASE and it's massive inverse head and shoulders...observed in Coinbase chart formation indicates it has potential to become a trillion-dollar enterprise!
With a Logarithmic projection heading towards $4000 per shares.
#COIN has a market cap off $66 Billion right now
It has as just entered the SP 500
Is in the process of receiving a Banking Licence
And is the main custodian for all the major #crypto ETF's
Those are the drivers why this is likely to be a four figure stock in the coming years.

Coinbase New All-Time High Confirmed (477 & 685)Good yes Cryptocurrency Bitcoin trading profits up winning today more. How are you feeling in this wonderful bull market session prices going up strong?
I hope your day is great and that's the same for the chart above. Coinbase, COIN, wow; a new All-Time High coming within months do you have any doubts? I don't think so. Those with doubts are gone, all that is left is us, the buy and hold crew. Successful traders, investors, miners, reporters, hobbyist, holders and curious onlookers, we are winning with Bitcoin and Crypto and this stock... This stock is easy to read.
There are so many bullish signals that I will skip them all and go straight to the bottom point. New All-Time High coming next. It will take months but it will be months of growth, higher heights and higher highs and fast bullish strong momentum building up and growing like nothing you've seen before.
If you are a bear, I am sorry for you but you were warned.
If you are a bull, congratulations my dearest of friends because this is only the start. Everything grows. Everything that is related to Cryptocurrencies of course because Crypto is the future of finance. Bitcoin is the evolution of money. Digital gold.
— Technical analysis
After a strong correction, the COIN stock produced a classic reversal formation as a v shaped bottom at the end of a bearish move. This move is followed by two strong green candles and these candles pushed prices above the 0.236 Fib. extension level, setting the stock into a bullish zone.
After the second big green candle, there is a small retrace in the form of a red week. This is normal and shows consolidation before additional growth. This week is also red but not for long. The fact that COIN remains trading very high compared to the full green candle close means that bears are not present and the bulls are in control.
The chart shows long-term higher highs as well as higher lows.
The chart structure points to a new All-Time High happening very soon, within months. 3-6 months. 3 months for a new All-Time High and 6 months for a major peak. The whole flavor of this market is giving out clues of a cycle that will be big and extended long-term.
Coinbase can grow for longer than what you are prepared for.
The next All-Time High can happen around 477 but this wouldn't be the end of the bullish cycle and wave. I expect even higher targets, the next one being 685. Hold tight, the best is yet to come.
Thank you for reading.
Namaste.

COIN ~ Inverse Head & Shoulders Breakout -- Key Levels- Hello traders! COIN made a massive move today, breaking out of a beautiful Inverse Head & Shoulders pattern. So whats next?
- There are significant resistance levels approaching between $267 and $302 (including the Inverse H&S target level) which could potentially make for a good intraday short trade opportunity.
- Watch for a quick reversal from these levels in the coming days, if you're quick you may be able to catch a short trade.
- Theres no gaurantee that price will bounce from these levels, however this zone will certainly act as significant resistance in the short term.
~ Thanks everyone and best of luck in your trading journey!

$COIN is FLYING! 33% UpsideNASDAQ:COIN Trade Alert 🚨
🎯$240🎯$286 (MM)
- Inverse H&S Breakout ✅
- Massive Volume GAP ✅
- Bullish H5 Indicator ✅
- Crypto flying ✅
Not financial advice

GOLD - The Timeless Standard Bitcoin Can Only Dream Of ✨💰
1/ Bitcoin’s Aspirations vs. Gold’s Reality
Bitcoin proclaims to be “digital gold” , promising decentralization and stability. But the truth is clear: while Bitcoin is shaken by extreme wealth concentration and constant media hype, gold has built a centuries-long reputation for trust and enduring value. 🔥🏆
2/ The Digital Gold Revolution
Gold isn’t a relic—it's evolved! 🚀 Today, through blockchain tokenization, you can own digital gold that’s 100% backed by physical gold safely stored in vaults. 🏦🔐 This fusion of ancient value and modern tech shows that gold means business, while Bitcoin just tries to copy its legacy.
3/ Concentration vs. Distribution
Check this out: over 90% of Bitcoin is hoarded by a few whales 🐋, leaving everyday holders with crumbs. In contrast, gold’s market has naturally spread out over centuries of global trade. 🌍📈 This organic distribution reinforces stability and genuine market confidence.
4/ Liquidity, Custody & Security
🔹 Gold Is Easy to Custody
Gold is already stored securely in banks and reputable vaults all over the world, and its ownership transfers digitally. You can withdraw or trade anytime without relying on untrustworthy crypto exchanges or wallets vulnerable to hacks . 🔓💼 Meanwhile, Bitcoin’s security is often subject to risks and platform issues.
5/ Real-World Utility vs. Speculative Hype
Gold isn’t just an asset—it’s a workhorse! ⚙️ From use in electronics to medicine and aerospace, gold’s real-world applications generate organic demand. No aggressive, 24/7 hype machine is needed here. In contrast, Bitcoin runs on media-fueled life support, with bots and influencers relentlessly (and tediously) pushing its narrative . 😴📢
6/ Stability You Can Count On
Gold has weathered economic storms with calm resilience 🌪️➡️☀️, proving itself as the ultimate safe haven. Bitcoin, however, is notorious for its wild 80%+ price crashes, making it a volatile bet for long-term wealth preservation. 🏛️💚
7/ Finite Supply: Strength or Vulnerability?
Bitcoin’s fixed supply is often touted as a key advantage. Yet this scarcity makes it vulnerable to manipulation by a few major holders. 😬 Gold, on the other hand, sees a natural and gradual expansion through mining, ensuring a balanced, organic market flow. ⚖️🌿
8/ Institutional Adoption: Not the Magic Fix
State and corporate Bitcoin deals are usually quiet, behind-the-scenes OTC transactions that rarely impact open market prices. 🤫 Gold’s widespread institutional acceptance is built on centuries of trust and real-world use—no constant screaming into the void required. 📣🚫
9/ Gold: No Need for Hype, Just Legacy
Gold stands proudly without the constant need for promotion. 🌟 Its legacy of stability, digital adaptability, and secure custody speaks volumes. Bitcoin, burdened by relentless crypto spam and hype, can only watch from the sidelines. 🎭🗣️
10/ Invest in Timeless Security
When it comes to long-term wealth preservation, gold is your steadfast asset. It offers proven security, with both digital tokenization and secure physical storage, ensuring smooth withdrawals and trades every step of the way. 🏦🔐 Bitcoin, by contrast, survives on a steady diet of media noise and desperate promotions. 🚑🤖
Gold remains the reliable, time-tested choice in today’s fast-paced world of trends and fleeting hype. Whether you’re safeguarding your wealth or seeking an asset that seamlessly bridges digital innovation with physical security, gold’s enduring legacy is the real deal. 🌟💎
If you’d like to explore how tokenized gold is revolutionizing traditional finance or uncover more about its industrial applications and secure custody mechanisms, there’s always another layer of brilliance waiting to be discovered. 🚀🔍
TVC:GOLD TVC:SILVER INDEX:BTCUSD NASDAQ:MSTR NASDAQ:MARA NASDAQ:COIN CRYPTO:BTCUSD CRYPTOCAP:BTC.D
