TURBO long-term outlookAfter completing its first cycle TURBO seems to stabilize around the 0.0010-0.0020$ region which marks the last ATH from 2023. What's interesting here is that TURBO follows the DOGE coin pattern levels almost to a T, in speedrun mode. It is absolutely not the same structure but it respects the same trading ranges and shows a lot of similarities, which is quite remarkable.
Watch out for this yearly trendline in the TURBO chart and expect some volatility for the next months. Breaking under 0.0010$ could potentially confirm a longer downtrend if we don't see a big impulsive bounce to the upside in the near future.
S-COIN

Coin geometry 3 hours chart going up in whilethis is slight update to the previous video about coin
it will continuum down in the channel for while
then rally up for long term traders

KANGO TO THE MOON! TECHNICAL ANALYSIS🔸 Chart Pattern: Falling Wedge Formation
KANGO has been trading inside a well-defined falling wedge, a classic bullish reversal pattern that often signals a potential breakout after sustained downtrend pressure. The price is nearing the apex and has started to show signs of bullish momentum, testing the upper resistance of the wedge.
🔸 Key Technical Highlights:
Support Zone: 0.00001200 – 0.00001800 USDT
Resistance Zone: 0.00010000 – 0.00018000 USDT
Breakout Trigger: A confirmed breakout above 0.00002000 USDT with volume confirmation
🔸 Indicators:
VMC Cipher B: Bullish divergence detected, momentum turning green, indicating hidden buyer strength
RSI (14): 45.43 and climbing – neutral territory, leaving room for a strong upward move
MFI (Money Flow Index): Currently at 56, suggesting renewed accumulation and capital inflow
Stochastic RSI: Oversold (~20), pointing to an imminent bullish crossover
🔸 Volume Analysis:
A visible volume squeeze is occurring; a spike in volume could catalyze a breakout and rapid price appreciation.
🚀 KANGO TO THE MOON 🔥
🎯 Falling wedge pattern? Check. Bullish divergence? Check. Meme coin magic? DOUBLE CHECK.
KANGO is locked, loaded, and ready to blast off! After months of consolidation, it's tightening the coil inside a textbook falling wedge, and the breakout zone is just a breath away. With bullish momentum building and the community revving up, all eyes are on KANGO to flip resistance into launch fuel. 🌕🚀
From stealth mode to beast mode – the KANGO ROCKET is warming up.
📈 Eyes on the 0.00002000 zone – a clean break here and it’s liftoff time!
🔥 If you're not strapped in yet, this might be your final boarding call.
👉 KANGO isn't just a meme. It's a MOVEMENT.

MUBARAKUSDT Hourly Technical AnalysisMUBARAKUSDT Hourly Technical Analysis
Mubarak Meme Coin has shown a positive breakout in the 1-hour technical analysis, breaking above the 0.13552 resistance level. Currently, it has broken above the 0.15057 resistance and surged up to 0.16595 resistance, increasing the risk of potential profit-taking sales. If profit-taking occurs, a pullback towards the 21-day price average (around 0.45057) may happen. Indicators are at peak levels, and slight downward movements in a partially negative direction can be observed.
Changpeng Zhao (CZ) still supports this coin. A vote is currently ongoing for its listing on Binance, and the results will be announced soon. This movement is creating a positive sentiment for now. If the listing vote results are positive, it could positively impact the price.
NOT INVESTMENT ADVICE.
The information, comments, and recommendations provided here do not constitute investment advice. Investment advisory services are offered within the framework of an agreement between clients and brokerage firms, portfolio management companies, and non-deposit banks. The content on this page reflects only personal opinions. These views may not be suitable for your financial situation, risk tolerance, or return preferences. Therefore, investments should not be made based on the information and writings on this page.
To avoid missing our analyses of both positive and risky technical indicators, follow us and like our content—we would appreciate it!

NILUSDT Hourly Technical AnalysisNILUSDT Hourly Technical Analysis
Nillion Coin is experiencing selling pressure below the 21-day moving average in the 1-hour technical analysis. Currently, it is trying to recover after forming support at 0.5441. The decline in Bitcoin has also affected Nillion Coin. Indicators are partially positive and moving in a neutral position. For NILUSDT to recover, it needs to break above the 21-day moving average and surpass resistance levels.
NOT INVESTMENT ADVICE.
The information, comments, and recommendations provided here do not constitute investment advice. Investment advisory services are offered within the framework of an investment advisory agreement signed between investors and brokerage firms, portfolio management companies, or non-deposit banks. The opinions expressed on this page are solely personal views. These views may not be suitable for your financial situation, risk tolerance, or return preferences. Therefore, no investment decisions should be made based on the information and statements provided on this page.
To stay updated on our analyses, whether positive or risky based on technical indicators, we would appreciate it if you follow and like us.

Worldcoin $WLD Child Sam Altman (CEO of OpenAI) Worldcoin Project Analysis
Worldcoin is a cryptocurrency aimed at providing secure global economic access through innovative technology, primarily utilizing iris biometric identification. Co-founded by Sam Altman(CEO of OpenAI) , the project merges AI, blockchain, and decentralized finance for identity verification and equitable economic participation.
Key Innovations
Iris Biometric Technology : Unique method of online identity verification, addressing identity fraud concerns.
Layer 2 Ethereum Solution : Enhances transaction speed and security within the crypto landscape.
World ID and Orb: Users get a digital identity with unique IrisHash, promoting human verification against systems designed to prevent Sybil attacks.
Market Forecasts
Long-term Growth Potential: Analysts suggest potential price increases, a maximum of $6$, until the end of 2025
Current Market Condition: Despite innovations, Worldcoin’s WLD token is trading at an all-time low, emphasizing market volatility.
Regulatory Challenges
Privacy Concerns: Investigated in multiple countries for data protection, raising ethical questions regarding biometric data usage.
I mpact on Market Launch: Ongoing regulatory scrutiny may delay the global rollout, particularly in the US.
Investment Outlook
Pros:
- Innovative approach offers unique value in the crypto space.
- Significant token allocation for community support adoption.
- Focus on security enhancements and compliance could improve market perception.
Cons:
-Regulatory investigations may impact growth and trust.
-Current low market performance showcases potential investor skepticism.
-Ethical concerns surrounding biometric data handling may deter users.
Conclusion: Worldcoin holds significant long-term growth potential due to its innovative identity verification technology and economic paradigm shift towards equitable participation. However, market conditions, regulatory challenges, and privacy concerns pose serious investor risks. Monitoring regulations and technological developments will be crucial for potential investors in navigating this complex landscape.
Best regards EXCAVO

MUBARAKUSDT Hourly Technical AnalysisMUBARAKUSDT Hourly Technical Analysis
In the 1-hour technical analysis of the newly listed Mubarak Meme Coin, it is moving at the same level as the 21-day price average. Indicators are positive, and the price is consolidating in a sideways range, fluctuating between 0.130 - 0.150.
This meme coin is supported by CZ and is currently undergoing a voting process on Binance. CZ has shown his support for this meme coin by wearing the traditional Arab outfit featured in the coin's symbol in his social media posts. In short, since MUBARAK coin has a potential chance of getting listed on Binance in the future, the probability of positive price movements is high.
THIS IS NOT INVESTMENT ADVICE.
The information, comments, and recommendations provided here do not constitute investment advice. Investment advisory services are offered within the framework of an investment advisory agreement signed between the investor and brokerage firms, portfolio management companies, or non-deposit banks. The content on this page reflects only personal opinions and may not be suitable for your financial situation, risk tolerance, or return expectations. Therefore, no investment decisions should be made based on the information and statements provided here.
To stay updated on our analyses with both positive and risky technical indicators, please follow and like our page. Your support is greatly appreciated!

PIUSDT Daily Technical AnalysisPIUSDT Daily Technical Analysis
Pi Network Coin indicators are NEGATIVE. The selling pressure on Pi Coin is still ongoing. Indicators are at a low position but still appear negative. If it can move sideways above the 0.92957 support level, the chances of recovery in the coming days may increase. The 0.92957 - 0.858 price levels are important support points.
It seems that the Pi Network team is somewhat weak in social communication. The applications created on the platform are still inactive, and the KYC period for users who joined before the Mainnet has now expired. There has been no explanation regarding the coins removed from accounts, or at least, we haven't seen one. In fact, no statement has been made on their YouTube channel either. If the coin does not break below these support levels, it could create a buying opportunity for positive price movements in the future. There is currently no clear information, so we will see how things develop.
NOT INVESTMENT ADVICE.
The information, comments, and recommendations provided here do not constitute investment advice. Investment advisory services are offered within the framework of an agreement between clients and brokerage firms, portfolio management companies, and non-deposit banks. The content on this page reflects only personal opinions. These views may not be suitable for your financial situation, risk tolerance, or return preferences. Therefore, investments should not be made based on the information and writings on this page.
To avoid missing our analyses of both positive and risky technical indicators, follow us and like our content—we would appreciate it!

PIUSDT Hourly Technical AnalysisPIUSDT Hourly Technical Analysis
In the 1-hour technical analysis of Pi Network Coin, the selling pressure continues as it failed to break the 1.21 resistance. The price has dropped to the 1.0770 support level. If this support is also broken downward, the next support levels are 1.031 - 1.010. Our current expectation is negative. Next week, we may shift to daily technical analysis since daily technical data is also becoming clearer. However, for now, the daily outlook also appears negative. If there are sharp declines, buying at lower prices could create a potential for significant long-term returns.
THIS IS NOT INVESTMENT ADVICE.
The information, comments, and recommendations provided here do not constitute investment advice. Investment advisory services are provided within the framework of an investment advisory agreement signed between the investor and brokerage firms, portfolio management companies, or non-deposit banks. The content on this page reflects only personal opinions and may not be suitable for your financial situation, risk tolerance, or return expectations. Therefore, no investment decisions should be made based on the information and statements provided here.
To stay updated on our analyses with both positive and risky technical indicators, please follow and like our page. Your support is greatly appreciated!

COINBASE This is the time to buy and target $400Coinbase Global (COIN) has been trading within a Channel Up pattern since the March 25 2024 High, so effectively a whole year. In the past 10 days it has been consolidating on top of the 1W MA100 (red trend-line), which is the natural long-term Support of the market.
During the same time it entered the Mayer Multiple Bands (MMB) Buy Zone, consisting of the 3 SD (green trend-line) and 2 SD (blue trend-line) below levels, which has given the ultimate buy signals since the January 2023 market bottom. Practically, the stock is consolidating within the 2 SD below and 1W MA100, a tight buy range.
Given the symmetry of the Channel Down Bearish Legs (both -48.39%), we expect a similar symmetry on its Bullish Legs too. Since the previous one reached the 1.236 Fibonacci extension, we are confidently targeting $400 before this Cycle tops. That would also make a perfect entry within the MMB Sell Zone that consists of the Mean MM (black trend-line) and 1 SD above (grey trend-line).
Notice also how the 1W RSI touched the Support of the September 06 2024 Low.
-------------------------------------------------------------------------------
** Please LIKE 👍, FOLLOW ✅, SHARE 🙌 and COMMENT ✍ if you enjoy this idea! Also share your ideas and charts in the comments section below! This is best way to keep it relevant, support us, keep the content here free and allow the idea to reach as many people as possible. **
-------------------------------------------------------------------------------
💸💸💸💸💸💸
👇 👇 👇 👇 👇 👇

$TRUMP ─ @realDonaldTrump Long Trade SETUP$TRUMP ─ @realDonaldTrump Long Trade SETUP 👀
Looking for another long trade entry.
⚠️If the Twin OB fails, then a new low is on the table.
ENTRY = TwinOB + FibFan + nPOC + Fib Golden Pocket + WO + DO
SL = below VAL + TwinOB
------------
------------
As always, my play is:
✅ 50% out at TP1
✅ Move SL to entry
✅ Pre-set the rest of the position across remaining TPs
It's important to take profits along the way and not turn a winning trade into a losing trade.

the Head and Shoulders of the Month!Hello TradingView Family / Fellow Traders. This is Richard, also known as theSignalyst.
📈 This week, XRP rejected the $2 support level and has been trading higher.
Today, XRP formed an inverse head and shoulders pattern and broke its green neckline upward.
🏹 As long as the bulls hold, a movement towards the upper bound of the falling red channel would be expected.
📚 Always follow your trading plan regarding entry, risk management, and trade management.
Good luck!
All Strategies Are Good; If Managed Properly!
~Rich

#ZECUSDT #1D (Binance Futures) Descending channel breakoutZcash broke-out printing a morning star, looks good for recovery towards 100EMA resistance.
⚡️⚡️ #ZEC/USDT ⚡️⚡️
Exchanges: Binance Futures
Signal Type: Regular (Long)
Leverage: Isolated (2.0X)
Amount: 5.9%
Current Price:
36.12
Entry Zone:
36.05 - 33.55
Take-Profit Targets:
1) 41.83
1) 47.12
1) 52.42
Stop Targets:
1) 28.92
Published By: @Zblaba
SEED_DONKEYDAN_MARKET_CAP:ZEC BINANCE:ZECUSDT.P #1D #Zcash #Privacy z.cash
Risk/Reward= 1:1.2 | 1:2.1 | 1:3.0
Expected Profit= +40.4% | +70.8% | +101.3%
Possible Loss= -33.8%
Estimated Gaintime= 1-2 months

$SPY Short Term Bullish atm.. idea for BullsWell... seeing is we hit my target, I thought I might bless the Bulls with a little bit of Eye Candy.... This is what you want...
The Fib breakdown of the Golden Pocket above at the 1.61... we hit the retracement... and now back to the .78
We hold here and it can get bullish quick.
Bearish Path in Next post... otherwise we make a lower high and fall to $525 and fast.

TOTAL Marketcap at important support?Upcoming period could be more positive?
Many cryptocurrency dominance charts, as well as Nasdaq and stock charts too, showing the same pattern. Is the reversal starting?
We’ll see.
This is not investment advice. Please do your own research.
Wishing you best.
-YusufDeli

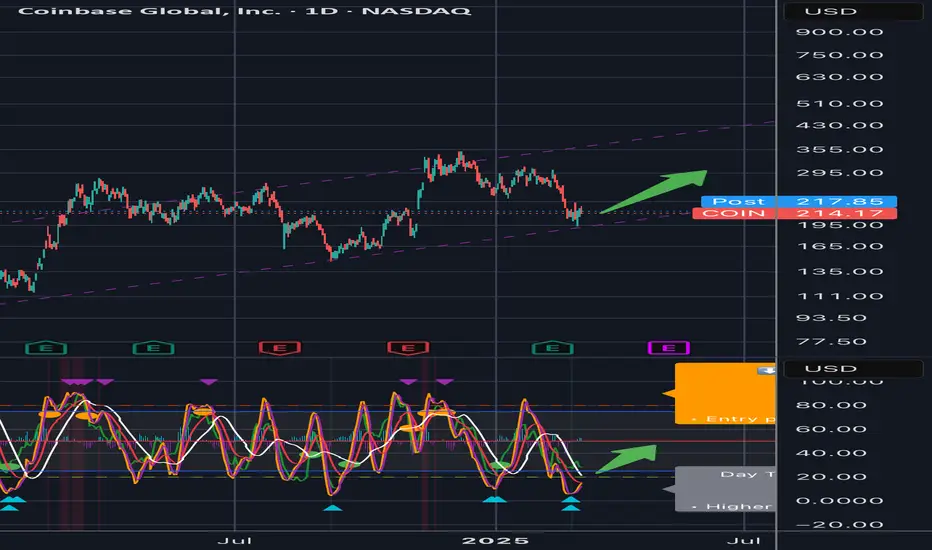
Seems that a bounce may take place soonFrom the chart of COIN, it is near the long-term upward supporting trendline. A bounce may take place soon. Based on its trading range, it may head toward US$250 if this support trendline manages to hold its ground.

Bottom is in IMHO - Long term bullish COIN game plan # **Coinbase (COIN) – Technical Analysis**
## **Current Market Overview**
- **Price:** $214.17
- **Trend:** Bullish within an **ascending channel**
- **Support Zone:** $200 - $205 (Trendline Support)
- **Resistance Levels:**
- **Short-Term:** $230 - $240
- **Mid-Term:** $270
- **Long-Term:** $300+
---
## **Chart Patterns & Indicators**
### **1. Ascending Channel**
- Price is **respecting the lower trendline**, indicating a potential bounce.
- **Holding above the trendline** supports a continuation towards $270+.
### **2. Stochastic RSI – Oversold**
- Deeply oversold **(below 20)**, signaling potential upward momentum.
- Historically, price has bounced after hitting this level.
### **3. Volume & Confirmation**
- Need a **break above $230 with volume** to confirm upside strength.
---
## **Trade Plan & Price Targets**
### **Short-Term (1-2 weeks)**
- **Bias:** Bullish
- **Entry Zone:** $210 - $215
- **Stop Loss:** Below $200 (trendline break invalidates setup)
- **Target 1:** $230 (resistance level)
- **Target 2:** $240 (next key level)
### **Near-Term (1-3 months)**
- **Bias:** Bullish
- **Price Target:** $270 (upper range of channel)
- **Risk:** Medium (watch for rejection at $230)
### **Long-Term (6-12 months)**
- **Bias:** Strongly Bullish
- **Target 1:** $300 (upper trendline resistance)
- **Target 2:** $350+ (breakout scenario)
---
## **Risk Considerations**
- A **break below $200 invalidates** the setup.
- Macro conditions and crypto market correlation **impact price action**.
---
### **Final Thesis**
✅ **Bullish continuation likely if price holds $205-$210.**
🚀 **Breakout above $230 needed for strong upward momentum.**
⚠️ **Break below $200 = potential trend shift, bearish risk.**
COINBASE: Reached the bottom of the 1 year Channel Up.Coinbase is bearish on its 1D technical outlook (RSI = 39.040, MACD = -17.200, ADX = 47.118) and has hit the bottom of its 1 year Channel Up following a 4H Death Cross. This is typically seen at the end of downtrends and with the 4H RSI already rebounding after turning oversold, we technically have the best buy opportunity since September 6th 2024. The trade is long, TP = 395.00.
## If you like our free content follow our profile to get more daily ideas. ##
## Comments and likes are greatly appreciated. ##

THE CLV WHALES BREAK..THE CLV WHALES BREAK..
CLV interesting for new voluume
Always manage the risk since it has shown an increased trend of 60% to risky to enter directly with no plan.
There is high chance this coin can break up $0,10 coming time

Bitcoin (BTC/USD) Technical Analysis & Trading PlanBitcoin (BTC/USD) Technical Analysis & Trading Plan – February 28, 2025
Market Overview
The Bitcoin (BTC/USD) price is currently trading at $79,770, showing a -0.74% decline in the latest 4-hour candlestick. The chart illustrates a falling wedge trading pattern, which is considered a bullish reversal signal. The price is approaching the lower boundary of the wedge, signaling a potential breakout to the upside.
Technical Indicators & Key Observations
Falling Wedge Pattern:
The price has been making lower highs and lower lows within a falling wedge formation (red and green trendlines).
A breakout above the upper boundary of the wedge could trigger a strong bullish rally.
Support and Resistance Levels:
Immediate support: $76,665
Major support: $67,679
Key resistance levels:
$88,671
$91,271
$95,497
$108,329 (Major long-term resistance)
Momentum Indicators:
RSI (Relative Strength Index): 22.26 (oversold), indicating potential upward momentum.
Stochastic Oscillator: 16.14, also in the oversold region, confirming a possible reversal.
Money Flow Index (MFI): Showing weak inflow, but a reversal at these levels could indicate increasing buying pressure.
Cipher_B Divergences: Potential bullish divergence forming, adding confluence to the breakout scenario.
Professional Trading Plan
Entry Strategy
Aggressive Entry: If Bitcoin closes a 4-hour candle above the wedge's upper trendline (~$80,500), an early entry can be considered.
Conservative Entry: Wait for confirmation above the $82,000 level with strong volume before entering a long position.
Profit Targets
First Target: $88,671 (previous local high)
Second Target: $91,271 (psychological level)
Third Target: $95,497 (strong resistance)
Ultimate Target: $108,329 (major long-term resistance)
Stop-Loss Strategy
For aggressive traders: Below $76,500 (recent low)
For conservative traders: Below $74,000 to reduce risk exposure
Risk Management
Risk-to-reward ratio: 1:3 or higher (entry should be calculated to maintain proper risk-reward)
Position Sizing: Allocate 2-5% of capital to this trade, considering volatility.
Conclusion
Bitcoin is currently trading at a critical support level within a falling wedge. The RSI, Stochastic, and MFI indicators suggest oversold conditions, indicating a potential bullish breakout. Traders should watch for a confirmed breakout above the wedge with strong volume before entering a position. Targets remain between $88,000 and $108,000, with well-defined stop-loss levels to minimize risk.
💡 Recommendation: Monitor price action closely, especially in the next few 4-hour candles. If BTC breaks above the wedge, prepare for a bullish move towards resistance levels.

Revised COIN price targets - the blood is on the streets
ByBit exogenous news is wildcard so we’ve broken down support as all hell broke loose.
Here is the revised outlook of the trading plan:
Trading Plan Based on Risk Appetite
Aggressive Trader (Short-Term)
• Long Entry: $234-$236 (oversold conditions).
• Stop-Loss: Below $230.
• Target: $248-$252.
Swing Trader (1-2 Weeks)
• Long Entry: On confirmation above $248.
• Stop-Loss: Below $234.
• Target: $263-$272.
Investor (Long-Term)
• Buy Range: Accumulate in dips between $220-$234.
• Target: $280-$310 in a bullish case.
Conclusion
• COIN has broken key support levels but is now in a critical demand zone ($234-$236).
• The next 24-48 hours will be crucial—if price stabilizes, we may see a bounce.
• A further breakdown below $234 opens the door to $220.
• A reclaim of $252-$263 will confirm a short-term bullish reversal.

Coinbase shortterm bounce opportunity This is beaten down. So much so, that it’s beaten down on many time frames. In my book it’s a contrarian opportunity here. My indicator tells me the same.
The COIN stock is showing oversold conditions based on momentum indicators.
• The 3H chart suggests a potential reversal or at least a short-term relief bounce.
Timeframe Analysis
Short-Term (3H - Intraday to Few Days)
• Current Price Action:
• Price is hovering above a strong liquidity zone near $246-$250.
• The stochastic-based oscillator at the bottom is in the oversold region with blue triangles indicating potential buying interest.
• Previous Break of Structure (BoS) & Change of Character (CHoCH) events confirm short-term trend shifts.
Key Levels to Watch:
• Resistance: $270 (previous rejection), $280-$285 (key range high).
• Support: $246-$250 (buying zone); a break below could send it toward $234.
• Short-Term Probabilities:
• Bounce to $270: ~60% chance if support holds. [
• Break below $246: ~40% chance leading to $234-$236.

BITCOIN SWING LONG|
✅BITCOIN is going down
To retest a very strong wide
Horizontal support level
Around 90,000$ and as we
Are bullish biased on the coin
We will be expecting a
Further bullish move up
LONG🚀
✅Like and subscribe to never miss a new idea!✅
