Decisive Breakout | Altcoins Will Indeed Grow On This DropThe question always is, "Will the altcoins grow this time around when Bitcoin drops?"
Curve (CRVBTC) provides the answer.
Today Bitcoin becomes shaky and look at the CRVBTC chart... We have a very strong and decisive bullish breakout with prices moving above EMA50 today.
We also have really high volume and very strong RSI...
Many, many more of the Altcoins vs Bitcoin (ALTSBTC) pairs are looking the same.
The altcoins will grow as Bitcoin prints its retrace... This is also a bullish signal for Bitcoin.
Namaste.
S-curve

Long CRV HereCRV formed a double bottom pattern and seems started a new uptrend that can achieve profit targets. Consider that CRV/USDT goes above its 100 daily moving average which is another sign of growth.

CRV/USDT - Curve DAO- Incoming pump? Keeping a close eye on CRV after finally bucking the trend and holding new support.
It's only early days but could be flipping bullish (finally)
Next 24 hrs will prove crucial in determining whether we see a surge or further rejection.
A push through indicated levels will see us targeting approx 38% with this position.
Caution advised as BTC continues to create ATH's.
As always not financial advice, just thoughts and TA.
Constructive feedback Welcomed.
Happy Trading.
Bingaz.


CRV round bottom with iSHS could bring a x10Here I share you this idea
It seems extreme, because it is.
Enter slowly and wait some weeks, we will have results.
All the information is in the chart.
Cheers!

Parabolic Curve Pattern, CAurve of the Trend Conqueror SectionWhat Is the Pattern of a Parabolic Curve ?
The Parabolic Curve pattern is a curved line pattern that is formed by following a candlestick formation when prices rise or decline rapidly. Visually, the curved line pattern follows the correction points. The lay language, when the price forms a pattern like a staircase, the curved line follows the base on the steps.
Parabolic Curve patterns are generally found when the market is in panic-buying or panic-selling conditions . That is, the price moves to one direction in a short time because it is driven by the dominance of the seller or buyer. In these conditions, the opportunity to gain profits is wide open, especially when the price moves to break through the curved line pattern.
In essence, the pattern of Parabolic Curve indicates the point where prices will begin to approach saturation (overbought or oversold). If the price has touched its saturation point, the price opportunity to reverse direction will be even greate
Price climb very fast in a very short period. Chart gradient is more than 45 degree when you zoom out the chart by expanding the time frame.
When the chart breakdown, the stock price plunges close to 50% Fibonacci Retracement Level within one or two months
Did you Get Burnt?
The Parabolic Curve Pattern Strategy usually does occur during sharp economy motions. Industry speculation which becoming ahead of itself leads These kinds of movements. Traders usually find themselves front-running an occasion. So one of many public ways to recognize a more parabolic curve blueprint is that the period beforehand of the big event.
How Can You Make Money With a Curved Line Pattern?
Trading strategies using the Parabolic Curve pattern are quite simple. No complicated calculations or combinations of indicators are needed to improve the accuracy of trading signals.
The emphasis of the accuracy of trading signals on the Parabolic Curve pattern lies in the trader's skills in identifying market dynamics through price action charts. Following are the practical steps:
Look for currency pairs or other assets whose trend movements are strong; note the price movements in the pair whose price movements have a slope of more than or equal to 45 degrees to one direction and tiered like a ladder.
Use the trading tool to draw curve lines; some trading platforms provide a built-in Parabolic Curve tool, for example tradingview. As for MT4, you can still use the help of an ellipse curved line pattern instead of the curve.
Pay attention to price movements through candlesticks; if the body of the candlestick appears to break the curved line pattern, the price will have the potential to reverse direction from the previous trend.
Open Position with Money Management. After the trading signal appears to open a position, use the basic money management rules such as the percentage of capital and the Risk / Reward Ratio so that the risk of each position can be controlled.
You can make fast money by riding on Parabolic Curve but you must know when to get out.
The above three charts start crossing down the 20D MA, that is the 1st signal to get out. When crossing 50D MA, that is the 2nd signal to take profit or cut loss.
When trading with Parabolic Curve, must keep an very close eye on the chart pattern every day.

BTC to pamp back into curve??I rebuilt my exactly old curve to look if BTC will do something with it. If so, it might go very very high, but take care to trade it frend and better be ready!
#doggonacci

Curve (CRV) Strong Consolidation, Volume Increases (Over 800%)Curve (CRVBTC) is now showing what we call "strong/bullish consolidation"... We get consecutive green candles as prices move up.
We have really strong indicators with increasing volume.
This is all signaling what we are seeing from other altcoins and trading pairs.
CRVBTC is ready to jump... Additional details on the chart.
Namaste.

CRV Possibility 100% to 400% JUMP - CURVE CRVBTC CRVUSDT CRVUSDCRV Possibility 100% to 400% JUMP - CURVE CRVBTC CRVUSDT CRVUSD

CURVE CRVUSDT TA CUP AND HANDLE FORMATION! BULLISH!CURVE CRVUSDT TA CUP AND HANDLE FORMATION! BULLISH!
Cup and Handle forming!
Feel free to like and follow if you like my TA!
For those asking what indicator is the bottom, it is MC.
Here is the link to purchase: marketciphertrading.com
Ref code: cryptoyew749


Most Conservative BTC Log Curve (Swiss Rex Model)My most conservative logarithmic regression, representing the logarithmic "support" of BTC price, based on the Swiss Rex Model (twitter, @SwissRexAG). Still a better long-term investment than stonks and bonds!

My Conservative BTC log curveAdjusted parameters for a more conservative, less optimistic, log curve.

CRV - Intro:
Launched in Jan 2020, Curve is a blockchain-based platform for exchanging Ether-based stablecoins safely and securely. Michael Egorov, the founder of the protocol, recently told DeFi Prime that Curve is “an exchange expressly designed for stablecoins and Bitcoin tokens on Ethereum.” - medium.com
Curve is one of the most interesting DeFi products to enter the space. With its groundbreaking approaches like the AMM algorithm to provide liquidity, and it’s successful avoidance of the impermanent loss problem, Curve is a project set for greater heights.
Curve Finance began as a crypto swapping platform, offering traders low slippage trades across major stable coins. The team behind Curve are far from newcomers: Its founder continues to work on NuCypher, an encryption protocol for smart contracts
Curve Finance began as one of the most efficient stable coin swapping protocols in DeFi. Now, with a governance token in the works, it has become one of the most popular projects in the space. Following the launch of various tokens like COMP, BAL, and YFI, DeFiers are eager to get their hands on Curve’s CRV token.
Above-average institutional (managed money) sized volume around .45-.55 so far. CURVE HAS FOUND A BID!! WOoAAAAH!!

BUY CRV - at support w/ institutional volume, lots of upside !!Important Defi Project - BUY CRV - Institutional Volume - lots of upside

BTCUSD - RSI showing bearish divergence?Hi everyone,
Today I decided to go for a TA on BTCUSD mainly because of all the hype lately of BTC hitting 13K and going past that.
Here are the highlights:
- So far BTC has been bullish since the COVID-19 crash halfway of march 2020. (Blue ascending channel). (bullish sign)
- BTC got a nice boost of the support area around 10K-10.5K which made the jump to 13K possible (bullish sign)
- RSI indicates BTC has been overbought three times even though the chart/trend remained bullish. (bearish sign)
- The RSI also indicates that de the tops are at the same height en even slightly declining while the chart/trend remains going up. Indicating a reversal trend (bearish sign).
- The yellow dotted line shows a curve in which the trend slowing down pointing downards as well (bearish sign)
- As our current position is now between 13K and 14K we could be getting heavy resistance because of the earlier resistance from halfway june 2019 (bearish sign)
For now I'm betting my chances that BTC could drop down to 12K-10K, because of the hidden bearish signs. After that somewhere in Q1 2021 a new strong bullish trend continues. For know I stay neutral until future trends confirm otherwise.
Trade safe, stay safe!
______________________________________________________________________________________________________
I'm purely a beginner in technical analysis. Let me know what you thinnk about my analysis and hit like or a follow if you like my ideas.
Feel free to comment or share your own analysis, I would gladly share thoughts with you.
Any of your feedback is my motivation to keep going and to learn more about Technical Analysis!

LINKBTC BreakoutPossibility of LINKBTC breaking out through previous highs. Higher lows may suggest an uptrend.

XMRBTC BreakoutSeems like XMRBTC may go up after breaking out through the previous highs. Higher lows can indicate a new trend.

ZECBTC BreakoutThere is a possibility of ZECBTC breaking out through previous high, also creating a parabolic curve. Higher lows may suggest a new trend.


DOTBTC BreakoutThere is a chance of DOTBTC breaking out through previous highs. We can observe higher lows creating a curve, which can be an indicator of a new trend.

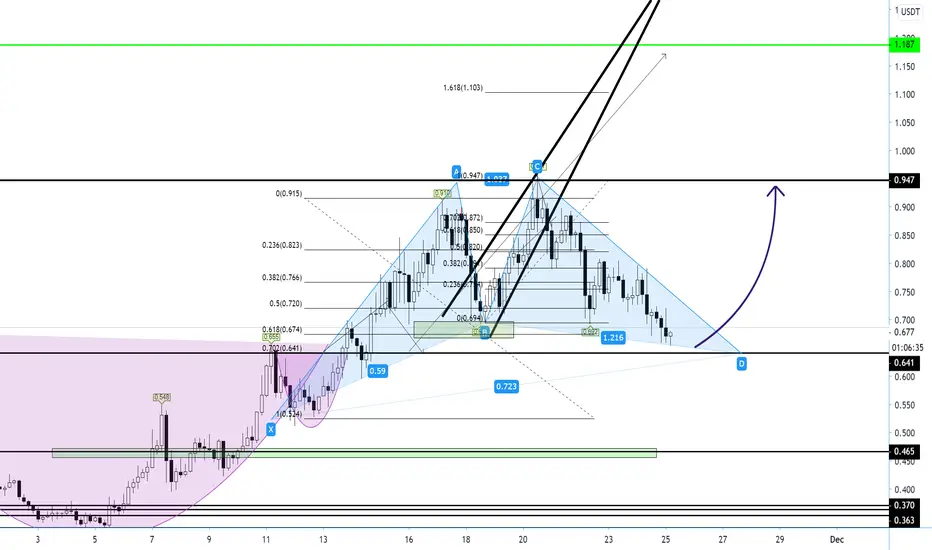
CRV.USDT (Y20.P4.E2). Macro.time to go longHi All,
*** This is a continuation from the previous post, link supplied below. ***
This Defi could have hit rock bottom and looking at the MACD against price, and the other indicators on the 12 HLRY and Daily, we have a significant bullish divergence.
Since I have the RSI crossed over on the DAILY for the Phoeix, and the Stoch., its extra confirmation we are good to go one would think.
Curve DAO token coin has big potential, along with other DeFi coins that have been locked up.
Regards,
S.SAri
DAILY Chart
PREVIOUS POST
