$XRP Historic Breakout IncomingIn all the years I've been trading cryptocurrency, I've never encountered a bull flag that has been forming for a full seven years. Such a phenomenon is virtually unprecedented and could herald one of the most monumental and historically significant breakouts in the crypto market.
We may be standing on the threshold of an event that will not only attract the attention of the entire financial world, but may also set an entirely new development vector for the entire crypto industry. This pattern is already starting to break through, this could be the moment that changes everything, opening a new era in the world of digital assets.
S-XRP

XRP Falling Channel Breakout!!! (Bullish)First time since July 2023 that XRP has finally broken to the upside outside the Descending Channel Pattern.
🔴Key Resistance= $0.85
🟢Major Line of Support= $0.61
🎯Target= $1.00
VELO: $0.022 JedMcs next Big Thing | Think BTC XRP & STELLARgoogle is your friend
and time your best friend in the next 36months ++
good luck and all the best
and remember.. always reserve 60% of capital at any levels when the handler decides
to shake down free riders and liquidate speculators to accommodate new angels whales etc

XRP go up!Hello everyone, let's look at the current situation of XRP considering the time frame of one week. As we can see, the price paid off the trend triangle with a dynamic upward move.
Let's start by setting goals for the near future, which include:
T1 = $0.84
T2 = $0.98
T3 = $1.17
T4= $1.41
Now let's move on to the stop-loss in case the market continues to decline:
SL1= $0.69.
SL2 = $0.54.
SL3 = $0.43.
SL4 = $0.28
Looking at the RSI indicator, we see
that there is still room for price movement
up.

Xrp - This Triangle Wil Double Your Money!Xrp ( BITSTAMP:XRPUSD ) is retesting a major confluence of support:
Click chart above to see the detailed analysis👆🏻
For a couple of years now, Xrp has been trading in a bullish symmetrical triangle pattern. As we are speaking, Xrp is retesting the lower support trendline and also a horizontal support level. It is quite likely, that we will eventually see a breakout above both triangle patterns on Xrp.
Levels to watch: $0.5, $0.6, $1.0
Keep your long term vision,
Philip (BasicTrading)

XRP - Bear Move In SightXPR, since it's positively correlated to BTC, is also about to tank hard. The bull run is almost over.

BITCOIN SELL TO $83,330Looking to short BTC as price action is offering a shift in market structure. Targeting below current Wave 4 for a healthy retracement.
⭕️Wave 3-5 Impulse Move Complete.
⭕️Waiting On 3 Sub-Waves (A,B,C) Correction.
⭕️Overbought Market Conditions.

XRP Aiming for a Major Breakout: Could $1 Be Next?With recent legal and political developments spurring optimism, Ripple's CRYPTOCAP:XRP is attracting substantial market attention and could be on track for a significant rally, potentially reaching $1 or even $1.50. The potential for XRP to reach these new highs stems from a mix of technical indicators, supportive fundamentals, and external market catalysts. Here’s what to watch.
Legal Wins and Potential Tax Exemptions
Pro-XRP lawyer Bill Morgan recently shared insights on a possible price jump to $1, fueled by a series of favorable news for Ripple. Notably, the ongoing lawsuit with the SEC has seen Ripple gaining ground, with a recent court ruling in favor of Ripple and its CEO, Brad Garlinghouse, adding to investor confidence. The looming possibility of a final jurisdictional decision could further benefit XRP’s outlook as it brings the case closer to a potential resolution.
Moreover, former U.S. President Donald Trump's proposed capital gains tax exemption for crypto could significantly boost interest in XRP and other U.S.-based cryptocurrencies like ADA and HBAR. If enacted, such a policy would allow U.S. investors to potentially benefit from gains in cryptocurrencies without facing capital gains taxes. This proposal, alongside Trump’s commitment to make the U.S. the "crypto capital of the world," is helping to buoy the market as investors eye XRP as a promising asset.
Technical Outlook
At the time of writing, CRYPTOCAP:XRP is trading at $0.7122, marking a 3.13% increase within a strong bullish trend. This rally follows a breakout above the $0.71 level, with the next critical resistance zone appearing at $0.89. However, traders should note that the Relative Strength Index (RSI) currently sits at 81.37, signaling an overbought condition. Typically, an RSI above 70 suggests that an asset may be overbought, indicating the possibility of a near-term retracement.
In this case, a short-term pullback to the support level of $0.64 could occur before CRYPTOCAP:XRP resumes its upward momentum. Notably, prominent analyst Dark Defender has also identified a series of price targets, predicting that if XRP can hold above the $0.6649 support and surpass $0.74 again, the path toward $1.03, $1.35, and even $1.5 could open up, potentially by next month.
Conclusion
With a mix of strong fundamental developments and positive technical indicators, XRP's current rally appears well-supported. Investors are eyeing the $1 and $1.5 marks as realistic short-term targets, with broader ambitions for even higher prices in the coming months. However, the overbought RSI suggests caution, as a minor pullback may precede the next surge.
If Ripple’s momentum in the legal battle with the SEC continues, and if Trump’s crypto tax proposal gains traction, CRYPTOCAP:XRP could see substantial capital inflows. For now, traders and investors should watch the $0.64 support and $1.05 resistance as key indicators in this unfolding rally.

Doge and Xrp Analogy.There seems to be an interesting graphic similarity between Doge and Xrp. The Doge chart is like the completed version of Xrp chart. It's a good idea to keep this as a secondary point of view.

XRP Prediction Price Breakout & New All-Time Highs? In this video, we dive into an in-depth analysis of XRP's recent price action and what might be in store for the future. XRP has surpassed our initial price targets, breaking out of previous resistance zones and showing strong momentum. With this bullish move, XRP is now setting up for new, higher price targets, and there's a growing possibility that it could reach or even exceed previous all-time highs!
In today’s analysis, we’ll cover:
- Key support and resistance levels to watch
- How XRP's price expansion aligns with market trends
- Potential targets for XRP as it eyes new highs
👉 Subscribe for more XRP and crypto analysis, and turn on notifications to stay updated on the latest market moves!

XRP LONG AFTER STOPRUNEntry Reasoning: The red zone indicates a "stop hunt" area where liquidity was likely collected after breaking below recent lows. This manipulation phase suggests a reversal and a potential rally as buyers reclaim positions.
Targets:
First Target at around $0.6600 - aligns with a previous structural resistance level.
Final Target at approximately $0.7400 - near a significant high, likely to attract profit-taking and potential resistance.

XRP hits 8-month high, but the selling is comingXRP price recently saw a significant surge, rallying by 40% and reaching an 8-month high. However, the rally appears to be losing momentum, as XRP now faces a potential pullback.
This retreat is largely due to emerging selling signals among investors, signaling a possible shift in sentiment.
On the chart, the overbought RSI indicates that XRP’s bullish momentum may be losing steam, and a price correction could follow. With the current conditions suggesting saturation, XRP’s price may struggle to maintain its recent highs. This technical indicator further confirms that XRP could be at risk of a pullback on the daily chart, likely affecting short-term investor sentiment.
Despite its recent 40% rally, XRP was unable to close above the 8-month resistance level at $0.73. As a result, the altcoin has already faced a 6% decline, signaling a possible correction phase in the near term.
XRP’s next likely support sits at $0.61, a level that has held as support previously. If selling pressure intensifies, however, XRP may fall further to $0.56, signaling deeper corrective action as investors secure profits.
The only way to invalidate the bearish outlook is if XRP reclaims $0.66 as a solid support level. Achieving this would set the stage for another attempt to breach $0.73, potentially renewing bullish momentum for the altcoin.

Don't let a few red Candles shake you out of you #CRYPTOpositions.
You should have had plenty of time to accumulate bluechip #ALTS and #ETHEREUM
Red candles are a blessing this year, if your still positioning yourself for the next Bull run
We will swing wildly between Hope and Despair on the #WallSt cheat llst
Yet the path remains up.
Remember #ETH was sub $900 last June
Maybe the doubters will change their mind after a Triple :)

The key is whether the price can be maintained above 0.6810
Hello, traders.
If you "Follow", you can always get new information quickly.
Please also click "Boost".
Have a nice day today.
-------------------------------------
(XRPUSDT 1W chart)
The point to watch is whether it can break out of the box section and start an upward trend.
-
(1M chart)
If the price is maintained above 0.6810, it is significant because it has succeeded in breaking through the upper point of the box of the HA-Low indicator on the 1M chart.
In other words, it means that it has broken out of the bottom section from a long-term perspective.
Therefore, the key is whether the price can be maintained above 0.6810.
-
(1D chart)
It has risen above the Fibonacci ratio 0.5 (0.7144) that was the target point.
Accordingly, if it receives support near 0.7384 and rises, it is expected to rise to around 0.618 (0.8121).
As I mentioned earlier, if it falls below 0.6810, it is highly likely to enter the box section again in the long term, so you should consider it as a stop loss point and think about a response plan for it.
-
The maximum rise point is expected to be around 1.0409.
--------------------------------------------------
It seems that there is an issue related to the ETF of XRP and SOL.
If the ETF issue is over, there is a high possibility of price adjustment, so you should also think about a response plan for it.
-
Have a good time.
Thank you.
--------------------------------------------------
- Big picture
It is expected that the real uptrend will start after rising above 29K.
The section expected to be touched in the next bull market is 81K-95K.
#BTCUSD 12M
1st: 44234.54
2nd: 61383.23
3rd: 89126.41
101875.70-106275.10 (when overshooting)
4th: 134018.28
151166.97-157451.83 (when overshooting)
5th: 178910.15
These are the points where resistance is likely to be encountered in the future. We need to see if we can break through these points.
We need to see the movement when we touch this section because I think we can create a new trend in the overshooting section.
#BTCUSD 1M
If the major uptrend continues until 2025, it is expected to start by creating a pull back pattern after rising to around 57014.33.
1st: 43833.05
2nd: 32992.55
-----------------

Ripple (XRP)Ripple needs no introduction, an open-source, permissionless and decentralized technology which offer low-cost, speed, scalability and inherently green attributes as well as featuring the first decentralized exchange. Also, Ripple news about legal battle with the SEC increased its popularity; although, the final outcome of these courts battle can determine its long-term direction. Anyway, it can be seen from the chart that XRP loves to make big triangle-shaped pattern, mostly descending ones. And after each ones, XRP's price soared. XRP also broke its last descending triangle pattern and went upward, albeit a little. But it seems for the XRP to soar, we need to wait for the legal battle results. Let's see what happens.

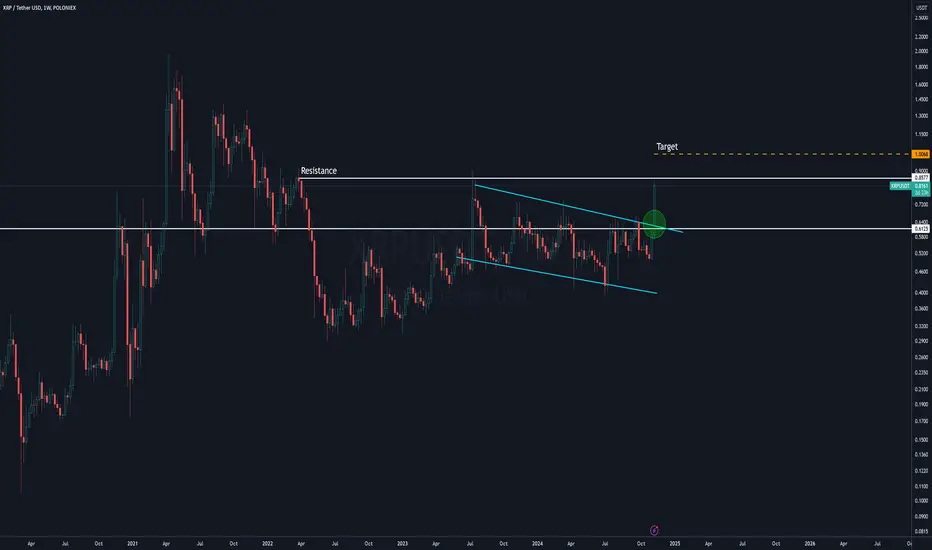
Eyeing $0.80 and $1.00 Targets📊 XRP is approaching a potential breakout from a long-term descending triangle pattern. The current price action is building pressure near the resistance trendline, indicating a possible upward move if a breakout occurs.
🔑 Key Target Levels:
First Target: $0.80 - If XRP breaks above the trendline resistance, the $0.80 level may serve as an initial resistance.
Second Target: $1.00 - A psychological and historical resistance level; a break above $0.80 could push XRP towards this level.
Support Levels:
🔴 Primary Support: Around $0.54 - This level provides strong support if XRP fails to break out and experiences a pullback.
👉🏼 A confirmed breakout above the triangle pattern could lead XRP to test $0.80 initially and then potentially aim for $1.00. However, failure to break above the resistance may lead to a retest of support near $0.54 before another attempt at an upward movement.
Note: This analysis is provided for informational purposes only and should not be taken as a buy or sell signal.

Ugly invh&s on XRPUSD already breaking above the necklineEven though this already now has a sizable candle breaching the neckline of this inv h&s pattern, we must remember that even bigger breaks above invh&snecklines in the past have still found a way to dip back below the neckline, and this candle currently has a decent top wick goin on it as XRP often likes to pull after a pump, so we haven’t validated the breakout of this pattern just yet. However, wanted to post a new updated version of this pattern to show that if we were to validate the breakout here which is a little earlier than where. Arbitrarily placed the measured move line of the breakout on the previous version of this chart, the target would then be slightly higher taking us to around 93-94 cents. Again, no guarantee we won’t find a way to dip back below the neckline here in which case I will ahve to readjust the measured mvoe line lower again but I still out of excitement wanted to post this update considering XRP has been playing it coy the ast few days that bitcoin has been pumping. *not financial advice*

Ugly invh&s on XRPUSD already breaking above the necklineEven though this already now has a sizable candle breaching the neckline of this inv h&s pattern, we must remember that even bigger breaks above invh&snecklines in the past have still found a way to dip back below the neckline, and this candle currently has a decent top wick goin on it as XRP often likes to pull after a pump, so we haven’t validated the breakout of this pattern just yet. However, wanted to post a new updated version of this pattern to show that if we were to validate the breakout here which is a little earlier than where. Arbitrarily placed the measured move line of the breakout on the previous version of this chart, the target would then be slightly higher taking us to around 93-94 cents. Again, no guarantee we won’t find a way to dip back below the neckline here in which case I will ahve to readjust the measured mvoe line lower again but I still out of excitement wanted to post this update considering XRP has been playing it coy the ast few days that bitcoin has been pumping. *not financial advice*

Breakout Structure Daily XRPUSD I'm bullish on XRP on this daily timeframe
Looking for a breakout of this triangle drawn between lows and peaks
The breakout will be aggressive and overdue
BULLISH

Extremely ugly invh&s currently in play on XRPUSDI have placed the measured move/breakout target line rather arbitrarily here. It wouldn’t surprise me if price action had a pullback or correction to reset some of the indicators before actually breaking above the neckline in which case the measured move breakout line(dotted line) would most likely need to be readjusted lower than where I’ve arbitrarily placed it here iin the process lowering the breakout target as well. Always a possibility that it doesn’t correct in between now and reaching the target though in which case we are looking at a target somewhere around 89-93 cents. I know many who only consider bukowski’s textbook version of an inverse head and shoulders to be one will have their skepticism about such an ugly looking example of an inverse head and shoulders, but n my experience it is the ugliest and most asymmetrical examples of inverse head and shoulders patterns that seem to have the highest percentage of being validated and reaching their full breakout targets. *not financial advce*

Bitcoin Just hit New All Time High $77000#Bitcoin is Unstoppable! 🚀
CRYPTOCAP:BTC just hit a new all-time high of $77,000! 🎉
The momentum keeps building as Bitcoin reaches incredible new heights!
Is this the start of the next big bull run?

XRP/USDT 1D ChartHello everyone, let's look at the current situation of XRP in pair with USDT taking into account the one-day time frame. In this situation, we can see the price rebounding from the downtrend line.
Let's start by setting goals for the near future, which include:
T1 = $0.56
T2 = $0.60
T3 = $0.63
T4 = $0.68
Now let's move on to the stop-loss in case the market continues to decline:
SL1 = $0.50
SL2 = $0.47
SL3 = $0.42

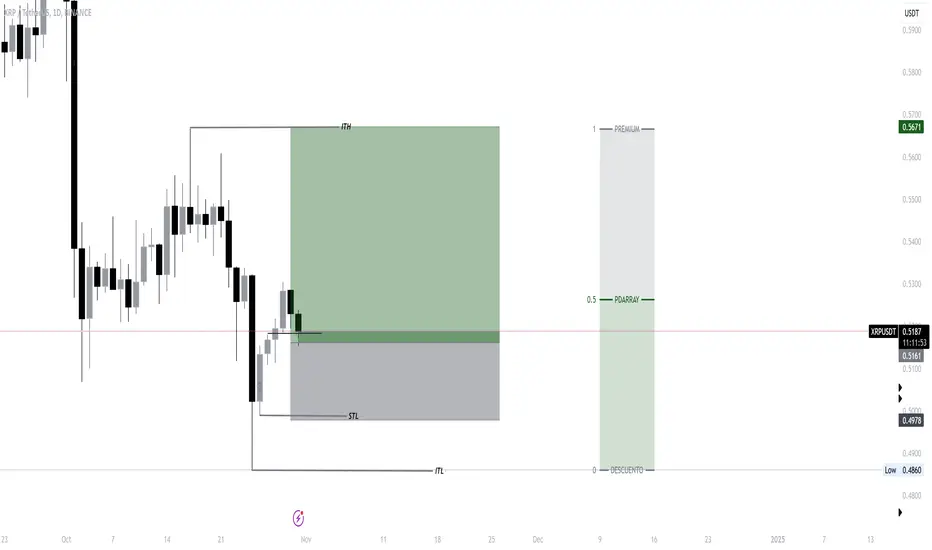
XRP Scalping-Day trading HIGH RISKHigh Risk
BINANCE:XRPUSDT
XRP appears likely to respect the daily bullish FVG (Fair Value Gap), and it's rare to see such setups on this asset. Given this unique opportunity, I’ve decided to enter, aiming to close the trade around the Intermediate Term High (ITH).
This is a straightforward setup: stop-loss placed at the swing low, as a break there could indicate a move to seek liquidity at lower levels. Target profit is set in the premium zone.