GOLD IDEA, XAU/USD Price ForecastGold bulls are meeting critical resistance, all eyes on Fed speakers and Russian diplomacy. XAU/USD, was little changed on Friday, but the trend followers are still engaged with traders seeking safe-haven assets.
XAU/USD Price Forecast: Technical outlook
On Thursday, the non-yielding metal pierced the $1,900 mark for the first time since last June. However, XAU bulls’ failure to record a daily close left the yellow metal subject of a mean reversion move.
On Friday, XAU/USD consolidated in a $14.00 range. Should gold close within the range, a move towards February 15 daily high, resistance/support at $1,879 is on the cards, as XAU bulls prepare for an assault of $1,900. That scenario plays out, XAU/USD first resistance is $1,900.
However The breach of it opens the door towards $1,916, which, once cleared, will expose January 2021 highs at $1,959. However to my opinions i think there a short position to be placed when the price reaches to a strong resistance zone on 1900 region, just wait for confirmation and take trade.. safely
This are just my Assumptions......
Safehaven

Gold Hits Our Target!!Gold has hit our next target of 1905, after smashing through 1895. We saw resistance from 1905, as anticipated, and subsequently retraced slightly. We are currently seeing support just under our previous target of 1895. If we retrace further, we should see support at 1876, then 1865. After such a strong rally in gold, it is reasonable to anticipated a technical retracement. The Kovach OBV is still quite strong, but has started to level off a bit, suggesting we may anticipate a retracement or at least a sideways correction as gold feels out the current value area.

Bonds Attempt to Establish Value Near LowsBonds have picked up from lows, retracing the vacuum zone back to resistance at 126'19, exactly as we had predicted yesterday. The Kovach OBV picked up very slightly, but nowhere near enough to suggest any serious buying momentum. We are seeing resistance from these levels, as anticipated, confirmed by a red triangle on the KRI. It seems likely that ZN may retrace the range again, and find support at 125'17, but if we continue to test higher levels, then 126'18 and 127'01 are the next targets.

Short USDJPYShort opportunity on USDJPY, with trailing stop after 20 pips profit. Risk-off still prevails on the market.

Gold Falls Short of $1836Gold has found resistance at 1836, exactly as we anticipated in these reports. We have since retraced back to support at 1826, the next level down, after testing 1815 and finding support just above this level. Two green triangles on the KRI suggest strong support at 1821 or so. The Kovach OBV was pretty strong, but has leveled off in tandem with gold's top. From here, we are likely to establish value between 1815 and 1836. Note the vacuum zone below 1815 to 1795, which was a previous value area. If support does not hold at current levels we will surely test this value area once again.

AUDJPY | SHORT | Yen the frenShort signal with an entry point at Sell Stop 2/3/2022
Entry
Price: 81.685
SL: 83.475
Risking 0.5% on this trade.
I'm not a financial advisor or 'Guru', if you seek financial advice please find an advisor in your local area.

Gold Breaks Out!!Gold has continued to rally, breaking out from our range between 1795 and 1815. It has hit our profit target of 1826, which we predicted yesterday. We are reaching resistance here, confirmed by a red triangle on the KRI. However, 1815 is providing support as confirmed by a green triangle on the KRI below. If momentum continues, then our next target is 1836 then there is a vacuum zone to 1851. If support does not hold, then we will likely encroach back into the value area between 1795 and 1815. The Kovach OBV has picked up notably, but is currently stalling out, suggesting we will range or retrace from here as gold continues to establish value.

Bonds Test Lower LevelsBonds appeared to be making an effort to attempt higher levels, with a bull wedge pattern forming with an upper bound at 128'10. However, we broke down from this pattern, smashing through the 128 handle into the 127's and then some. The next level of support at 127'22 did little to provide support, though we finally bottomed out for now just above 127'08. Currently, we are seeing a brief pivot with an attempt to break 127'22 from below which is meeting resistance confirmed by two red triangles on the KRI. If we are able to break this level, the next target is 128'01. The Kovach OBV has flattened out suggesting we won't expect much in the way of momentum for now. If we fall further, 127'08 should provide support, then 127'01.

Volatility in GoldGold has been volatile, but is overall holding the range between the 1780's and 1815. We first smashed through 1795, the lower bound of our value area, but quickly found support at 1789, where we were bought back up to 1815. Currently we are meeting resistance at this level confirmed by several red triangles on the KRI. The Kovach OBV is rather flat, filtering out the noise from the recent volatility, as it was designed to do. This suggests that we may reject 1815, and establish value again between 1795 and 1815. If we are able to break through, then 1826 is our next target. If we seek lower values, we will have support in the 1780's, with 1777 a likely floor.

GJ Bearish Bias, Daily Rejection, Looking for 153.5 on HTF'sWe have the first london session of the week go bullish
but nd up pulling back hard, back below 155 Psychological level on HTF's
I'm looking bearish, we have bearish market structure on this intraday chart
Anticpating USD strength as well, JPY being a safe haven, I expect them to move in unison

Bull Wedge in Gold??Gold has pressed down past our support level at 1795, plummeting through the entire vacuum zone between 1815 and 1795. As predicted, we have found support in the 1780's, with two levels acting as a buffer between our ultimate floor of 1777. We are seeing a bull wedge forming at current levels, suggesting that gold may attempt a rebound to higher levels, but will face resistance at 1795. If we are able to break this, then the next level is 1815. If we dump further, we anticipate support at 1777. The Kovach OBV is pretty flat, suggesting we need momentum to come through either way.

Head and Shoulders Breakdown in BondsAfter breaking down from our head and shoulders pattern, bonds have found support at lower levels and have attempted a rebound. The level 127'08 provided good support confirmed by a green triangle on the KRI, and we saw a nice pivot there. We were able to break above 127'22, the next level above before retracing and stabilizing above 127'08 again. It appears that ZN is attempting to stabilize in this area, as we mentioned in the reports. The Kovach OBV has leveled off, so we anticipate the price action to be range bound between these levels.

Gold Smashes Through Lower LevelsGold has smashed through lower levels, currently breaking through our levels in the 1780's. We are just above 1777, the floor we anticipated yesterday. We sliced through the entire value area between 1815 and 1795 with ease. The Kovach OBV has taken a turn to the bearish side with the selloff. We anticipate 1777 to hold, as it has provided support in the past, but if not, then 1770 should hold, then there is a vacuum zone to 1759. We should see resistance from 1795, should gold bounce from lower levels.

CHF - Longer term: Where to next? And why does it matter?$CHF Longer Term Time Frame
Where to next? And why does it matter?
As we head into month end, it's when I am looking at the monthly time frames to indicate to me the key important areas we are in and how will the candle close.
CHF and many of the other G10 spot currencies are at very interesting areas longer term, if these key areas were to end further in the momentum it's going we will be have further clear clarification of price action.
Technical View: Pattern - Within a wedge formation a break to either direction confirmation is needed. However, if we was to go above 50EMA and a close above 0.94800 areas then bulls will gain further control towards upside towards 0.99850 -1.10000 areas. If we don't and we always have the beautiful support of 21EMA anywhere below that we go towards support range of 0.91550 areas.
Fundamentals:
CHF known as safe havens... As precious metals decline further ( A chart was shared on the private groups I am part of) and with Feds Hawkish we've had a lot of bids coming in for DXY, it's part of the market rotation and this may accelerated further. March meeting FOMC is expected to do it's first rate hike. However, don't forget we want get at a great bargain and stick to your trade plan.
(Do you realise the pattern yet?)
Key Tip: Longer TF = Shorter TF movement!
Trade Safe
TJ
Disclaimer: Not Financial Advice

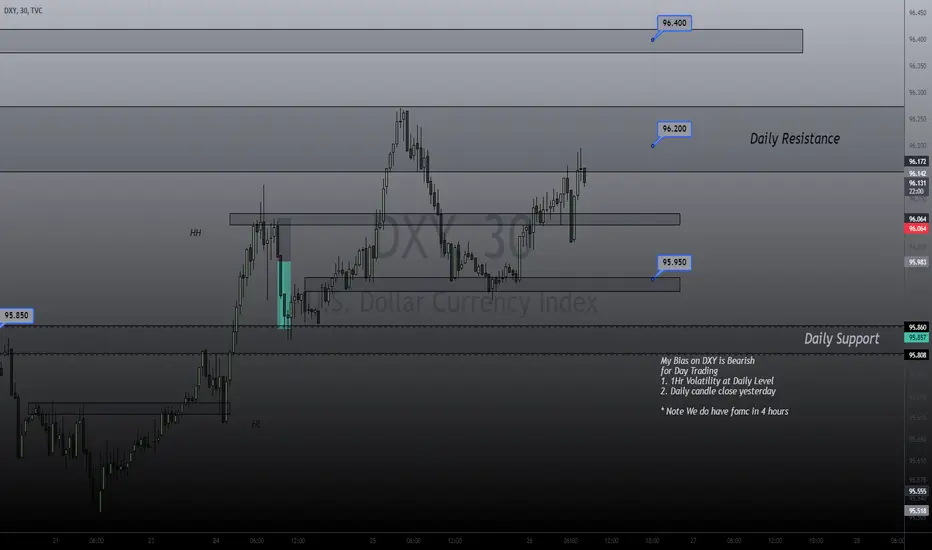
DXY Lower TF Rejection of Daily Resistance Level As we approach FOMC price is printing rejection candles off our daily zone.
This could all be liquidity for a move higher later during FOMC
Best to stay out of the market for the time being and possible scalp with your bias
if FOMC confirms your bias.
CHFJPY - UPDATEDont sleep on CHFJPY today - Swiss Franc historically acts as a safe haven for investors in uncertain times, making this fundamentally bullish. From a TA perspective we can see the correction on the 1D TF is showing signs of deceleration and is about to test our weekly POI demand zone, waiting for a false move below the lows to induce bears then we can look for a potential long entry.

The start of a long trainNote: FEEVRWS is only meant to be a analysis and early warning system, and is in no way a substitute for your regular work. Please do your own due diligence and if needed, consult a trusted professional.
Today we will be looking at economic correlations and why bonds are moving the way they are.
As of right now the 10y and 7y are a quarter of a quarter of a quarter of a percent away from inverting and a inversion percent in the 30y to 20y is as much currently. 30y to 20y is already inverted. There are MANY reasons why and this is not so simple. Bonds are selling off across the board with only the 1mo remaining the same. Tho today seems to be about flat, the trend continues.
Housing, rate hikes, savings, inflation, liquidity, fomo speculation and foriagn investments are all tied to this and as a result the analysis will continue with other charts produced today

DXY Bullish Bias Playing out nicely Early on in the WeekDaily Market structure is Bullish
Weekly trend is Bullish Each session this week
has provided an opportunity to join in
on the Trend.
Looking for pullback to 95.85$ for continuation of
trend

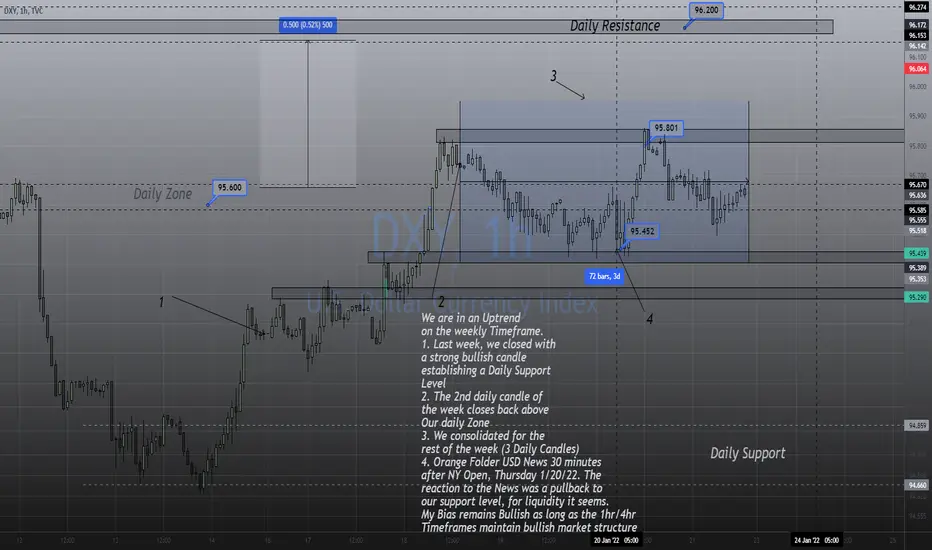
Dollar Index / Technical Analysis, Week 3, 2022This is not a trade Idea, Rather an analysis of last week's Price action on the 1Hr TF. I describe my thoughts on what may be playing out here. The daily candles closing back inside the daily range between 95.6 and 96.2 is a sign of bullish strength. We have now established a solid support on the Weekly Timeframe.. and the Dollar has been trending up. Cheers everyone. Follow for more of these breakdowns. :D
DigitalSurf: XAUUSD Looks For Testing Near $1840-$1850Based on my current assessment of Gold's wave structure. I believe this asset is due for a 2.2% rise from current price levels.

Gold Maintains the RangeGold has been holding the range between 1815 and 1826 nicely. We are seeing good support and resistance from above and below, respectively, confirmed by green and red triangles on the KRI at these levels. The price action is starting to 'round off' at highs, suggesting we be losing confidence in higher levels, and might be gearing up for a retracement. If support at 1815 does not hold, there is a vacuum zone down to 1715. If we can muster the strength to break 1826, then 1836 is the next target. The Kovach OBV has been holding steady at highs, suggesting the current range may hold for now, until we see more momentum come through either way.

The Feds Gamble: AUDJPYThis is a weekly trade update on The Feds gamble portfolio, which is long USD, Long JPY this is the action that we have seen.
Number of various head fakes have taken place as it flipped from bearish to bullish and back bearish.
Ultimately AUDJPY printed out a early support to the week at $82.5 after falling from 83.25 which was the opening top to the week.
11th-13th AUDJPY saw a weakening jpy leading to a range developed 10th-11th ending with a range break out giving us the eventual to in the market
13th-14th AUDJPY showed a strong sell off after making new highs and ended in a new lower low

Gold Tests Higher LevelsGold has made another run for hgihs, but is facing resistance at 1826. Several red triangles on the KRI are suggesting resistance here. The Kovach OBV is strong, but has leveled off, suggesting momentum may have petered out for now and we are likely to see further resistance from 1826. But if not, 1836 is the next target. We should see support from 1815, but if not, then there is a vacuum zone down to 1795. It is likely that gold will range between 1815 and 1826.
