$XAUUSD (Gold): Golden Rally or Gilded Pause?(1/9)
Good morning, everyone! ☀️ XAUUSD (Gold): Golden Rally or Gilded Pause?
With gold at $3,020.82, is this safe-haven surge a treasure or a tease? Let’s sift through the shine! 🔍
(2/9) – PRICE PERFORMANCE 📊
• Current Price: $ 3,020.82 per ounce as of Mar 25, 2025 💰
• Recent Move: Near $3,057 high from Mar 20, per data 📏
• Sector Trend: Precious metals up on tension, per posts on X 🌟
It’s a golden glow—let’s see if it holds! ⚙️
(3/9) – MARKET POSITION 📈
• Global Role: Top safe-haven asset ⏰
• Drivers: Central bank buying, geopolitical risks 🎯
• Trend: Bullish near $3,000, per data 🚀
Firm as a refuge, shining in uncertainty! 🏦
(4/9) – KEY DEVELOPMENTS 🔑
• Geopolitical Boost: Trade tensions linger, per data 🌍
• U.S. Data: PMI strength supports USD, caps gold, per posts on X 📋
• Market Reaction: Consolidating near $3,020-$3,030 💡
Simmering in a tense market! 🌩️
(5/9) – RISKS IN FOCUS ⚡
• Profit-Taking: Post-$3,000 sales loom 🔍
• U.S. Rates: Policy shifts could hit, per data 📉
• Oil Prices: CAD link affects broader forex ❄️
It’s a shiny tightrope—watch your step! 🛑
(6/9) – SWOT: STRENGTHS 💪
• Safe Haven: Thrives in chaos, per posts on X 🥇
• Central Banks: Steady buying props it up 📊
• Green Demand: Key in renewables, per data 🔧
Got a golden backbone! 🌟
(7/9) – SWOT: WEAKNESSES & OPPORTUNITIES ⚖️
• Weaknesses: Volatility from profit-taking 📉
• Opportunities: More tensions, rate cuts 📈
Can it gleam higher or dim out? 🤔
(8/9) – POLL TIME! 📢
Gold at $3,020.82—your take? 🗳️
• Bullish: $3,100+ soon, rally rolls 🐂
• Neutral: Steady, risks balance out ⚖️
• Bearish: $2,950 looms, correction hits 🐻
Chime in below! 👇
(9/9) – FINAL TAKEAWAY 🎯
Gold’s $3,020.82 price tags a safe-haven rally 📈, but volatility’s in the mix 🌿. Dips are our DCA jackpot 💰—buy low, ride high! Gem or bust?
Safehaven

Why gold remains strong: Latest on Ukraine and Yemen Gold remains in high demand as a safe-haven asset, currently trading at $2,998.7 per ounce.
Why the need for a haven? Here’s an update:
A ceasefire in Ukraine hinges on some unpalatable conditions. Donald Trump has announced plans to speak with Vladimir Putin on Tuesday, saying that land and power plants are part of the negotiations. Reports suggest his administration is considering recognising Crimea as Russian territory and may push for UN recognition.
In the Middle East, the U.S. carried out military strikes over the weekend on Houthi-controlled areas in Yemen. The strikes came after the group threatened to resume attacks on Red Sea shipping.
Trump has declared that Iran will be held directly responsible for “for every shot fired” by the Tehran-backed Houthi rebels. In response, the Houthis vowed to “respond to escalation with escalation.”.

Behind the Curtain: Unveiling Gold’s Economic Catalysts1. Introduction
Gold Futures (GC, MGC and 1OZ), traded on the CME market, are one of the most widely used financial instruments for hedging against inflation, currency fluctuations, and macroeconomic uncertainty. As a safe-haven asset, gold reacts to a wide range of economic indicators, making it crucial for traders to understand the underlying forces driving price movements.
By leveraging machine learning, specifically a Random Forest Regressor, we analyze the top economic indicators influencing Gold Futures on daily, weekly, and monthly timeframes. This data-driven approach reveals the key catalysts shaping GC Futures and provides traders with actionable insights to refine their strategies.
2. Understanding Gold Futures Contracts
Gold Futures (GC) are among the most actively traded futures contracts, offering traders and investors exposure to gold price movements with a range of contract sizes to suit different trading strategies. CME Group provides three types of Gold Futures contracts to accommodate traders of all levels:
o Standard Gold Futures (GC):
Contract Size: Represents 100 troy ounces of gold.
Tick Size: Each tick is 0.10 per ounce, equating to $10 per tick per contract.
Purpose: Ideal for institutional traders and large-scale hedgers.
Margin: Approximately $12,500 per contract.
o Micro Gold Futures (MGC):
Contract Size: Represents 10 troy ounces of gold, 1/10th the size of the standard GC contract.
Tick Size: Each tick is $1 per contract.
Purpose: Allows smaller-scale traders to participate in gold markets with lower capital requirements.
Margin: Approximately $1,250 per contract.
o 1-Ounce Gold Futures (1OZ):
Contract Size: Represents 1 troy ounce of gold.
Tick Size: Each tick is 0.25 per ounce, equating to $0.25 per tick per contract.
Purpose: Provides precision trading for retail participants who want exposure to gold at a smaller contract size.
Margin: Approximately $125 per contract.
Keep in mind that margin requirements vary through time as market volatility changes.
3. Daily Timeframe: Key Economic Indicators
Gold Futures respond quickly to short-term economic fluctuations, and three key indicators play a crucial role in daily price movements:
o Velocity of Money (M2):
Measures how quickly money circulates within the economy.
A higher velocity suggests increased spending and inflationary pressure, often boosting gold prices.
A lower velocity indicates stagnation, which may reduce inflation concerns and weigh on gold.
o Unemployment Rate:
Reflects the strength of the labor market.
Rising unemployment increases economic uncertainty, often driving demand for gold as a safe-haven asset.
Declining unemployment can strengthen risk assets, potentially reducing gold’s appeal.
o Oil Import Price Index:
Represents the cost of imported crude oil, influencing inflation trends.
Higher oil prices contribute to inflationary pressures, supporting gold as a hedge.
Lower oil prices may ease inflation concerns, weakening gold demand.
4. Weekly Timeframe: Key Economic Indicators
While daily fluctuations impact short-term traders, weekly economic data provides a broader perspective on gold price movements. The top weekly indicators include:
o Nonfarm Payrolls (NFP):
Measures the number of new jobs added in the U.S. economy each month.
Strong NFP numbers typically strengthen the U.S. dollar and increase interest rate hike expectations, pressuring gold prices.
Weak NFP figures can drive economic uncertainty, increasing gold’s safe-haven appeal.
o Nonfarm Productivity:
Represents labor efficiency and economic output per hour worked.
Rising productivity suggests economic growth, potentially reducing demand for gold.
Falling productivity can signal economic weakness, increasing gold’s appeal.
o Personal Spending:
Tracks consumer spending habits, influencing economic activity and inflation expectations.
Higher spending can lead to inflation, often pushing gold prices higher.
Lower spending suggests economic slowing, which may either weaken or support gold depending on inflationary outlooks.
5. Monthly Timeframe: Key Economic Indicators
Long-term trends in Gold Futures are shaped by macroeconomic forces that impact investor sentiment, inflation expectations, and interest rates. The most influential monthly indicators include:
o China GDP Growth Rate:
China is one of the largest consumers of gold, both for investment and jewelry.
Strong GDP growth signals robust demand for gold, pushing prices higher.
Slower growth may weaken gold demand, applying downward pressure on prices.
o Corporate Bond Spread (BAA - 10Y):
Measures the risk premium between corporate bonds and U.S. Treasury bonds.
A widening spread signals economic uncertainty, increasing demand for gold as a safe-haven asset.
A narrowing spread suggests confidence in risk assets, potentially reducing gold’s appeal.
o 10-Year Treasury Yield:
Gold has an inverse relationship with bond yields since it does not generate interest.
Rising yields increase the opportunity cost of holding gold, often leading to price declines.
Falling yields make gold more attractive, leading to price appreciation.
6. Risk Management Strategies
Given gold’s volatility and sensitivity to macroeconomic changes, risk management is essential for trading GC Futures. Key risk strategies may include:
Monitoring Global Liquidity Conditions:
Keep an eye on M2 Money Supply and inflation trends to anticipate major shifts in gold pricing.
Interest Rate Sensitivity:
Since gold competes with yield-bearing assets, traders should closely track interest rate movements.
Higher 10-Year Treasury Yields can weaken gold’s value as a non-yielding asset.
Diversification and Hedging:
Traders can hedge gold positions using interest rate-sensitive assets such as bonds or inflation-linked securities.
Gold often performs well in times of equity market distress, making it a commonly used portfolio diversifier.
7. Conclusion
Gold Futures remain one of the most influential instruments in the global financial markets.
By leveraging machine learning insights and macroeconomic data, traders can better position themselves for profitable trading opportunities. Whether trading daily, weekly, or monthly trends, understanding these indicators allows market participants to align their strategies with broader economic conditions.
Stay tuned for the next "Behind the Curtain" installment, where we explore economic forces shaping another key futures market.
When charting futures, the data provided could be delayed. Traders working with the ticker symbols discussed in this idea may prefer to use CME Group real-time data plan on TradingView: www.tradingview.com - This consideration is particularly important for shorter-term traders, whereas it may be less critical for those focused on longer-term trading strategies.
General Disclaimer:
The trade ideas presented herein are solely for illustrative purposes forming a part of a case study intended to demonstrate key principles in risk management within the context of the specific market scenarios discussed. These ideas are not to be interpreted as investment recommendations or financial advice. They do not endorse or promote any specific trading strategies, financial products, or services. The information provided is based on data believed to be reliable; however, its accuracy or completeness cannot be guaranteed. Trading in financial markets involves risks, including the potential loss of principal. Each individual should conduct their own research and consult with professional financial advisors before making any investment decisions. The author or publisher of this content bears no responsibility for any actions taken based on the information provided or for any resultant financial or other losses.

XAU/USD: Gold – Glittering Gains or Gilded Trap?(1/9)
Good evening, everyone! 🌙 XAU/USD: Gold – Glittering Gains or Gilded Trap?
With gold at $2,984.40, is this safe-haven star shining bright or setting up for a fall? Let’s mine the truth! 🔍
(2/9) – PRICE PERFORMANCE 📊
• Current Price: $ 2,984.40 per ounce as of Mar 14, 2025 💰
• Recent Move: Near $3,000, up from recent trends, per data 📏
• Sector Trend: Precious metals hot with trade tensions, rate cut bets 🌟
It’s a shiny ride—let’s see what’s fueling it! ⚙️
(3/9) – MARKET POSITION 📈
• Global Role: Safe-haven asset, industrial use in electronics ⏰
• Supply Dynamics: Central bank buying, mining output steady 🎯
• Trend: Geopolitical risks pushing demand, per posts on X 🚀
Firm as a rock in uncertain times! 🏦
(4/9) – KEY DEVELOPMENTS 🔑
• Trade Tensions: U.S.-China tariff threats boosting safe-haven appeal 🌍
• Rate Cuts: Fed easing bets supporting prices, per data 📋
• Market Reaction: Near record highs, showing strength 💡
Riding waves of global chaos! 🌊
(5/9) – RISKS IN FOCUS ⚡
• Economic Recovery: Could dampen safe-haven demand 🔍
• Market Sentiment: Sudden risk-on shifts might trigger a sell-off 📉
• Supply Boost: Increased mining could cap gains ❄️
It’s a glittering gamble—watch out! 🛑
(6/9) – SWOT: STRENGTHS 💪
• Safe-Haven Demand: Gold thrives in uncertainty 🥇
• Central Bank Buying: Steady support from global reserves 📊
• Green Energy: Use in renewables adds industrial demand 🔧
Got a golden edge in tough times! 🌟
(7/9) – SWOT: WEAKNESSES & OPPORTUNITIES ⚖️
• Weaknesses: High prices risk a correction if tensions ease 📉
• Opportunities: Escalating trade wars, infrastructure spending 📈
Can it break $3,000 and hold? 🤔
(8/9) – POLL TIME! 📢
Gold at $2,984.40—your take? 🗳️
• Bullish: $3,100+ soon, safe-haven rally continues 🐂
• Neutral: Steady near $3,000, risks balance out ⚖️
• Bearish: $2,800 looms, correction ahead 🐻
Chime in below! 👇
(9/9) – FINAL TAKEAWAY 🎯
Gold’s $2,984.40 price reflects safe-haven strength 📈, but it’s not cheap—volatility’s our ally. DCA-on-dips could catch a dip below $3,000 for a long-term win. Gem or bust?

GOLD - $3,000 is a Magnet!Hello TradingView Family / Fellow Traders. This is Richard, also known as theSignalyst.
📈 After recording a new all-time high this week, GOLD has been surging in a parabolic manner.
🎯 Next target? The $3,000 round number is lining up perfectly with the upper bound of the rising channel marked in red.
🏹Meanwhile , every bearish correction would be an opportunity to look for trend-following longs, targeting the $3,000 mark.
📚 Always follow your trading plan regarding entry, risk management, and trade management.
Good luck!
All Strategies Are Good; If Managed Properly!
~Rich
Disclosure: I am part of Trade Nation's Influencer program and receive a monthly fee for using their TradingView charts in my analysis.

USD Weakens as Fed Cuts Loom, Safe-Haven CHF GainsMacro:
- Economic concerns in the US, including slowdown risks and trade policy uncertainties, have weakened the US dollar against the swiss franc, benefiting from its safe-haven status.
- Traders expect 0.75% in Fed rate cuts this year, with a Jun cut fully priced. Investors now await Wed's US inflation report for further cues.
- Meanwhile, net long dollar positions in currency futures markets have significantly dropped from Jan's nine-year high, which may reduce the further extreme reallocation away from USD.
Technical:
- USDCHF bounced after reaching the support cluster of 0.8770-0.8800, which coincides with the 100% Fibonacci Extension. The price is below both EMAs, indicating persistent bearish momentum.
- If USDCHF remains above the support area of 0.8770-0.8800, the price may retest the resistance area of 0.8900-0.8915.
- On the contrary, a closing below 0.8770 may prompt a continuous decline to retest the following support area of 0.8617-0.8650, confluence with the 161.8% Fibonacci Extension.
Analysis by: Dat Tong, Senior Financial Markets Strategist at Exness

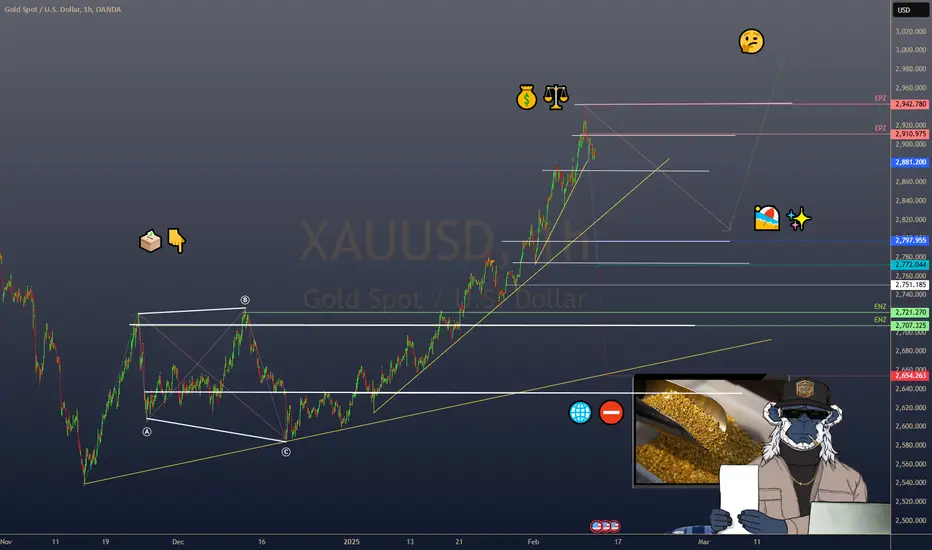
XAUUSD: Riding the Trade War Wave: Will We See New Highs?Hey Realistic Traders, Will OANDA:XAUUSD See New All-Time High Soon? Let's dive into the analysis...
Analyzing XAUUSD price movements using Elliott Wave Theory suggests a possible significant upside in Wave 5. Wave 3 previously didn't go beyond the 1.618 Fibonacci extension, classifying it as a normal wave. Wave 4 then retraced to around the 0.618 Fibonacci level, forming a bullish descending broadening wedge pattern.
The breakout from this descending broadening wedge on the 1-hour chart, combined with a golden cross in the MACD indicator, indicates the potential start of Wave 5. Since Wave 5 is expected to be extended, its movement might be greater than Wave 3. However, we conservatively expect the extended Wave 5 to reach a maximum of the 0.786 Fibonacci level.
Based on these technical indicators, the price is projected to rise towards the target of 2950, and possibly the second target at 2969, as long as it stays above the critical stop loss level of 2900.
Support the channel by engaging with the content, using the rocket button, and sharing your opinions in the comments below.
"Disclaimer: "Please note that this analysis is solely for educational purposes and should not be considered a recommendation to take a long or short position on Gold".

GOLD (XAU/USD)—$2,975 HIGH SPARKS BUZZGOLD (XAU/USD)—$2,975 HIGH SPARKS BUZZ
(1/9)
Good afternoon, TradingView! Gold (XAU/USD) hit $ 2,975 in Feb ‘25, up 5-7% YTD 🌍 2024’s 26-27% gain shines—here’s the breakdown.
(2/9) – PRICE RISE
• 2024 Gain: 26-27%, best since 2010 📈
• 2025 YTD: 2,955-2,975, 5-7% up 💡
• Feb 24: +0.52% to new high 🌞
Gold’s climb, safe-haven rules.
(3/9) – MARKET MOVES
• Trade Fear: Tariffs spark inflows 🌟
• FASB: Coinbase tie lifts mood 🚗
• Dip: $ 2,940 Feb 25, profit takes 📊
Gold’s humming, tension fuels it.
(4/9) – SECTOR SNAP
• Price: 2,940-2,875, $ 20T+ cap 🌍
• Vs Silver: Outpaces XAG’s wobble 💪
• Forecasts: UBS $ 3,200—value gap? 📉
Gold’s steady, peers falter.
(5/9) – RISKS IN FOCUS
• Fed: High rates cap upside ⚠️
• USD: Tariff boost stings 🔒
• Profit Takes: -1.27% Feb 25 🐻
Gold’s firm, but headwinds nip.
(6/9) – SWOT: STRENGTHS
• Gain: 26-27% ‘24—tough haul 💪
• Demand: Banks, ETFs pile in 🏋️
• Hedge: 4.3% inflation shield 🌱
Gold’s gritty, crisis-proof.
(7/9) – SWOT: WEAKNESSES & OPPORTUNITIES
• Weaknesses: No yield, USD bite 🙈
• Opportunities: Tariffs, $ 3,200 zing 🌏
Can gold vault past the snags?
(8/9) – Gold’s $ 2,975 peak, your view?
1️⃣ Bullish, $ 3,200+ soon 😎
2️⃣ Neutral, Holds, risks linger 🤷
3️⃣ Bearish, $ 2,800 dip looms 😕
Vote below! 🗳️👇
(9/9) – FINAL TAKEAWAY
Gold’s $ 2,975 Feb high and 26% ‘24 stack up, safe-haven star Trade fears lift, risks loom, gem or pause?

GOLD - Still Bullish Indeed!Hello TradingView Family / Fellow Traders. This is Richard, also known as theSignalyst.
📈XAUUSD has been overall bullish, trading within the rising wedge marked in orange.
Moreover, the blue zone is a strong structure and support.
🏹 Thus, the highlighted blue circle is a strong area to look for buy setups as it is the intersection of structure and lower blue trendline acting as a non-horizontal support.
📚 As per my trading style:
As #GOLD is around the the blue circle zone, I will be looking for bullish reversal setups (like a double bottom pattern, trendline break , and so on...)
If the blue zone is broken downward, a deeper bearish movement towards the $2,775 demand zone would be expected.
📚 Always follow your trading plan regarding entry, risk management, and trade management.
Good luck!
All Strategies Are Good; If Managed Properly!
~Rich
Disclosure: I am part of Trade Nation's Influencer program and receive a monthly fee for using their TradingView charts in my analysis.

Is History Repeating? XAUUSD on the Verge of a Breakout!📌 Description:
Gold's price action is aligning with a familiar historical pattern, hinting at a potential breakout. Let’s break it down:
1️⃣ Historical Precedent – Looking back, a similar market structure led to a significant bullish move. Recognizing these patterns can provide an edge in anticipating market behavior.
2️⃣ Recurring Structure – Once again, the chart is shaping up in a way that mirrors past price action. If history is any guide, this could be a pivotal moment.
3️⃣ Bullish Pennant Formation – The current price action suggests the formation of a bullish pennant, a classic continuation pattern. When combined with historical context, the probability of a breakout strengthens.
🔍 Fundamental Factors:
- Geopolitical Uncertainty: Rising tensions and macroeconomic instability continue to drive demand for gold as a safe-haven asset.
- Interest Rate Expectations: With potential shifts in central bank policies, any dovish signals could fuel further upside in XAUUSD.
- Inflation & USD Strength: Any weakness in the dollar or persistent inflation could further support gold’s bullish case.
⚡ Is this the next major move for gold? Let’s discuss! Drop your thoughts below! 👇

Silver's Bullish Momentum: Can It Rally Another +12.14%?Hey Realistic Traders, A lot of uncertainty looms after Donald Trump was officially sworn in as President. Will Safe Haven Assets, such as OANDA:XAGUSD Rise Again?
Let's dive into the analysis...
Silver has tested the EMA-200 line more than twice in the past year. This retracement often signals a strong bullish trend.
On the daily chart, Silver has formed a falling wedge pattern, followed by a breakout. The breakout, combined with a bullish MACD crossover, suggests the trend is likely to continue upward.
Based on these technical indicators, the price is projected to rise toward Target 1 at $33.0811 or potentially Target 2 at $34.5649, as long as it stays above the critical stop-loss level of $28.7040
Support the channel by engaging with the content, using the rocket button, and sharing your opinions in the comments below.
"Disclaimer: "Please note that this analysis is solely for educational purposes and should not be considered a recommendation to take a long or short position on Silver".

Will increasing inflation accelerate XAGUSD price more?
With the looming threat of an inflation rebound, demand for both gold and silver is skyrocketing, propelling the prices up. The Trump administration's continued threat of tariffs, along with the US CPI rising to 3.0% YoY (prev. 2.9%, cons. 2.9%) in Jan, has increased demand for inflation hedges. Meanwhile, rising pressure on gold prices, which have reached all-time highs, may drive additional capital flows into XAGUSD. Furthermore, ongoing uncertainty in trade dynamics is poised to bolster silver prices further.
XAGUSD sustains its uptrend, testing the resistance at 32.50. Both EMAs widen the gap, expanding their bullish momentum. If XAGUSD breaches above 32.50, the price could gain upward momentum toward the next resistance at 33.50. Conversely, if XAGUSD breaks below EMA21, the price may fall further to the support at 31.00.

$GOLD EASES FROM RECORD HIGHS AHEAD OF U.S. INFLATION DATAGOLD EASES FROM RECORD HIGHS AHEAD OF U.S. INFLATION DATA
1/7
Gold hit a record high of $2,942.70/oz on Feb 11, fueled by safe-haven demand amid fresh U.S. tariffs. Today, it’s dipped 0.2% to $2,892.50 as investors take profits and watch U.S. inflation data. Let’s dig in! 💰⚖️
2/7 – RECENT PRICE ACTION
• All-time high at $2,942.70/oz—sparked by President Trump’s 25% tariffs on steel & aluminum
• Spot gold now at $2,892.50 (↓0.2%), with futures at $2,931.40 (↓0.1%)
• The rally’s paused—are we in for a short breather or a bigger correction? 🤔
3/7 – TARIFF TENSIONS
• 25% tariffs raise global trade war fears, boosting gold’s safe-haven appeal
• Markets worried about inflation, as import costs could climb
• Gold remains a hedge against economic uncertainty and currency devaluation 🌐⛔️
4/7 – MACROECONOMIC DRIVERS
• Fed Chair Powell’s hawkish comments on rate policy sent gold lower—higher rates often weigh on non-yielding assets
• U.S. inflation data (due soon) could shape the Fed’s next move—any upside surprise might strengthen the dollar, pressuring gold further
5/7 – INVESTOR SENTIMENT
• Profit-taking: After a massive run-up, traders might lock in gains
• Safe Haven: Still an underlying bullish sentiment if tariffs escalate
• The $2,900–$2,950 range is in focus—will gold consolidate or stage another breakout?
6/7 Where’s gold heading next?
1️⃣ Above $3,000—safe haven demand remains strong ✨
2️⃣ Sideways around $2,900—pausing for data 🏖️
3️⃣ Back under $2,850—hawkish Fed sinks gold ⬇️
Vote below! 🗳️👇
7/7 – STRATEGY WATCH
• Short-Term: Watch U.S. inflation data & dollar moves—gold typically moves opposite the greenback
• Long-Term: If tariffs stoke inflationary pressure, gold may shine even brighter. Keep an eye on geopolitical developments! 🌎
BTC & ALTCOINSIn this chart we can see Bitcoin historical Highs , lows , halving years (green->green) and halvings ... we can see some patterns here , not price patterns but sessionality patterns .. for example .. strong probabilty next btc HIGH will be in November/December this year , or we can also see on chart of BTC.D .. we are close to date when BTC.D breaks and fall as much as alts shine .. But all of this was history what about today ? What if , in this one cycle is something different , for example players ... Old good BTC and Crypto OG players now have less power as manipulators , we have some guys from wallstreet also here , Trump and much more .. Macroeconomic was totaly changed ... so what do you think guys ?

GOLD/XAUUSD Aiming for New Highs? While the US and BRICS (Brazil, Russia, India, China, and South Africa) aren’t in a formal trade war, tensions are rising. BRICS nations are working to reduce reliance on the US dollar, challenging its dominance in global trade. This “de-dollarization” effort and geopolitical shifts, like sanctions on Russia and US-China disputes, are fueling uncertainty. The USD surged by over 7.1% and was the only currency to see a positive growth in 2024.
What This Means for Gold?
Gold thrives during uncertainty. As BRICS push for alternatives to the dollar and tensions with the US escalate, demand for gold could rise:
Hedge Against Currency Risks: If BRICS reduce dollar usage, the dollar might weaken, boosting gold’s appeal.
Geopolitical Tensions: Gold is a safe-haven asset investors flock to during economic instability.
Global economic shifts are driving gold’s narrative. Trade wisely!
Apex out!

Concerns about Trump's tariff policies are boosting gold demand
Gold prices have surged to an all-time high as demand for safe haven increased significantly, driven by the concerns of Trump's tariff policy. The 25% tariff threats on Mexico and Canada are creating significant uncertainty in the trade and foreign relations of the Trump administration. Investors are turning to gold as a reliable refuge from the DeepSeek shock and the tremendously high valuations of major US tech stocks, seeking a safe haven amid the current volatility. Furthermore, the US Q4 GDP growth of 2.3% fell short of the 2.7% market forecast, intensifying the demand for gold as a safe haven.
While sustaining a solid uptrend, XAUUSD recorded a historical high. Both EMAs continue to widen the gap, pointing to an extension of bullish momentum. If XAUUSD holds above the ascending trendline, the price could gain upward momentum toward a new high of 2850. Conversely, if XAUUSD fails to hold above the support at 2780 and EMA21, the price may retreat below the trendline.

Gold - TRIO RETEST!Dear TradingView community and fellow traders,
I find the daily chart for Gold to be interesting as it appears to be forming one of my favorite patterns. What I call TRIO RETEST
Here is why the blue circle is a strong zone to keep an eye on:
1️⃣ => Overall Trend
Gold has been bullish long-term trading inside the rising broadening wedge in blue and now approaching the lower blue bound / trendline acting as a non-horizontal support.
2️⃣ => Round Number
The $2,500 marked in green is a strong round number.
3️⃣ => Oversold Zone
Gold is bearish short-term trading inside the falling channel in red and now approaching the lower red trendline which I consider an oversold zone.
As per my trading style:
As Gold approaches the blue circle zone, I will be looking for bullish reversal setups (like a double bottom pattern, trendline break, and so on...)
📚 Hope you find this post useful. It's important to always adhere to your trading plan, including entry points, risk management strategies, and trade management techniques.
All Strategies Are Good; If Managed Properly!
~Richard
Disclaimer: The information provided is for educational and informational purposes only and should not be considered as financial advice. It is important to do your own research and make informed decisions before entering any trades. Past performance is not indicative of future results. Always be aware of the potential for losses, and never risk more than you can afford to lose.

Currency Wars: Exploring BTC/Fiat Ripple Effects on Key Markets1. Introduction
In today's interconnected financial markets, major fiat currencies like the Euro (6E) and Yen (6J) play a critical role in influencing USD-denominated assets. The relative strength between these currencies often reflects underlying economic trends and risk sentiment, which ripple across key markets like Treasuries (ZN), Gold (GC), and Equities (ES).
However, Bitcoin (BTC), a non-traditional digital asset, introduces an interesting divergence. Unlike fiat currencies, BTC's behavior during periods of significant market stress may reveal a unique relationship to USD movements. This article explores:
The relative strength between the Euro and Yen.
Correlations between fiat currencies, BTC, and USD-denominated markets.
Whether BTC reacts similarly or differently to traditional currencies during market volatility.
By analyzing these dynamics, we aim to identify how shifts in currency strength influence assets like Treasuries while assessing BTC’s independence or alignment with fiat markets.
2. Relative Strength Between 6E and 6J
To evaluate currency dynamics, we compute the relative strength of the Euro (6E) versus the Yen (6J) as a ratio. This ratio helps identify which currency is outperforming, providing insights into broader risk sentiment and market direction.
Another way to think of this ratio would be to use the RY1! Ticker symbol which represents the Euro/Japanese Yen Futures contract.
Correlation Heatmaps
The correlation heatmaps below highlight relationships between:
o Currencies: Euro (6E), Yen (6J), and Bitcoin (BTC).
o USD-Denominated Markets: Treasuries (ZN), S&P 500 (ES), Crude Oil (CL), Gold (GC), and Corn (ZC).
o Key Observations (Daily Timeframe):
The 6J (Yen) shows a positive correlation with Treasuries (ZN), supporting its traditional role as a safe-haven currency.
Bitcoin (BTC) demonstrates mixed relationships across assets, showing signs of divergence compared to fiat currencies during specific conditions.
o Key Observations (Weekly and Monthly Timeframes):
Over longer timeframes, correlations between 6E and markets like Gold (GC) strengthen, while the Yen's (6J) correlation with Treasuries becomes more pronounced.
BTC correlations remain unstable, suggesting Bitcoin behaves differently than traditional fiat currencies, particularly in stress periods.
3. BTC Divergence: Behavior During Significant Moves
To assess BTC's behavior during stress periods, we identify significant moves (beyond a predefined threshold) in the Euro (6E) and Yen (6J). Using scatter plots, we plot BTC returns against these currency moves:
BTC vs 6E (Euro):
BTC returns show occasional alignment with Euro movements but also exhibit non-linear patterns. For instance, during sharp Euro declines, BTC has at times remained resilient, highlighting its decoupling from fiat.
BTC vs 6J (Yen):
BTC's reaction to Yen strength/weakness appears more random, lacking a clear pattern. This further underscores BTC’s independence from traditional fiat dynamics, even as Yen strength typically aligns with safe-haven asset flows.
The scatter plots reveal that while fiat currencies like the Euro and Yen maintain consistent relationships with USD-denominated markets, Bitcoin exhibits periods of divergence, particularly during extreme stress events.
4. Focus on Treasury Futures (ZN)
Treasury Futures (ZN) are among the most responsive assets to currency shifts due to their role as a safe-haven instrument during economic uncertainty. Treasury prices often rise when risk aversion drives investors to seek safer assets, particularly when fiat currencies like the Yen (6J) strengthen.
6E/6J Influence on ZN
From the correlation heatmaps:
The Yen (6J) maintains a positive correlation with ZN prices, particularly during periods of market stress.
The Euro (6E) exhibits a moderate correlation, with fluctuations largely dependent on economic events affecting Eurozone stability.
When relative strength shifts in favor of the Yen (6J) over the Euro (6E), Treasury Futures often attract increased demand, reflecting investor flight-to-safety dynamics.
Forward-Looking Trade Idea
Given the above insights, here’s a hypothetical trade idea focusing on 10-Year Treasury Futures (ZN):
Trade Direction: Long Treasury Futures to capitalize on potential safe-haven flows.
Entry Price: 109’29
Target Price: 111’28
Stop Loss: 109’09
Potential for Reward: 126 ticks = $1,968.75
Potential for Risk: 40 ticks = $625
Reward-to-Risk Ratio: 3.15:1
Tick Value: 1/2 of 1/32 of one point (0.015625) = $15.625
Required margin: $2,000 per contract
This trade setup anticipates ZN’s upward momentum if the Yen continues to outperform the Euro or if broader risk-off sentiment triggers demand for Treasuries.
5. Risk Management Importance
Trading currency-driven assets like Treasury Futures or Bitcoin requires a disciplined approach to risk management due to their volatility and sensitivity to macroeconomic shifts. Key considerations include:
a. Stop-Loss Orders:
Always use stop-loss levels to limit downside exposure, especially when markets react sharply to currency moves or unexpected news.
b. Position Sizing:
Adjust position size to match market volatility.
c. Monitor Relative Strength:
Continuously track the 6E/6J ratio to identify shifts in currency strength that could signal changes in safe-haven flows or BTC behavior.
d. Non-Correlated Strategies:
Incorporate BTC into portfolios as a non-correlated asset, especially when fiat currencies exhibit linear correlations with traditional markets.
By implementing proper risk management techniques, traders can navigate the ripple effects of currency moves on markets like Treasuries and Bitcoin.
6. Conclusion
The relative strength between the Euro (6E) and Yen (6J) provides critical insights into the broader market environment, particularly during periods of stress. As shown:
Treasury Futures (ZN): Highly sensitive to Yen strength due to its safe-haven role.
Bitcoin (BTC): Demonstrates unique divergence from fiat currencies, reinforcing its role as a non-traditional asset during volatility.
By analyzing correlations and BTC’s reaction to currency moves, traders can better anticipate opportunities in USD-denominated markets and identify divergence points that signal market shifts.
When charting futures, the data provided could be delayed. Traders working with the ticker symbols discussed in this idea may prefer to use CME Group real-time data plan on TradingView: www.tradingview.com - This consideration is particularly important for shorter-term traders, whereas it may be less critical for those focused on longer-term trading strategies.
General Disclaimer:
The trade ideas presented herein are solely for illustrative purposes forming a part of a case study intended to demonstrate key principles in risk management within the context of the specific market scenarios discussed. These ideas are not to be interpreted as investment recommendations or financial advice. They do not endorse or promote any specific trading strategies, financial products, or services. The information provided is based on data believed to be reliable; however, its accuracy or completeness cannot be guaranteed. Trading in financial markets involves risks, including the potential loss of principal. Each individual should conduct their own research and consult with professional financial advisors before making any investment decisions. The author or publisher of this content bears no responsibility for any actions taken based on the information provided or for any resultant financial or other losses.

Safe Haven Volume-Weighted Cross-Asset Correlation Insights1. Introduction
Safe-haven assets, such as Gold, Treasuries, and the Japanese Yen, are vital components in diversified portfolios, especially during periods of market uncertainty. These assets tend to attract capital in times of economic distress, serving as hedges against risk. While traditional price correlation analyses have long been used to assess relationships between assets, they often fail to account for the nuances introduced by trading volume and liquidity.
In this article, we delve into volume-weighted returns, a metric that incorporates trading volume into correlation analysis. This approach reveals deeper insights into the interplay between safe-haven assets and broader market dynamics. By examining how volume-weighted correlations evolve across daily, weekly, and monthly timeframes, traders can uncover actionable patterns and refine their strategies.
The aim is to provide a fresh perspective on the dynamics of safe-haven assets, bridging the gap between traditional price-based correlations and liquidity-driven metrics to empower traders with more comprehensive insights.
2. The Role of Volume in Correlation Analysis
Volume-weighted returns account for the magnitude of trading activity, offering a nuanced view of asset relationships. For safe-haven assets, this is particularly important, as periods of high trading volume often coincide with heightened market stress or major economic events. By integrating volume into return calculations, traders can better understand how liquidity flows shape market trends.
3. Heatmap Analysis: Key Insights
The heatmaps of volume-weighted return correlations across daily, weekly, and monthly timeframes provide a wealth of insights into the behavior of safe-haven assets. Key observations include:
Gold (GC) and Treasuries (ZN): These assets exhibit stronger correlations over weekly and monthly timeframes. This alignment often reflects shared macroeconomic drivers, such as inflation expectations or central bank policy decisions, which influence safe-haven demand.
Daily
Weekly
Monthly
These findings highlight the evolving nature of cross-asset relationships and the role volume plays in amplifying or dampening correlations. By analyzing these trends, traders can gain a clearer understanding of the market forces at play.
4. Case Studies: Safe-Haven Dynamics
Gold vs. Treasuries (GC vs. ZN):
Gold and Treasuries are often considered classic safe-haven assets, attracting investor capital during periods of inflationary pressure or market turbulence. Volume-weighted return correlations between these two assets tend to strengthen in weekly and monthly timeframes.
For example:
During inflationary periods, both assets see heightened demand, reflected in higher trading volumes and stronger correlations.
Geopolitical uncertainties, such as trade wars or military conflicts, often lead to synchronized movements as investors seek safety.
The volume-weighted perspective adds depth, revealing how liquidity flows into these markets align during systemic risk episodes, providing traders with an additional layer of analysis for portfolio hedging.
5. Implications for Traders
Portfolio Diversification:
Volume-weighted correlations offer a unique way to assess diversification benefits. For example:
Weakening correlations between Gold and Treasuries during stable periods may signal opportunities to increase exposure to other uncorrelated assets.
Conversely, stronger correlations during market stress highlight the need to diversify beyond safe havens to reduce concentration risk.
Risk Management:
Tracking volume-weighted correlations helps traders detect shifts in safe-haven demand. For instance:
A sudden spike in the volume-weighted correlation between Treasuries and the Japanese Yen may indicate heightened risk aversion, suggesting a need to adjust portfolio exposure.
Declining correlations could signal the return of idiosyncratic drivers, providing opportunities to rebalance holdings.
Trade Timing:
Volume-weighted metrics can enhance timing strategies by confirming market trends:
Strengthening correlations between safe-haven assets can validate macroeconomic narratives, such as inflation fears or geopolitical instability, helping traders align their strategies accordingly.
Conversely, weakening correlations may signal the onset of new market regimes, offering early indications for tactical repositioning.
6. Limitations and Considerations
While volume-weighted return analysis offers valuable insights, it is essential to understand its limitations:
Influence of Extreme Events:
Significant market events, such as unexpected central bank announcements or geopolitical crises, can create anomalies in volume-weighted correlations. These events may temporarily distort the relationships between assets, leading to misleading signals for traders who rely solely on this metric.
Short-Term Noise:
Volume-weighted correlations over shorter timeframes, such as daily windows, are more susceptible to market noise. Sudden spikes in trading volume driven by speculative activity or high-frequency trading can obscure meaningful trends.
Interpretation Challenges:
Understanding the drivers behind changes in volume-weighted correlations requires a strong grasp of macroeconomic forces and market structure. Without context, traders risk misinterpreting these dynamics, potentially leading to suboptimal decisions.
By recognizing these limitations, traders can use volume-weighted correlations as a complementary tool rather than a standalone solution, combining it with other forms of analysis for more robust decision-making.
7. Conclusion
Volume-weighted return analysis provides a fresh lens for understanding the complex dynamics of safe-haven assets. By integrating trading volume into correlation metrics, this approach uncovers liquidity-driven relationships that are often missed in traditional price-based analyses.
Key takeaways from this study include:
Safe-haven assets such as Gold, Treasuries, and the Japanese Yen exhibit stronger volume-weighted correlations over longer timeframes, driven by shared macroeconomic forces.
For traders, the practical applications are clear: volume-weighted correlations can potentially enhance portfolio diversification, refine risk management strategies, and improve market timing. By incorporating this type of methodology into their workflow, market participants can adapt to shifting market conditions with greater precision.
When charting futures, the data provided could be delayed. Traders working with the ticker symbols discussed in this idea may prefer to use CME Group real-time data plan on TradingView: www.tradingview.com - This consideration is particularly important for shorter-term traders, whereas it may be less critical for those focused on longer-term trading strategies.
General Disclaimer:
The trade ideas presented herein are solely for illustrative purposes forming a part of a case study intended to demonstrate key principles in risk management within the context of the specific market scenarios discussed. These ideas are not to be interpreted as investment recommendations or financial advice. They do not endorse or promote any specific trading strategies, financial products, or services. The information provided is based on data believed to be reliable; however, its accuracy or completeness cannot be guaranteed. Trading in financial markets involves risks, including the potential loss of principal. Each individual should conduct their own research and consult with professional financial advisors before making any investment decisions. The author or publisher of this content bears no responsibility for any actions taken based on the information provided or for any resultant financial or other losses.

Follow the Gold...Hello TradingView Family / Fellow Traders. This is Richard, also known as theSignalyst.
📈 Gold has been overall bullish, trading within the rising channel in orange.
Currently, Gold is in a correction phase, so the lower bound of the channel would act as support.
Moreover, the blue zone is a strong demand.
🏹 Thus, the highlighted blue circle is a strong area to look for buy setups as it is the intersection of the blue demand and lower orange trendline.
📚 As per my trading style:
As #XAUUSD approaches the blue circle zone, I will be looking for bullish reversal setups (like a double bottom pattern, trendline break , and so on...)
📚 Always follow your trading plan regarding entry, risk management, and trade management.
Good luck!
All Strategies Are Good; If Managed Properly!
~Rich

Will Gold Hold at 2630? Key Levels for Bulls and BearsI'm eyeing a sell opportunity in gold (XAUUSD) , targeting the 2660 level for an ideal short entry. The price is expected to dip towards 2630 , a significant support zone, where a potential reversal could occur. If the market finds strength there, we may see a bounce as buyers step in.
Geopolitical tensions continue to support gold's safe-haven appeal, but a stronger dollar or global risk-off sentiment may keep downward pressure in the short term. Monitoring price action closely around these levels for potential setups.

GOLD REACHES NEW HEIGHTS AMID RISING SAFE-HAVEN DEMANDUS economic data
Positive news came from the jobless claims, which dropped to 241,000, much lower than expected and down from the revised 260,000 from the previous week. US retail sales also did better than predicted, rising by 0.4% from the month before, compared to an expected 0.3% increase. Nonetheless, positive retail sales and strong jobless claims are unlikely to alter the course of the Fed's monetary policy.
ECB rate cut
ECB cuts rates as expected and upcoming months will be crucial as the ECB evaluates economic conditions and decides on its future monetary policy approach.
US dollar index-
The US dollar index showed a minor decline due to profit booking. A break above 104 would confirm a continuation of the bullish trend.
Based on the CME FedWatch Tool, the likelihood of a 25 basis point rate cut in November has risen to 92.2%, up from 89.50% just a week ago.

SilverStill on the very same idea as yesterday, we got stopped out of the initial trade but getting a better price to work with, lets see how the next few days pan out, i am expecting to be stopped out a number of times due to election volatility but still we keep the same risk as usual, please trade with caution.
*Initial Idea*
The US Federal Reserve’s policy decision, set for Thursday, is capturing market attention. A 25 basis point rate cut is widely anticipated this week, with the CME FedWatch Tool indicating a 99.5% likelihood of this move in November. Such a rate cut could lend support to Silver, as lower interest rates decrease the opportunity cost of holding non-yielding assets.
In addition, expectations for further economic stimulus from China could enhance Silver's demand outlook. The Standing Committee of the National People's Congress (NPC) is convening for a five-day meeting from November 4 to 8, where a stimulus package possibly exceeding 10 trillion yuan may be approved to boost China’s economy. As one of the world’s largest centers for electronics, solar panels, and automotive manufacturing, China’s increased activity could significantly drive up Silver demand.
