XAUUSD: New All-Time High!Along with the undeniable Elliott Wave Theory, I am using the Fib Circles + Pitchfork tools to see if it will help pinpoint a specific date for Gold's anticipated reversal towards a new all-time high. Will XAU discover its true support on August 16th 22'? If not, what price target would you suggest?
Or...
Has bottom been found already and I've missed the boat!?
#SURF
Safehaven

Why Bonds Might Be Nearing LowsBonds have continued their decline as the markets price in a potentially historic FOMC rate hike this week. Inflation data suggests that the Fed's rate hike trajectory is not really working and inflation is still soaring. On the other hand, multiple indicators suggest that we are in a recession, and the Fed will have to pivot their hawkish stance after this last rate hike. If that is the case, then we expect the bond market to be nearing lows. We have one more technical level before we will have to start using inverse Fibonacci extension levels to predict lows in bonds again, as 113'12 is our last technical level. The Kovach OBV also appears to be leveling off. The next targets from above are 115'03 and 115'29.

New Lows for Gold!Gold has smashed through lower levels, giving up the 1700's entirely, and falling deep into the 1600's. We broke the lower anchor of our Fibonacci levels entirely, which we expected to at least provide some support. Currently we appear to have tested and broken our very last level at 1670. Inverse Fibonacci levels yield the next level below at 1658. The Kovach OBV is abysmally bearish but perhaps 1658 will provide support.

GOLD - Video Top-Down Analysis!Hello TradingView Family / Fellow Traders. This is Richard, as known as theSignalyst.
Here is a detailed update top-down analysis for GOLD.
Which scenario do you think is more likely to happen? and Why?
Always follow your trading plan regarding entry, risk management, and trade management.
Good Luck!.
All Strategies Are Good; If Managed Properly!
~Rich

XAUUSD LONG-TERM PLAN, Ideal prices for investmentGold is a practical and easy investment for anyone. For those of you who have medium or long-term goals, such as sending your children to a higher level or buying a house, gold investment is one of the keys. Gold often referred to as a safe haven asset, which is an asset that is known to be unrelated or has a negative correlation with other assets or investment portfolios when there is turmoil or uncertainty in the financial markets.
When global economic uncertainty and a decline in market participants' confidence in the government, the price of gold increases. In other words, gold is a valuable safe haven and can protect investors' assets during a crisis.
We know for now there is still a lot of uncertainty in financial markets, geopolitics, military, and disease outbreaks. Gold still tends in highly priced for long-term investment. Technically in the next few months gold may breakout from the green support area due to tightening monetary policy from the most central bank around the world. then towards macro support.
This is my strategy which can be seen in the chart of the best prices to buy gold for long-term investment.

Bond Market Continues to Price In Hawkish FedBonds have picked up slightly edging above 115'29. ZN had teetered about this level, breaking below it yesterday, but finding support. We did make a run for the next level at 116'20, but rejected this level, and found support again at 115'20. There is a stronger chance of a 75bps rate hike, which is pushing up yields. If we fall further, then 115'03 is the next target.

Gold Attempts Higher LevelsGold keeps testing 1735, the next level above 1729, our 0.236 Fibonacci level. We are edging above this level at the time of this writing. It does look like we are forming a bull consolidation pattern around 1735, potentially gearing up for a breakout. If so, the 0.382 Fibonacci level at 1758 is a reasonable target. If we retrace, we should hit support at the base of the 1700's, with 1705 in particular standing out as it has provided strong support in the past.

GOLD - Video Top-Down Analysis!Hello TradingView Family / Fellow Traders. This is Richard, as known as theSignalyst.
Here is a detailed update top-down analysis for GOLD .
Which scenario do you think is more likely to happen? and Why?
Always follow your trading plan regarding entry, risk management, and trade management.
Good Luck!.
All Strategies Are Good; If Managed Properly!
~Rich

GOLD - Video Top-Down Analysis!Hello TradingView Family / Fellow Traders. This is Richard, as known as theSignalyst.
Here is a detailed update top-down analysis for GOLD.
Which scenario do you think is more likely to happen? and Why?
Always follow your trading plan regarding entry, risk management, and trade management.
Good Luck!.
All Strategies Are Good; If Managed Properly!
~Rich

EURCHF: Rallies to be capped!EURCHF
Intraday - We look to Sell at 0.9639 (stop at 0.9659)
Our short term bias remains negative. Intraday rallies continue to attract sellers and there is no clear indication that this sequence for trading is coming to an end. 50 4hour EMA is at 0.9630. The previous swing high is located at 0.9656.
Our profit targets will be 0.9586 and 0.9576
Resistance: 0.9620 / 0.9640 / 0.9660
Support: 0.9600 / 0.9580 / 0.9560
Please be advised that the information presented on TradingView is provided to Vantage (‘Vantage Global Limited’, ‘we’) by a third-party provider (‘Signal Centre’). Please be reminded that you are solely responsible for the trading decisions on your account. There is a very high degree of risk involved in trading. Any information and/or content is intended entirely for research, educational and informational purposes only and does not constitute investment or consultation advice or investment strategy. The information is not tailored to the investment needs of any specific person and therefore does not involve a consideration of any of the investment objectives, financial situation or needs of any viewer that may receive it. Kindly also note that past performance is not a reliable indicator of future results. Actual results may differ materially from those anticipated in forward-looking or past performance statements. We assume no liability as to the accuracy or completeness of any of the information and/or content provided herein and the Company cannot be held responsible for any omission, mistake nor for any loss or damage including without limitation to any loss of profit which may arise from reliance on any information supplied by Signal Centre.

Gold Tumbles Through Major Support LevelsGold has plummeted, smashing through significant levels of support. We have broken through the 50% Fibonacci level at 1750, and are testing lower levels in the 1700's. Currently, we are in the 1740's and should see support from 1742 or 1747. The Kovach OBV has steadily declined, confirming the bear trend. If things continue in this manner then we should have support from 1729, teh .236 Fibonacci level. If we can muster the strength for a relief rally, the 50% Fibonacci level at 1780 is our next target.

$vet #vechain/usdt 1hr Vechain is essentially following $btc #bitcoins lead, which is short term bearish. I am neutral for now on $vet but long term very bullish, at the minute vet is going sideways but my target for end of year is $1 vechain vet. As the fundamentals are excellent, for example
#Vechain's partnership with PWC has been highlighted in the paper 'Importance Of Blockchain Within The Big 4 CPA Firms: Cryptocurrency’s Existence,
and #Vechain has also become the official Layer 1 #blockchain partner of the ufc in a historic global marketing partnership With 900 million+ households across 175 countries, $VET will receive unprecedented brand/asset integration. fundamentally vechain is a excellent choice to buy and hodl, but to trade in the short term is of course reliant on bitcoins movements, as with most of the market. i would spot buy for now and hold, and not buy on margin until we get some clarification what the market (btc intends to do). I provided some Ta on the 1 hour for those that do want to scalp trade, rsi's aren't to high but currently going sideways for today. thanks like and follow for more updates. Technically Bullish.

Bond Yieds RiseBonds have fallen further, breaking down past 119'01 into the vacuum zone below. We are still hovering above 118'04, the next level of support, but the Kovach OBV is looking pretty bearish. We are starting to see some green triangles on the KRI around 118'20, but we should have strong support at 118'04 if current levels do not hold. If we can pivot, then 119'01 should provide resistance.

GOLD - My Trading Plan in a picture!Hello TradingView Family / Fellow Traders. This is Richard, as known as theSignalyst.
on DAILY : Left Chart
GOLD is sitting around a strong support zone so we will be looking for buy setups.
Knowing that GOLD can still trade lower inside the support or even break it downward.
That's why we don't buy blindly, we always zoom in to lower timeframes and wait for the bulls to take over.
on M30 : Right Chart
GOLD is forming a channel in red but the upper trendline is not valid yet.
So we will be waiting for a third swing to form around it to consider it our trigger swing.
Trigger => waiting for that third swing to form and then buy after a momentum candle close above it.
Meanwhile , until the buy is activated, GOLD can still trade lower.
Which scenario do you think is more probable and why?
Always follow your trading plan regarding entry, risk management, and trade management.
Good luck!
All Strategies Are Good; If Managed Properly!
~Rich

Gold Rejects the $1800'sGold has rejected higher levels, and retraced to support. Recall that we are in a previous value area between 1795 and 1815, which coincides roughly with the 0.618 Fibonacci level at around 1800. We should see support from the lower bound at 1795, and potentially pivot and test 1815 again. This level should provide formidable resistance, confirmed recently by multiple red triangles on the KRI. If we fail to muster the strength to pivot from current levels, then we should see support around 1780, the 50% Fibonacci retracement level.

GOLD - Video Top-Down Analysis!Hello TradingView Family / Fellow Traders. This is Richard, as known as theSignalyst.
Here is a detailed update top-down analysis for GOLD.
Which scenario do you think is more likely to happen? and Why?
Always follow your trading plan regarding entry, risk management, and trade management.
Good Luck!.
All Strategies Are Good; If Managed Properly!
~Rich

Gold RetracesGold edged higher, breaking out of the 0.618 Fibonacci level at about $1800. However, we encountered resistance at the next technical level above, at $1815. Immediately, we saw the price action round off and retrace back to safety in the $1790's. We anticipate gold to establish value between $1780 and $1800 (two significant Fibonacci levels), unless more momentum can come through and help solidify the $1800's. The Kovach OBV is wavering, which suggests we do not quite have enough momentum yet to sustain a breakout.

Employment Data Hammers BondsBonds crept up but are facing resistance. After ZN tested highs at 121'28, and retraced, it started to establish value between 119'23 and 121'00. The latter has provided prohibitive resistance, as we have discussed this week, and we have seen a rejection, continuing the sideways correction. We saw a wick down to 119'23, where we found support, at first, but we subsequently broke through to the vacuum zone below. This follows Non Farm Payrolls coming in at a surprise beat, with unemployment at 3.5%. Expect support at 119'01.

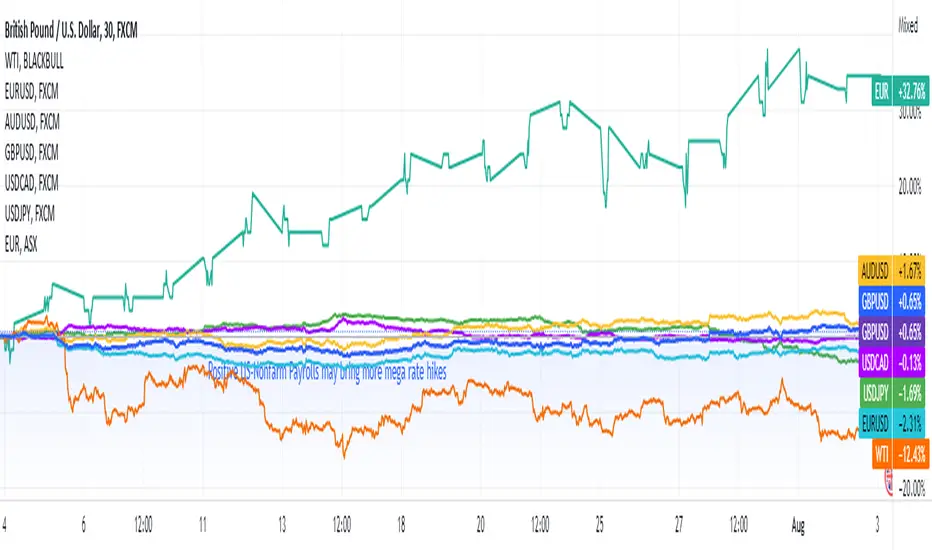
Risk aversion sentiment intensified from US-China tensionsEUR/USD 🔽
GBP/USD 🔽
AUD/USD 🔽
USD/JPY 🔼
USD/CAD 🔼
XAU 🔼
WTI ▶️
Investors flocked to safe-haven assets due to building tensions between the US and China, the greenback and gold had their prices recovered, when US stocks and indices took a hit. Gold futures closed at $1,789.7 an ounce, then slid from $1,804.8 to $1772.5.
A stronger dollar rebounded against other major currencies, and EUR/USD declined to 1.0164, currently trading flat. USD/JPY rose sharply to 133.16, almost gaining 150 pips. The loonie had a choppy trading session, USD/CAD eventually gained 31 pips to 1.2875.
Meanwhile, several Federal Reserve officials have implied further rate hikes to control soaring inflation. The comments have overshadowed an imminent interest rate increase from the Bank of England on Thursday, GBP/USD was weakened to 1.2172.
Despite raising rates on Tuesday, Governor Lowe of the Reserve Bank of Australia claimed “normalizing monetary conditions… is not on a pre-set path”, the relatively dovish comment led the AUD/USD pair to fall below the 0.700 level to 0.6919, losing over 100 pips in the process.
Market estimates have the US Crude Oil Inventories decreasing by 629,000 barrels, and WTI oil futures reached a high of $96.26 a barrel before closing at $94.42 with little change.
More information on Mitrade website.
Strong Rally in GoldGold has continued to rally, breaking through to the upper 1700's, and reaching our target of 1780. This is the 50% Fibonacci retracement level, which was our target from yesterday's report. A lot of buying momentum has come through for gold, which just a few days ago tested the low 1700's, with a relative low of 1684. As anticipated we are running into resistance here, confirmed by multiple red triangles on the KRI. If we are able to break through the next target is 1800, which is a psychological level and 0.618 Fibonacci level. If we retrace, we should have good support from 1758, the 0.382 Fibonacci level below.

Bonds Break OutBonds have lifted, breaking out of the narrow range held for the past three days. We broke the upper bound at 120'14, and hit our next target exactly at 121'00, as predicted. We are seeing red triangles on the KRI suggesting that we are facing resistance here. The Kovach OBV has picked up, suggesting genuine momentum may be back. If so, the next target is 121'28. If we retrace, we should have strong support from 120'14 and 119'23.

GOLD - Support Rejected✅ Now Approaching A Resistance!Hello TradingView Family / Fellow Traders. This is Richard, as known as theSignalyst.
As per my last analysis, we were looking for buy setups around the 1675 - 1700 support zone
Now What?
GOLD is approaching the upper orange trendline acting as a non-horizontal resistance.
Moreover, the zone 1750 is a support turned into resistance.
Thus, the highlighted purple circle with the red arrow is a strong area to look for sell setups as it is the intersection of the green resistance and upper orange trendline.
As per my trading style:
As GOLD approaches the upper purple circle, I will be looking for reversal bearish setups (like a double top pattern, trendline break , and so on...)
Always follow your trading plan regarding entry, risk management, and trade management.
Good luck!
All Strategies Are Good; If Managed Properly!
~Rich

We Want Our Safe Haven Back! Up!🥇Hello TradingView Family / Fellow Traders. This is Richard, as known as theSignalyst.
For those who know me well, know that I am a big fan of Gold, not as a long-term investment like I approach stocks and crypto, but as a backup plan if things go sideways.
By Gold, I mean physical, tangible Gold🥇. I regularly purchase an ounce every couple of months, depends on my budget, and stack it somewhere safe.
I learnt this habit from an Armenian friend. Shoutout to Armenians, you know exactly what I am talking about.
Now let's get back to the charts 😁
As per my last two analysis, we have looking for buy setups as Gold was approaching a support zone 1675 - 1700
Gold rejected our support zone and ended up closing bullish for the week.
But the question is... are you finally bullish?
Not Yet❗️
For the bulls to take over from a long-term perspective, and as per my trading plan / style, we still need a new major high to form.
and then, a break above:
i- this new major high (projection in purple)
ii- 1750 - 1760 zone
iii- upper orange trendline
then, we will be expecting a shift in momentum from bearish to bullish📈.
Always follow your trading plan regarding entry, risk management, and trade management.
Good luck!
All Strategies Are Good; If Managed Properly!
~Rich
