SAND DESCENDING TRIANGLE PATTERNSAND BINANCE:SANDUSDT is forming a Descenidng Triangle pattern....
I know that in Technical terms, it is mostly regarded as a sign of bearish pattern.... But sometimes it can be powerfully Bullish too!!
I think it might fool sellers when it make a pullback near Demand zone and might continue back to the 1st Target area...
If you can relate.... then please like and ask any comment you guyzz have!! (:
SAND

Trading opportunity for SANDUSDTBased on technical factors there is a short position in :
📊 SANDUSDT
🔴 Short Now 1.2824
🧯 Stop loss 1.5400
🏹 Target 1 1.1100
🏹 Target 2 0.9000
🏹 Target 3 0.5700
💸Capital : 1%
We hope it is profitable for you ❤️
Please support our activity with your likes👍 and comments📝

sand/usdtTesting/tracking elliot wave theory. Please do not trade off idea without S/L. Not financial advice.
With the recent events on cryptocurrency; I think we will start seeing less coins getting pumped and more of the solid coins getting attention. By solid, I mean coins that actually has a project and some kind of revenue coming in. Currently a lot of coins are back to prices of last year, if not, then lower. This makes it a great entry point for those that wanted to get in a few months ago, but thought prices were too high. Sand's (4th) wave count has retraced to the peak of wave (1) and bounced nicely. This is usually a good indication that the bottom is in. We don't normally enter wave 1 territory unless btc does something drastic. The market sentiment is still uncertain and people are fearful, which makes it a perfect opportunity for institutional investors to start investing.

SANDUSD Buy Above Downtrend LineThis chart shows periods of sharp growth followed by a down period
So far the pattern has repeated twice
A third up move is up coming next if the pattern repeats again
This will most likely occur once price breaks the orange downtrend line
Price once upward break out will most likely reclaim the weak yellow uptrend
Weekly Chart


[ALTCOIN] SANDUSDT CRYPTO SIGNALS TREND LINE ANALYSISHello, everyone
We're a team that specializes in chart analysis
We will always analyze and provide you with charts to help you sell
There are so many trading laws and there are so many good technologies that come with them, but I'm confident that the trend line is really strong.
If you read the point of view and get to know the line, every line will adjust
Thank you.
------------------------------------------------------------------------------------------------
Chart Analysis Content -
The rebound came from the thick white upward trend, and like PEOPLEUSDT, the candle is rising after checking the bottom once more.
It will break through the downward trend of bold red and cross the downward trend of bold yellow after crossing the downward trend of bold yellow.
And if we go up to the upward trend of thick sky blue, we can go up to the position we expect.
The most important point is to test it after breaking through the thick red downward trend line and what kind of movement it shows.

SAND/USDT Technical Analysis overview#SAND Chart Analysis:-
- $SAND trying to bounce from support because now holding $1 support levle.
- If hold $1 Support then we can see $2.10 ( 100% Move from here
- Below $1 is super bearish and expect to Test $0.5 and $0.2 ( we can expect more then -50% dump below $1
- Placed Stop Loss after opening any trade because Market is very volatile.
thnak you

SANDBOX ⌛🦜 - Breakout is Promising 🏴☠️☠The market volatility is On.
For some, the worse has already happened, for others the dip is not over yet.
For us it's all about Technical Analysis so here we go:
Breakout for SANDBOX is promising and the price has consolidated enough.
We see support at 1.345 and 1,25 and a target of 1.71 resistance.
One Love,
the FXPROFESSOR

[ALTCOIN]SANDUSDT FALLING WEDGEHello, everyone
We're a team that specializes in chart analysis
We will always analyze and provide you with charts to help you sell
There are so many trading laws and there are so many good technologies that come with them, but I'm confident that the trend line is really strong.
If you read the point of view and get to know the line, every line will adjust
Thank you.
------------------------------------------------------------------------------------------------
Chart Analysis Content -
#SANDUSDT FALLING WEDGE
It's a coin that our team is keeping a close eye on in the market now.
It has not gone down to a place that should never be broken, and the angle is low, but it is one of the few coins that still has an upward trend.
It is forming a downward wedge based on the 4h and I think it is almost at the end.
So I'm thinking about the painting that I'm raising, and first of all, I have to put it up through the resistance at the top of the most important wedge.

SAND - Falling Wedge bullish pattern?💎Throughout this year SAND has been trending down, but perhaps this was only a corrective pattern of a major bullish trend?
💎The pattern, started back in November 2021, is identical to a Falling Wedge pattern, which most of is bullish. Wave five could be ending any time, and once completed, we are likely to see a price rally. Still, Paradise Team is waiting for a few more confirmations .................

SAND/USDT LONG SCALP SETUP!Hello everyone, if you like the idea, do not forget to support with a like and follow.
Welcome to this SAND/USDT TRADE setup. SAND looks good here.
SAND is breaking out from the cup and handle pattern in 1hr time frame. After the breakout retest is also done. Long some now and add more in the dip.
Entry range:- $1.34-$1.38
Target1:- $1.46
Target2:- $1.58
Target3:- $1.76
Target4:- $1.90
SL:- $1.28
Use low leverage (4x-6x)
If you like this idea then do support it with like and follow.
Also, share your views in the comment section.
Thank You!

SANDUSDT◻️SAND has broken an uptrend that lasted almost two years.
◻️If you take it apart from the technical side: I would not consider this asset now, after the trend breaks.
🔥Subscribe to my Tradingview profile

SHORT TERM TRADE IDEA FOR SAND/USDTTrade is based on the daily time frame and bullish divergence formed, Use a stop loss
Entry is based on the rising wedge pattern/ channel formed on the 3 min chart as shown below;
Target is horizontal or channel resistance
Apply proper risk management!

SANDBOX - The Storm Could Still not be overOur updated Sandbox chart: resistance 1t 1.68 and 1.54 are a concern and in case of a third storm (watch the video coming up and you will understand) we should be prepared for a further drop.
We find this chart off balance and with the next support level very far away at 35 cents.
The 1$ mark will also play the role of support (in case we are going even South-er).
So..let's be careful
One Love,
the FXPROFESSOR
PS. SANDBOX IS AVERY PROMISING PROJECT, YES, THAT DOES NOT CHANGE. bUT TECHNICALLY WE PREFER TO BUY OVER RESISTANCE (1.68$) OR MUCH LOWER

SANDBOX - Our Level WorkedYesterday's dip offered opportunities for Buying. Out of our 2 attempts Luna went bad (thankfully it did rise 6% before dropping back below) and Sandbox went really well:
Our outlook is not great at the time as we see Bitcoin trapped and most likely sideways for a while:
Regardless, Sandbox idea went textbook perfect. Let's hope it continues to rise.. we have secured some profit just in case.
One Love,
the FXPROFESSOR

SANDBOX- On Major Support Now (Bargain?)SAMDBOX has started rebounding off support and this is encouraging.
This is our updated chart with key levels, suitable for spot and leveraged trading.
Let's hope the market can recover some of it's recent wounds now.
One Love,
the FXPROFESSOR

$SAND where is it going ?what about now ?
well, there's still more room for $SAND to fall
it's either the price does a double bottom now and goes back up in a healthy way (meaning reversal to the upside)
or it could dive (or slow bleed) to 1.20$ ~ 0.79$
nfa dyor
I could be wrong, u know :)...

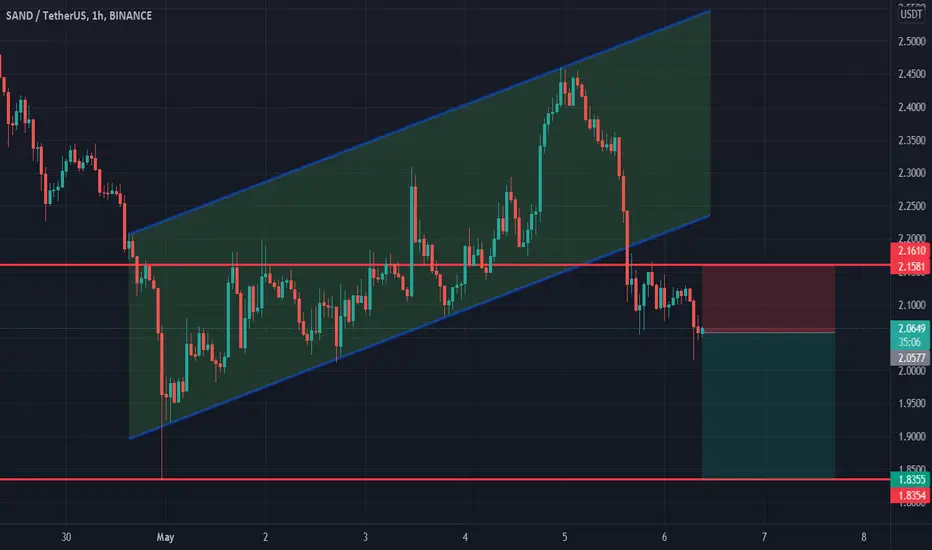
The Sandbox shortThe Sandbox broke trough off the lower boundary of ascending channel. Asset broke trough off the support level. Bearish movement to support level at 1.8355 is expected to happen.
📊SAND: is huge PUMP coming? Half-year downtrend come to an end!🎯Sandbox (SAND) is one of the top game-fi projectsand has been in a downtrend for 161 days. The price has fallen from the highs by 78%. Traders with margin positions were liquidated on the last DUMP - this is shown by Volumes.
🔶 On the chart I have marked such important zones:
support zone - $1.99-$2.20
huge value zone - $2.47-3.35
value zone - $3.97-$4.33
I mark these zones with horizontal volumes. If you don't know how to use them, let me know in comments! I`ll make a education idea for you!
The price rebounded from the $1.99-2.20 support zone and broke the trend line. But a local pullback is possible.
Globally , it is important to look at the price reaction when the global trend line is tested. If the price starts pushing under it, it is very possible for SAND to reach the zone of $3.96-4.33.
After such a long downtrend, many traders and investors closed their positions at a loss or break-even and do not want to buy, although if Bitcoin continues its uptrend, the price may renew its ATH.
Friends, press the "like"👍 button, write comments and share with your friends - it will be the best THANK YOU.
P.S. Personally, I open an entry if the price shows it according to my strategy.
Always do your analysis before making a trade.


Sand To infinity...and beyond!sand is rdy for the next pump and its gonna be huge! it has good funda and good looking chart jump in the bus so u dont miss this opportunity!
comment ur idia im happy to hear them <3

Sandbox following the same double bottom pattern as most altsYet another alt with the same pattern. It’s currently above its smaller double bottoms neckline and will likely confirm a breakout from that zone in the next couple daily candles.

SAND DESCENDING TRIANGLE PATTERNSand is looking bullish…. But for now, I want the market to make one last pullback to eat already entered buyers SL’s and then what can happen is that SAND can take support from its demand zone and can continue to go on to break the descending triangle pattern upwards…
I am thinking of entering around 2.40 - 2.45 level….
1st Target → 2.55
If it keeps on going, then I'll think of trailing my stop loss and continue the ride…
Hope you like it and plz press the follow button to support my ideas (:
(((((NOT A FINANCIAL ADVICE)))
BINANCE:SANDUSDT
