BREAKOUT IMMINENT ON SAND/USDT BULLISHSand has been on a major downtrend since its 8.48usdt ATH price level on November 25 2021, with a steady decline in volume. A potential breakout looks imminent once we are able to break out of the major downtrend and with the entire crypto market looking bullish again.
SAND

Sand Next Level$sand #sand Broke through resistance but still waiting on a H4 close above. Zoom out and you can see a Inverse HnS breakout with PT lining up with top of this zone at 5.75.
——————————————————————————————
Top 10 trading tips:
1. DO NOT FOMO into a trade. Let it come to you. Don’t force it.
2. Find a strategy that works for you and be consistent. Operate like a machine and less like the wind.
3. Let your winners run and cut your losers short.
4. You will not win every trade, but if you are disciplined with great RM you don't need to be right all the time to win!
5. Before you enter a trade, know your target AND your exit strategy.
6. When you are up, you can use a trailing stop or trim off some profit at a logical resistance point with a stop loss at breakeven.
7. Set your trade parameters up front so you keep your self accountable and remove emotions from the equation. (stop loss, take profit levels, etc)
8. Don't fight the trend. The trend is your friend.
9. Don’t enter a trade based on one indicator.
10. Horizontals > Diagonals
Please note:
- This is not financial advice.
- I do not take every trade I post.
- Never trade off of someone else's chart until you DYOR!

SandSand is at crucial trendline resistance. Breaking above the trendline will lead to 5.21 and 5.67

Buy now ! Buy everything now ! Using low leverageNow I think it is the temporary bottom. You can buy everything now with a very now leverage (1.5 - 3 times)

SAND - descending wedge and rounding bottom forming?Target 6.5 (already visited that price area last month)
Need move to upside to complete pattern
BTC is screwing alts over currently, idea might not come to fruition if BTC tanks more
Comment if you agree/disagree!
As always, NFA!

Going to break through corrective channel$Sand looks like correction over. but we need to wait break out from the corrective channel first

An important resistance level for SANDMy strategy in this area is selling price.
I do not see purchasing power in 4-hour time, and we also have a double-roof pattern in 1-hour time.
Hope this helps

DESCENDING TRIANGLE u can scalping it before the downtrend and short after the breakout or bouncing after candle touch the massive support

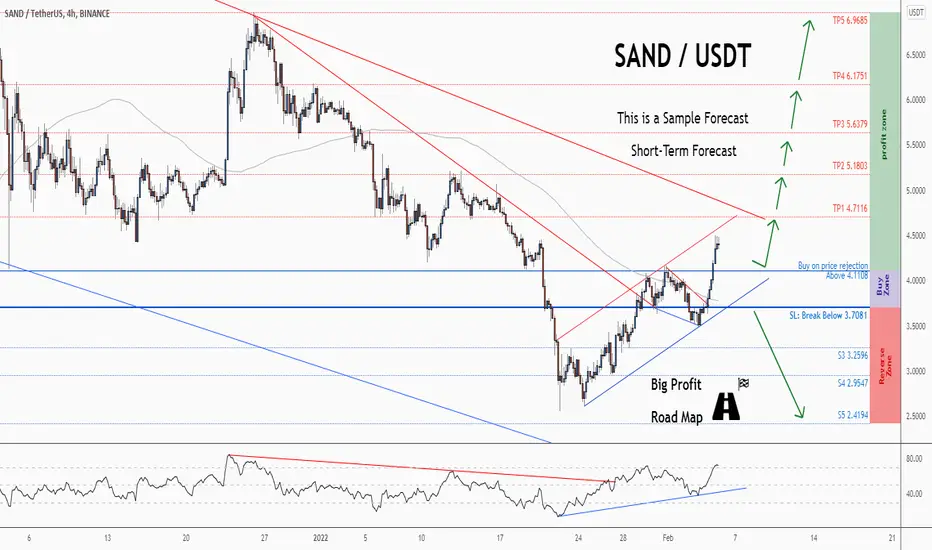
💡Don't miss the great buy opportunity in SANDUSD Trading suggestion:
". There is a possibility of temporary retracement to the suggested support line (4.1108).
. if so, traders can set orders based on Price Action and expect to reach short-term targets."
Technical analysis:
. SANDUSD is in a range bound, and the beginning of an uptrend is expected.
. The price is above the 21-Day WEMA, which acts as a dynamic support.
. The RSI is at 71.
Take Profits:
TP1= @ 4.7116
TP2= @ 5.1803
TP3= @ 5.6379
TP4= @ 6.1751
TP5= @ 6.9685
SL= Break below S2
❤️ If you find this helpful and want more FREE forecasts in TradingView
. . . . . Please show your support back,
. . . . . . . . Hit the 👍 LIKE button,
. . . . . . . . . . Drop some feedback below in the comment!
❤️ Your support is very much 🙏 appreciated!❤️
💎 Want us to help you become a better Forex / Crypto trader?
Now, It's your turn!
Be sure to leave a comment; let us know how you see this opportunity and forecast.
Trade well, ❤️
ForecastCity English Support Team ❤️
💡Don't miss the great buy opportunity in SANDUSD @TheSandboxGamTrading suggestion:
". There is a possibility of temporary retracement to the suggested support line (4.1108).
. if so, traders can set orders based on Price Action and expect to reach short-term targets."
Technical analysis:
. SANDUSD is in a range bound, and the beginning of an uptrend is expected.
. The price is above the 21-Day WEMA, which acts as a dynamic support.
. The RSI is at 71.
Take Profits:
TP1= @ 4.7116
TP2= @ 5.1803
TP3= @ 5.6379
TP4= @ 6.1751
TP5= @ 6.9685
SL= Break below S2
❤️ If you find this helpful and want more FREE forecasts in TradingView
. . . . . Please show your support back,
. . . . . . . . Hit the 👍 LIKE button,
. . . . . . . . . . Drop some feedback below in the comment!
❤️ Your support is very much 🙏 appreciated! ❤️
💎 Want us to help you become a better Forex / Crypto trader ?
Now, It's your turn !
Be sure to leave a comment; let us know how you see this opportunity and forecast.
Trade well, ❤️
ForecastCity English Support Team ❤️

Sand Scalp short positionSand has made a nice bull run recently and we had a full target on swing trade on it
I guess by breaking down from this triangle we may have a nice opportunity to open a short scalp position on it

SANDbox Beauty and perfectionIt is impossible to ask for more perfection to SANDbox. It has waves 1 and 2 (yellow) in place and is now at the heart of wave 3 (yellow). Wave 3 itself has 5 waves, of which wave 1 and 2 (white) have been built. Wave 3 of 3 (white) is in progress nad touched extension 1,236 and retraced to the 0,764 extension. This is textbook behavior. Now SAND is going to continue the upside movement to end wave 3, 4. and 5, which will complete all of wave 3 (yellow.). Ideal target is at 150. This is the region of confluence of 2,618 extension and 2,00 extension.

Update: #Sandbox #SAND 's 6 tasks on the daily chart ...Sandbox´s 6 tasks on the daily chart ...
1. break the FIB golden pocket (done)
2. break the RSI resistance (done)
3. hold the OBV support (done)
4. hold the FIB 0.786 and volume support (done)
5. flip the MA Ribbon bullish
6. confirm breakout(s) and have fun 😎
What do you think? 😎
Drop me a nice comment if you'd like me to analyze any other cryptocurrency.
*not financial advice
do your own research before investing

⌛🦜 SANDBOX = Winner 🏴☠️☠SANDBOX will keep out-performing the market. This is our updated chart with key levels to watch out for.
News:
Bitcoin jumps 10%, climbs past $40,000 for first time in 2 weeks
The world’s largest cryptocurrency climbed by the most in more than three months.
The big cryptocurrencies have been largely trapped in a range over the past couple of weeks, after experiencing widespread declines in January.
Bitcoin gained the most in more than three months as investors show signs of renewed risk appetite following a volatile week across financial markets.
The largest cryptocurrency by market value jumped as much as 9.4% to $40,426, the most since Oct. 15. It hasn’t been above $40,000 in more than two weeks. Ether climbed as much as 11%. Even SOL, the native currency of the Solana blockchain that has tumbled in the wake of the Wormhole project hack, surged about 10%.
You had been warned:
1. Our projection at the last post of 2021 was a dip first to 38k (finally it was 34k) and a rise to 79k (hopefully we are JUST A TINY BIT wrong again and it goes to 80k+):
BITCOIN 2022 - 38k First - 79k Then
2. We bought the dip perfectly and shared it here with you:
BITCOIN- Is this the Rainbow
3. Despite the FUD and some negative comments from some of you, we had estimated the NFP will play a role and it did. From now on: start understanding the fundamentals:
BITCOIN - Video Update (NFP tomorrow will be HUGE!)
04:07
Hope you enjoy our charts and analysis.
One Love,
the FXPROFESSOR

$SAND What's Next?Morning Everyone! 😃
I decided to post some Alt Coins to show you some of the stronger ones that I'm personally trading.
The first Alt Coin I would like to look at is The Sandbox $SAND .
In case you are not familiar with it, on the left you can find some basic fundamentals .
Bitcoin Influence:
Here we see BITCOIN and the local support/resistance areas:
As you can see I marked some levels (A,B,C) those are the support levels that could dictate where SAND is headed to next.
For example if BTC loses the support in area A, SAND will likely also lose support A, etc.
Resistance:
As far as Resistance levels go, if BTC can clear the 39K-40k area we can see SAND go to our first targets (1,2) at around 5,2$-5.5$.
I would like to add that this is only for educational purpose and in no way a guarantee that it will play out this way, nor is this or are any of my posts financial advice.
As always, A BIG THANK YOU for stopping by, I hope you liked my post! If you did, please take a second to drop a like or comment, every engagement puts a smile on my face, but also helps me to get my ideas out to many more of you guys! 😃🙏
Happy Trading ✌♥📈

Short SANDUSDTShort SANDUSDT
Im looking to short SANDUSDT after a 6h close below 3.65
1st Target - 3.31 zone
2nd Target - 2.99 zone
invalidation daily above 4.22

SAND/USDT Growth after rollback to 3.55Growth after pullback to 3.5500
1. Broken level
2. The price did not go down, there is no update of the lows
3. Positive dynamics in the market
4. Breakdown of resistance is true.

MANAOn a 4-hour TF, The trend is negative. If it can break the resistance of $1.3 and the negative trend line with high trading volume, the target of $3.4 will activate. Otherwise, I expect the correction to the $ 2.6 range. #Mana's price floor is in the range of $ 2.3.

SANDUSD GLOBAL VISION OUTLOOKSAND/USDT
SAND have 2 probabilty
I prefer for the bearish one.
We need more confirmation for now, market still unstable
Speculate not help for now, very big risk
If SAND going up, Elliot Wave correction ABC has done, and go other impulsive move again.
#tipsfortradingplanning

SANDUSDT 1D (Clean Chart)Always keep an eye on the volume.
A clean chart SANDUSDT based of Volume Profile and The volume-weighted average price VWAP (A measurement that shows the average price of a security, adjusted for its volume).

SAND breakoutSAND is breaking out the downtrend now. If the daily candle closes above ~$4.1, we can long safely.
Please hit the like button if you agree :)
Thanks

[crypto] The Sandbox - SAND - What cryptos have potiential?The Sandbox - SAND - Metaverse crypto - still in the news and technicals are pointing to the bullish side again. Use Pullback alerts for stop loss or 'Profit Lock'. Edutainment Purposes Only!

