SAND is so bullish, Where is the next potential target?#SAND Mid term Update
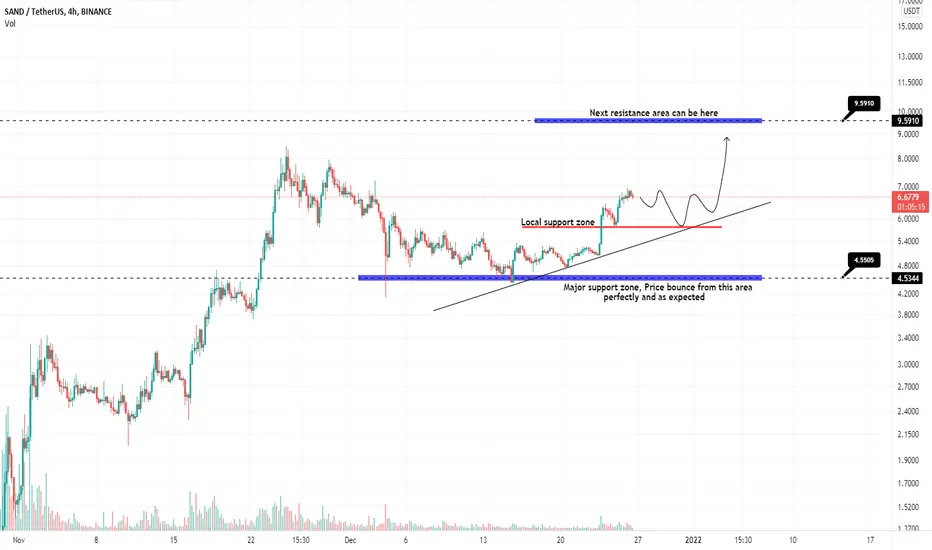
SAND bounced from 4.5$ support area as we expect. Now the next target for this coin can be 9.6$ area which is a potential resistance zone.
Some pullback up to Local support area and dynamic ascending trend line is possible. Don't forget that, The dynamic support must be kept.
SAND
Sand/Usdt - Easy 50% potential from hereSand broke through and then retested the golden pocket on Fibonacci, and now it looks good for 50% profit.
Entry: 6.53 - 6.33
Targets:
- 7.57
- 8.49
- 9.48
- 9.9
SL: 1 day candle close below 5.76$
* Not an advice to buy or sell.
* Do your own research.
* Entering the trade is on your own risk.
Leave a like if you like the idea, and tell me in the comments if you agree with me.

SANDUSDT is going up. SANDUSDT is going up. It May retest the resistance it had gained a correction.
Thanks and happy trading.

SAND TRADE COMPLETEDGreat result with the SAND trade. Hopefully anyone following liked the good result.

SAND LONG POS ×3 - ×5Hi guys
It can be expected to grow up to 7.3, if you enter with leverage of 3 or 5, you will get a good profit.
Do not forget to set the SL
LIKE IF YOU LIKE

Sand / UsdtI think Sand / usdt , making cup pattern soon.
if SAND breaks the Yellow resistance lines , this analysis clould happen soon.

Bitcoin's Path to a New ALL-TIME HIGH [12-24-21 Update]Now that Bitcoin has settled down after this correction, there are two paths for Bitcoin to continue up from here.
1. Bitcoin goes parabolic from here with no stops (or limited stops) until it creates a new next All-Time High
2. Bitcoin creates a reverse Head & Shoulders pattern, then goes parabolic until it creates a new All-Time High

SAND flag limit shows an uptrend As we have got FTR zone at price 5, an uptrend toward $12 is targeted.

10th Series of Altcoin Buying Areas! Anniversary! ;)Hi,
This year I started with a series that was, to a greater or lesser extent, very popular. Of course, this is also due to the fact that there have been mentioned buying areas in this series that have made 1,000 and more percent.
Now this time it is the last one in this year and great to finish it with a round number - TENTH "episode" ;)
So let's start it, probably everyone knows the rules already but just in case I will repeat it for my new followers:
1) Comment THREE of your favorite altcoin, not ten not five, THREE!
2) Name only the ticker - Bitcoin is incorrect, correct is BTC ;)
3) Hit the LIKE button!
4) If you don't already follow me then hit the button to get the update as fast as possible.
Only four simple steps and your named coins will get into the list!
As always, TOP mentioned altcoins get analyzed - pointing out breakout areas and if there are some logical price zones after a possible correction (atm this topic will be quite actual because probably we can see some lower prices as well) then also pointing out these levels from lower prices!
Regards,
Vaido

Quick 27% Profits Out of SANDSmashed our 1 & 2nd profit targets on this sand setup I posted.
Did you get in?

🔥 SAND Massive Bounce: New All-Time High Soon?Since Bitcoin made a huge move earlier this week, SAND has seen a very strong bounce from $5 to $6+.
I'm expecting the price to show some minor consolidation over the coming day or so. Assuming BTC will either remain stable or move up again, I'm expecting SAND to continue to move up.
Targets placed at $7 and $8. With the right market conditions, it would be possible to trade at a new all-time high again within the next 10 days or so.
Happy trading!

Sand GOing for Huge LEG UP! (AXS the 2nd)obvious ascending triangle forming here.. Sand GOing for Huge LEG UP! (AXS the 2nd) Sand GOing for Huge LEG UP! (AXS the 2nd)

SAND Support at 6.14$Hey guys, as we can see Sand tried 4 times to break the resistance ( the white circles). At the 4th. try it breaked trough and now we have support at 6.14, thats the 0.5 FIB line ( green one)
I'm happy that sand is back and I hope we gonna see 7-10$ soon after Adidas partnership and land sale.

SAND TRADE UPDATEAs per previous trade entry idea we have now almost completed the trade, looking at a bit of retracement with BTC movement but should hit target with no real resistance before target.

SANDUSDT - 4Hsee and watch :)
The price after breaking the trend line and also the resistance of the red range, a pullback will probably hit the broken resistance and then go to the specified target ...

SAND continuation of a stable trendSAND is steadily continuing its path, the situation is calm and good for the potential future of the Metaverse (we live in interesting times)

Is it a valid Fibo fan?if consider this Fibo fan valid the reversal point of The SandBox is $13.6 at 22 March.

SAND sideways trend and slow stabilizationSAND looks stable at the moment, the support line has not been broken, we will see how strong the impact of BTC will be on the situation of SAND on the chart

[crypto] The SandBox - SAND - Starting to wake up?The Sandbox - SAND - Starting to show some bullish signs? We will see? Edutainment Purposes Only!

Sand Descending channelBuy the breakout of this descending channel.
Plenty of potential upside to come. Sand is a huge Metaverse coin, if we break out upwards, we could see some nice price movement this week.

Sand - Resistance broken!As we can see resistance finally broken! Sand made triple bottom.
If SAND holds above resistance and of course if “daily close” above resistance then we could see more bullish pressure arise!
Targets 5.80 - 6.30

SAND slow stabilizationSAND is currently in a stable situation, slight price fluctuations are not a big problem, the situation looks transitional and soon we will see big things (metaverse)

Time to Buy SANDBuy: $5.1 - $5.25
Nice inverse head and shoulders forming.
Stop loss 15 min candle close below trendline support
