Sandbox (SAND): Metaverse with Biggie's LegacyDec 9
Hello Virtual World Explorers!
👋 The FXProfessor here, bringing you the latest buzz from Sandbox (SAND), an Ethereum-based metaverse game making waves with its innovative collaborations.
The Notorious B.I.G. Experience in The Sandbox:
🎤 A tribute to the legendary rapper, Notorious B.I.G., is now live in The Sandbox. This collaboration brings a unique Brooklyn, New York-inspired area to the metaverse.
🕹️ Dubbed “Breakin’ B.I.G.,” this experience allows players to interact with Biggie’s avatar in a 2D, arcade-style world, engaging in quests that reflect the rapper's iconic legacy.
New NFT Avatar Collection:
🖼️ Alongside the B.I.G. experience, Sandbox is set to release a new NFT avatar collection, further bridging the gap between the crypto world and popular culture.
🌉 This update marks a significant expansion of Warner Music Group’s social hub within the game, offering a rich, interactive Brooklyn environment for players.
Sandbox's Metaverse Vision:
🚀 The Sandbox continues to push the boundaries of what's possible in virtual worlds, integrating elements of music, culture, and gaming.
🌐 These collaborations exemplify how blockchain technology can merge with entertainment, creating immersive experiences that redefine user interaction in the digital realm.
My personal Take:
🌟 Sandbox's ability to blend iconic cultural elements with cutting-edge blockchain technology showcases its potential as a leader in the metaverse sector.
💭 Imagine the possibilities as we witness more such innovative collaborations in the metaverse, transforming how we interact, play, and commemorate legends.
Stay curious, dive into the metaverse, and let's explore the endless possibilities that Sandbox (SAND) has to offer!
One Love,
The FXProfessor 💙
Link: decrypt.co
SAND

SAND/USDT Bracing for a Bullish Reversal? 👀 🚀Thesandbox💎 Paradisers, spotlight on #SANDUSDT as it crafts a compelling narrative in the current market landscape. Recently rebounding from resistance, it is now fortifying its position at a pivotal support level, signaling a potential upswing in its market journey.
💎 #TheSandbox, in its recent market dance, has elegantly maneuvered through descending channels, breaking upwards with notable momentum. After conquering the resistance at $.4759,it is now navigating the $.5978 level, retesting what seems to be transforming from resistance into a strategic support zone. This shift could potentially catapult NYSE:SAND into an upward trajectory, targeting higher resistance echelons.
💎 However, as we chart these digital sands, #SAND traders must remain astutely prepared for the market's dynamic tides. In the event that it encounters resistance headwinds and starts to waver, a pivot to a strategic rebound from the support level of $.3640 might be imperative.
💎 Should #SAND descend beneath this critical support threshold, a strategic recalibration becomes paramount. This situation would demand a nuanced reassessment of the bullish stance, requiring a savvy adaptation of trading strategies to the evolving contours of the market. 🌴💰

#SAND/USDT#SAND
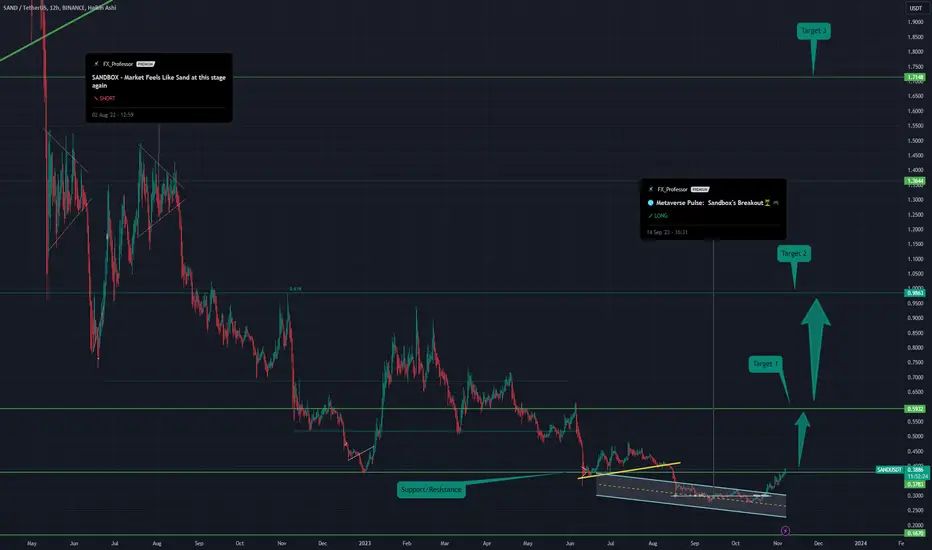
The price has broken out of the large descending triangle since last March
The trend was retested and returned upward, supported by the rise of Bitcoin
Looking at the previous triangle patterns, each breakout is strongly bullish
We expect a strong rise after breaching the current triangle
With an initial goal of 170%
After that, we expect a second goal of 250%.
All of this is due to the rise of Bitcoin to reach strong areas soon

SAND/USDT Break out the Bullish pattern. Ready to continue UP ??💎 SAND is currently in the spotlight within the market, achieving a breakout from a bullish flag pattern. It is now approaching a local resistance point at $0.425. Should SAND successfully break through this resistance, it could pave the way for a continued ascent towards a stronger resistance area.
💎 However, if SAND struggles to surpass this resistance, it may face a downturn, leading to a retesting phase at the demand zone between $0.4 and $0.41.
💎 In this demand area, it's crucial for SAND to exhibit a strong bounce. Failure to do so could result in the loss of this zone. If such a scenario unfolds, SAND could then be heading towards a test at the support level around $0.357.
💎 A particularly concerning situation would arise if SAND also breaks down from this support level, which could lead to a continued downward trajectory towards a more substantial demand area.

SAND/USDT Had a Good Run | 👀🚀What's Next for the SAND?💎 Paradisers, turn your attention to SANDUSDT, which is currently showing a promising setup in the demand zone, enhanced by a recent Market Structure Shift (MSS). This configuration indicates a considerable potential for a bullish trend.
💎 In examining SAND's pattern, Sandbox has a notable track record of breaking above its descending trendline, a clear signal of bullish trends. Presently, it's confronting a significant Bearish Order Block (OB) challenge, with ongoing momentum above the EMA100, aiming for supply targets at $0.61 and $0.70.
💎 Given the ever-changing nature of the crypto market, SAND traders should be ready to adapt to different scenarios. Should the anticipated bullish breakout not materialize, shifting to a rebound strategy from the support level at $0.38 will become crucial.
💎 If SAND falls below this support level, a change in strategy will be imperative, signaling the need to rethink the bullish perspective and adjust trading strategies to align with the new market conditions.
💎 Stay alert and tactically prepared, Paradisers. Your ParadiseTeam is dedicated to providing you with insightful analysis and guidance, ensuring you make well-informed trading decisions in these dynamic market scenarios.

MANA Suggests SAND will Push HigherComparing these charts suggests SAND will go higher to follow MANA. They both are following the exact price action, and MANA is currently retesting 200ema, whereas SAND is lagging behind.

SAND showing a very impressive investment opportunityHi Everyone;
today we have one of the best risk to reward Investment opportunity
it is more than 550 times the risk and the chart is look very promising.
I expect breaking the previous bear market key point will clear the way to the final target

🔥 SAND Finally Breaking Out Through 1.5 Year Resistance?SAND has been trading below this bearish resistance line for well over 1.5 years. With the market going up in general, is it finally time for this token to break out?
I'm waiting for SAND to close a daily candle above 0.47, stop below the most recent swing low, target at 1.48. This way we can construct a very decent swing trade with a risk-reward of ~12.5.
Time will tell if SAND will show us long-term strength like last cycle. For now, we're keeping our long-term target relatively close.

🏖️ SAND's Bullish : Descending Wedge BreakoutThe crypto seas are witnessing the rise of Sandbox's native token, SAND, as it navigates a bullish pattern amidst market dynamics. In this exploration, we dive into SAND's chart, unveiling a compelling narrative of a descending wedge and a strategic reaction to a weekly imbalance.
Chart Analysis: The SAND Dunes Unveiled
SAND's recent price action has painted a fascinating picture on the charts, with the formation of a descending wedge—a classic bullish pattern signaling potential upward momentum.
Key Observations:
Descending Wedge Overview:
SAND's price movement has been confined within the walls of a descending wedge.
This pattern, characterized by lower highs and lower lows, often precedes a bullish breakout.
Strategic Response to Weekly Imbalance:
SAND has exhibited a noteworthy reaction to a weekly imbalance point.
Imbalance zones often act as catalysts for price reactions, serving as pivotal levels for traders.
Critical Levels: SAND's Journey to $1.6
Wedge Breakout and Liquid Pool at $1.6:
The breakout from the descending wedge is a crucial milestone for SAND.
The $1.6 level marks a significant zone where a liquidity pool has congregated.
Potential Scenarios: SAND's Expedition to $1.6 and Beyond
Wedge Breakout and Momentum Surge:
A confirmed breakout from the descending wedge could trigger a surge in bullish momentum.
Traders are keenly eyeing the $1.6 level for potential liquidity-driven movements.
Validation through Imbalance Response:
SAND's acknowledgment of the weekly imbalance further validates the bullish narrative.
A combination of technical patterns and strategic reactions enhances the confidence in potential upside movements.
Trading Strategy: Navigating the SAND Dunes
For traders considering SAND in their portfolio:
Wedge Breakout Confirmation: Wait for a clear breakout from the descending wedge before entering positions.
Targeting $1.6: Identify strategic entry and exit points around the $1.6 level, considering the liquidity pool dynamics.
Risk Management: Implement effective risk management strategies, given the inherent volatility in crypto markets.
Conclusion: SAND's Ascent and the $1.6 Oasis
As SAND charts its course within the bullish descending wedge, the $1.6 level emerges as a potential oasis—a liquidity-filled pool awaiting exploration. Traders and enthusiasts are watching closely as SAND seeks to transcend its current patterns and dance to the rhythm of a potential bullish symphony.
🏖️ SAND Analysis | 📉 Descending Wedge Breakout | 🎯 $1.6 Liquidity Oasis
❗See related ideas below❗
Have your grains of SAND ready for the bullish tide? Share your thoughts, analyses, and predictions in the comments, contributing to the collective wisdom of the crypto community. The journey through descending dunes brings forth the promise of upward momentum for SAND enthusiasts. 🚀🏝️💚

SAND is ready for a deep correctionAltcoins that have a large market cap indicate that a correction is coming soon.
The SAND chart also seems to have completed its diametric wave F and we will soon see a drop for wave G.
We have a very large liquidity pool on the lower left side, which we marked with an arrow. It seems that the goal is to hunt this pool and then change the trend.

Textbook Bull flag on SPY Daily chart! We can see a massive Textbook Bull flag on SPY Daily chart with a falling wedge. When we pair this with a Fib Extension and the falling wedge breakout we could see 515ish all said and done. Please keep in mind that this is a daily chart.

SAND target 0.564h time frame
-
SAND is creating a potential bottom head and shoulders, the right shoulder hasn't been formed yet. Currently, 0.37 achieve the condition of HS, but shall notice another possibility that SAND go back to 0.35 to make the low of right shoulder.
I will provide another trading plan if SAND reach 0.35, and now we can follow this plan which targets as below.
TP: 0.56 / 0.66
SL: 0.381

SAND/USDT It required Break to continue Upward movement !!💎 SAND has indeed caught the market's attention with its remarkable ascent. It is currently facing a challenge in breaking through the supply area at $0.4, and there are clear signs of bearish rejection in this area.
💎 If it fails to break through this resistance in the near future, there's a possibility that SAND could decline and retest the demand area around $0.339 to gather new momentum. However, if SAND successfully breaks the supply area, it opens the door for further upward movement and the probability to reach our target in the supply area.
💎 In the bad scenario, if SAND retraces to the demand area at $0.339 and doesn't show signs of a bounce, it suggests a potential breakdown of the demand level. If this occurs, it indicates a bearish momentum, and there's a possibility that SAND may continue its descent, possibly returning to the strong support area.

🏝️🗺️ Sandbox Surge: Building Castles in the Crypto Sky 🚀 🏖️Sandbox has been playing in the sand for a while, staying quiet, but it's looking ready to sculpt a bullish masterpiece. 🎨 After a long, flat stretch where it seemed to be collecting seashells, we finally saw that breakout we've been beachcombing for. 🌊
The chart's telling tales of tides turning, with a breakout above 0.3783 hinting at bullish currents strong enough to carve new landscapes in the market. 🗺️ As for the next checkpoint in our sandbox adventure? I'm eyeing a sunny spot at 0.5932, where the sea meets the shore. ☀️
Just like building a sandcastle, this trade needs a blueprint. Keep your shovels ready and watch the tide—because if it swells, we could be riding the wave all the way to new heights. 🌅 And who knows? Maybe it's time for Sandbox to show the crypto world that playtime can be profitable. 🏖️
Remember, even in the sandbox, keep a playful eye on the bigger beach—that's where the real sandcastles are built. 🏰 Let's build our portfolios with the same joy a child brings to their sandy forts!
🏖️🚀🌊🎨🗺️☀️🏰News:
Let's delve into some recent headlines that are shaping its landscape:
🌐 This Metaverse Altcoin Announced Its New Fund - Sandbox is fueling innovation with fresh funding. Time to watch these digital grains of sand turn into gold? link: en.bitcoinsistemi.com
🛠️ The Metaverse's Future Shaped by Creators - Creativity is currency in the metaverse, and Sandbox is minting a new era where imagination is wealth. Link: www.cryptopolitan.com
🏍️ Valentino Rossi Races into the Metaverse: The Sandbox's Latest Power Move - The legend of the tracks brings his legacy into the sands of the metaverse, promising an exhilarating blend of speed and pixels. Link: en.cryptonomist.ch
💳 Mastercard Meets Metaverse: Spend NYSE:SAND with a Swipe! 💥
Big news in the dunes, folks! Mastercard's now letting you spend your NYSE:SAND tokens like you're shopping in the real world. 🌍💳 No more hoarding your digital treasure; it's time to swipe and let your NYSE:SAND flow. Link: www.coindesk.com
In the Sandbox, every grain could be a part of the next digital masterpiece. Let's keep our creative spirits high and our portfolios ready for the next wave of innovation. 🖌️🌅
Playful strategies and vigilant eyes - that's how we'll sculpt our success in the Sandbox. To prosperity and beyond! 🚀
🚀🎨🏰☀️🌊🌐🛠️🏍️🖌️🌅
One Love,
The FXPROFESSOR 💙
SAND/USDT Had a Good Run 🚀| What's Next for SAND?💎Yello, Paradisers! turn your focus to SAND/USDT. We've spotted some compelling price dynamics. A standout observation is the rejection from the bearish OB, shedding light on the asset's potential direction.
💎From our latest analysis, SAND has successfully broken away from a descending trendline, setting its sights upward. We're currently anticipating two possible scenarios:
💎The Sandbox might undergo a slight retracement, finding support and bullish drive from the demand level at 0.3386, with an aim to challenge the bearish OB once more.
💎If SAND faces challenges in holding its ground above the .3936 demand mark, it's likely to seek bullish support from the .3386 demand zone. Yet, if it drops below this level, bearish movements could be on the horizon.
💎Always stay alert and craft your strategies based on these potential outcomes. Refine your trading decisions for SAND with ParadiseFamilyVIP.

SANDBOX(SAND) - Double Bottom & TP
* 1D
SAND has a double bottom pattern.
It seems to be bullish.
Based on the above, TP can be set at 5 places.

Grab the SANDWe have a large diametric for SAND. To complete the F branch, we can go up. If it pull back to the green zone, it is a good opportunity to buy/long.
For risk management, please don't forget stop loss and capital management
Comment if you have any questions
Thank You

$SAND vs $MANANYSE:SAND vs EURONEXT:MANA
Boy was I wrong on #Sandbox. But that's why you cover trades at support, good move, as it ended up going much lower.
Both have been crushed during the bear market but @decentraland has outperformed @TheSandboxGame.
Compare the highs of NYSE:SAND vs EURONEXT:MANA & they're at a similar in price now!
Diluted mkt cap is better on NYSE:SAND 70% vs what it was before, last unlock was brutal, but not as good as EURONEXT:MANA 82%.
Still like both projects, final comparison:
MANA put in LOWER 2021 LOW
SAND HELD 2021 LOW
#P2E #P2EGame #crypto

SAND/USDT bullish momentum ? 👀 🚀 Sand Today Analysis💎Paradisers, turn your attention to SANDUSDT as it showcases a captivating trajectory. After a notable dip, it's firmly grasping a pivotal support level, hinting at an impending bullish surge.
💎 Not long ago, we noticed SAND reaching an overhead supply zone, only to face rejection and embark on a downward path. The recent substantial dip in the market, driven by a significant drop in BTC, impacted the upward momentum of many altcoins. In line with this trend,it experienced a decline, touching the crucial support at 0.2776, but is now regaining its bullish stride.
💎 Additionally, the emergence of a channel pattern is evident. A breakout from this channel could amplify the bullish momentum. However, if SANDUSDT struggles to sustain above the support zone, a pronounced downward shift is plausible. As always, strategize your trades meticulously.
💎 Remember to employ prudent trading strategies and use proper stop-loss measures! Stay alert to market movements and look forward to more insights

SAND/USDT Bullish Momentum ??? Break the resistance or Reject?💎 SAND has undoubtedly captured our attention, achieving a breakout from the Symmetrical Triangle pattern with a notable ascent. Currently, SAND is at a pivotal juncture, facing a resistance zone that needs to be overcome to maintain its upward trajectory. However, SAND has not yet initiated a downward movement for a retesting phase.
💎 For optimal entry points, we can await confirmation by observing either a breakout from the resistance zone or a pullback to the demand area. If SAND manages to breach the resistance promptly, it's likely to proceed smoothly towards its next targets, the supply zone, and the bearish OB region.
💎 Should SAND face another rejection at the resistance, it might enter a retesting phase at the demand zone. In such a case, SAND would require a definitive bounce to continue its attempts to shatter the resistance barrier.
💎 Failure to do so could result in SAND relinquishing its hold on the demand zone, indicating a potential false breakout and initiating a downward momentum. Consequently, SAND might seek support, potentially testing the resilience of a significant support area below.

SAND/USDT Ready for an Epic Bullish Journey | SAND Analysis💎Paradisers, focus your attention on SANDUSDT as it presents an intriguing trajectory. Positioned within a demand zone, it has seemingly established buying liquidity and is primed for a potential bullish surge.
💎SAND has been navigating a descending channel formation for an extended period. Recently touching the channel's support, it's now reigniting its upward momentum, fueling confidence in its ability to move towards our projected resistance level.
💎Nonetheless, it's imperative to stay watchful. If the price breaches the demand zone, there's a strong possibility it will revert back to the support level for a retest.
💎Refine your mastery of entry and exit points for Sandbox with ParadiseFamilyVIP. Delve into expert insights on SAND and other promising coins, enhancing your trading strategy.

SANDBOX ROADMAP ! (WAVES)Sandbox analysis from Badharek
Check my bio first.
In large time intervals, in large degrees of waves, we have one wave that has become diametric and another wave that seems to have a double structure.
In my opinion, this major correction will end when we reach the green area.
Comment if you have any questions
Thank You

