Sandbox

SandBox ($SAND) : Bullish Pattern development in long term?Hello everyone!
If we look at $SAND in a medium-long term, we cannot rule out a big picture as shown on weekly chart. The big signal of Price Action will be the Neckline achievement (shown on chart as wave IV retest) of a large "Head & Shoulders". Working on daily time frame, I found some interesting resistance levels, useful for evaluating the strength of the trend, step by step.
I came up with this idea thanks to our last trade on Sandbox, which developed a potential bullish impulse structure.
(Click and Play on Chart below)
If there are conditions, I will update this idea below.
...trade with care! 👍
Cheers!
If you think that my analysis is useful, please...
"Like, Share and Comment" ...thank you! 💖

SAND had a strong bullish trend over the past weekSAND had a strong bullish trend over the past week, holding the support of the $0.70 range, creating a strong bullish wave on the daily timeframe.
The break of the previous ceiling has been confirmed, but there has been a strong reaction as the price has hit the resistance identified in the $0.90 range. One of the important resistance levels of the sandbox is in the range of $1 rand, which is the target of buyers.
Sandbox has had a range trend over the past week. The price fluctuates between the considered resistance support levels.
The support range of this currency is at the price of 0.610 to 0.670 dollars and its resistance is at the level of 0.880 to 0.900 dollars. Above this resistance, there is a very strong level in the $1 range, breaking these levels requires special support from buyers. Given the selling pressure created in the market yesterday, we expect the Sandbox corrective trend to deepen more likely, and by breaking the current support, the decline could continue to the $0.550 range.
But in the bullish scenario, if minor support is maintained in the range of $0.700 to $0.685, and in the 4-hour timeframe, we can expect another positive swing.
The important point for the medium and long term is the strong bullish wave started at the $0.40 range, if the supports hold, there is the potential for the sandbox to break the $1 resistance, to the $1.25 level. to continue
SAND TO HIT $1$SAND was below 200 daily MA since April, 2022!
This daily breakout candle is a strong buy signal indicator. Retest looks clean.

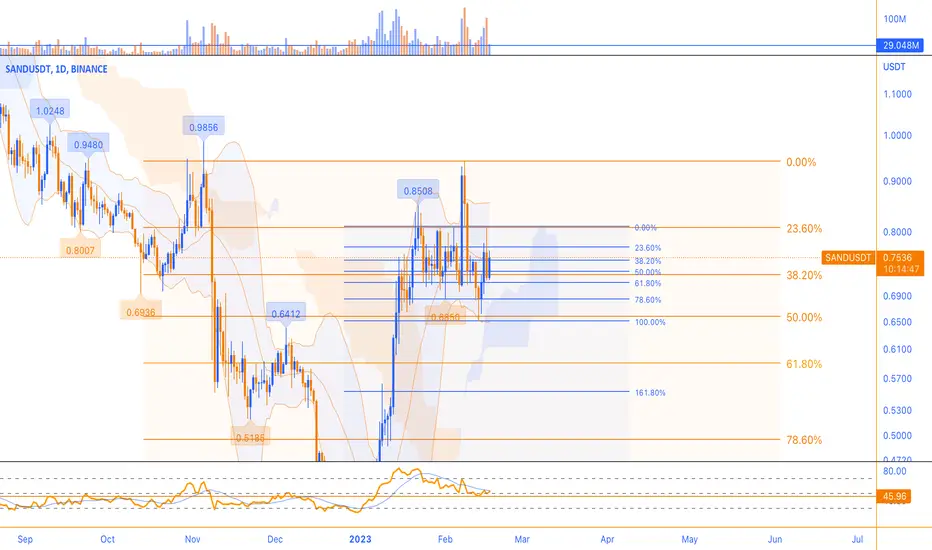
THE SANDBOX Price Analysis TO THE MOOOON!!??$$$ DAILY CHART $$$Here are some key LVLS of support and resistance for the sandbox token :)
After this nice PUMP to the upside.. Will SAND keep the momentum!>>>????
LET ME KNOW WHAT YOU GUYS THINK :)
BINANCE:SANDUSDT

SANDUSDWatching the daily chart on SANDUSD I can see that it broke out of a bullish pennant and the 1.618 level of fib.
Currently the price is retracing from the big green break out candle. It's possible that price comes back below the 1.618 fib or lower to retest the previous resistance.
2.618 of fib or $1.035 is the next major resistance level to look at. If that breaks it can reach the flagpole target of $1.24.
If it crashes. We can see price go back to $0.63-$0.53 levels.
Waiting to see if this bullish pennant plays out.

$SANDUSDT: Sandbox has a buy signal and Korean bidInteresting setup, this pair had huge volumes at Korean exchanges lately, and a clear accumulation pattern, signal triggered just now, so if above the horizontal level highlighted by the white box, it has upside to the targets shown by the boxes (both time and price).
Best of luck!
Cheers,
Ivan Labrie.

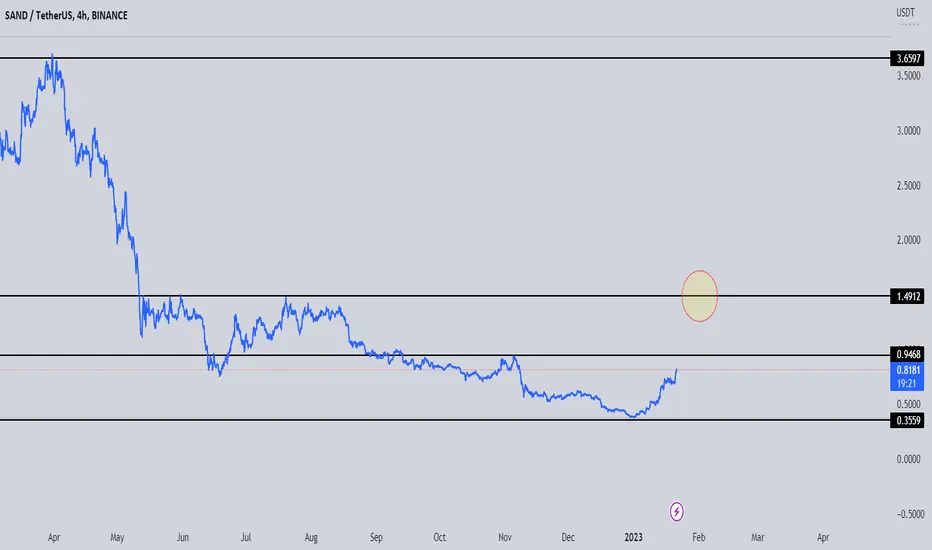
Formation of the next bullish waveBuying pressure on SANDBOX increased again after going through a corrective trend, and buyer support led to the formation of the next bullish wave. The target that we considered in the previous analysis is seen, and the main target is in the range of $1.02. Of course, due to the high strength of yesterday's bullish candle, which is closed at the ceiling, there is also a possibility of breaking this resistance. Its strongest resistance is considered in the range of 1.42 to 1.49 dollars.

The Sandbox #SANDWhat Is The Sandbox (SAND)?
Launched in 2011 by Pixowl, The Sandbox is a blockchain-based virtual world allowing users to create, build, buy and sell digital assets in the form of a game. By combining the powers of decentralized autonomous organizations (DAO) and non-fungible tokens (NFTs), the Sandbox creates a decentralized platform for a thriving gaming community.
According to the official whitepaper, the Sandbox platform’s main mission is to introduce blockchain technology in mainstream gaming successfully. The platform focuses on facilitating a creative “play-to-earn” model, which allows users to be both creators and gamers simultaneously. The Sandbox employs the powers of blockchain technology by introducing the SAND utility token, which facilitates transactions on the platform.

SAND Coin (Sandbox) : "Buy the dip" with a nice TargetHi everyone!
Sand's main trend is still bearish, but we do not rule out some interesting corrective moves in the near term. If our analysis is correct, it might be interesting to accumulate on corrective swing and let Long positions run up to 0.6765 area.
If this idea will be supported by your "Likes" we will continue to follow the crypto with updates below.
thanks for your attention and please... trade with care! 💖

Lower bottoms and floors are being formedIn the 4-hour timeframe, the trend is in the range, but because lower bottoms and floors are being formed, there is a possibility of a deep pullback and testing the support of the 0.60 range.

We can expect a stronger positive reactionSAND's price, which had a negative reaction in the resistance range of $0.805, pulled back to its support in the range of $0.657 to $0.750. If this area has a positive reaction, SAND can grow to the targets of the $1 range this week or next. The strength of the bullish wave is enough to change the trend in the daily time frame. But a bottom pivot and the formation of a corrective wave are needed, which with more probability, we can expect a stronger positive reaction in the second support range, i.e., the price of $0.584 to $0.641. So, if the support area of $0.67 is broken, the decline can continue to the level of $0.584, and in this area, we can expect the formation of reversal patterns.

SAND/USDT. BitVero Crypto Academy.
Disclamer:
We are not financial advisors. The content that we share on this website are for educational purposes and are our own personal opinions.

Theta coin formed a bullish Gartley | A good buy opportunityHi dear friends, hope you are well and welcome to the new trade setup of The Sandbox (SAND).
Previously I shared a long-term trade setup for SAND, which is still in play as below:
Now on a 4-hry time frame, SAND with BTC pair has formed a bullish Gartley pattern for another pump soon.
Note: Above idea is for educational purpose only. It is advised to diversify and strictly follow the stop loss, and don't get stuck with trade

SAND (Y23.P1.E1).The big picture and short term plans\setupsHi Traders,
If your familiar with the Stan Weinstein approach or just know the significance of the 200 daily ema. well we are close to it and its likely a good reversal position and likely a micro wave 5 position.
The push back might be a little or also I will be looking for a shorting structure in the smaller time to enter.
All the best,
S.SAri

SAND : INCREASE TRENDSAND showing on low time frame interesting view for increase.
The sand coin is known also by hold high whale wallets.
SANDUSDT Potential Reversal Waiting for a Reversal in SAND/USDT chart. Here is why,
There are both fundamental and technical reasons.
Fundamental reasons,
12.4% of tokens were unlocked on 14 FebruaryFrom my point of view, this is the main reason. normally Anyone can tell there can be a 10-13% price devaluation at that time. But I'm hoping there can be more than price drop. 🔎 (Token Unlock - Google it )
* Another thing is that I have difficulty identifying the bitcoin movement. That’s why I marked two accumulating periods.
Technical reasons.
We can see two resistance areas on the chart. The chart has failed to break these levels only a few times.Keep an eye on these resistance areas .If there is more than >300M volume. The resistance can break easily. Personally, I would not enter into any trades at that time. Because my whole structure was wrong.
In cases where there was low volume and a high RSI value + a down tread. I consider entering a short position. Thanks . #NFA #DYOR


Buyers' support allowed the price to continue movingSAND continued its strong uptrend over the past week, and buyers' support allowed the price to continue moving without a pullback after breaking through the $0.56-$0.59 resistance range. This 102% growth, which started from the floor area of $0.38, stopped at $0.75. A weekly resistance was considered in the $0.65-$0.74 area, which was broken in the past due to heavy selling pressure.
In the past few days, the price hitting this range has been accompanied by reactions, and in the 4-hour timeframe, we see the formation of a complete range area. More likely, the price can break the bottom of the range channel and enter a deeper corrective wave. The supports that can again create signs of positive reaction, and are considered the range of demand, are at the prices of $0.6423 and the range of $0.5600. But if the current resistance is broken, the next target for buyers after the pullback will be in the range of $1.0742 resistance.

SAND (Y23.P1.Video).The big picture and short term plans\setupsHi Traders,
#SAND #SANDBOX #Crypto
We point out the key levels as usual and give a few scenarios based on fibonacci, MA and conditions to fit the plan.
Please give us a like and share,
Regards,
S.SAri

NeutralSand
It was behind a downward trend for months , But now it has managed to break .
The last time we exited this currency with the beautiful identification of the channel ceiling and the number 8.36 .
If we manage to break 0.71 , we can set the next target at 0.96

Best entries for SAND and why I think it's a bull trap right nowI will be waiting for 25 and 20 cents to buy SAND if it couldn.t cross the the 200 EMA. If it did I will be entering after some retracement from the leg that broke the EMA maybe (61 or deeper retracement). Let me know what you think.

SAND continued its price growth last weekSAND continued its price growth last week. The support of the buyers caused the breaking of an important resistance in the range of $0.47-0.48. The increase in the price of the sandbox continued to the resistance range of 0.56 to 0.59 dollars. The bullish wave was corrected by hitting this resistance. The first hit of the $0.50 support area has given a positive reaction. But this quick return has increased the possibility of the price entering the range trend. Therefore, we expect to see a short-term range trend between the current resistance and support of this currency. Another support is considered in the range of $0.47-0.48, which, if the first high does not react positively and is broken, the price decline can continue to this level. According to the upward trend line, we can expect a stronger reaction from this range.
