SPX Model Trading Plans for WED. 02/08Consolidation Ahead? Day 3
The surge from post-FOMC last week could be consolidating a bit in the near term, unless some unexpectedly bullish macro developments take place. If you are long, could be time to take some money off the table, and if you are short/wanting to go short then you might want to dip your toes but want to wait for a confirmation before stepping in more. The risk is still for an upside spike than for a downside draft while the index is above 4100 on a daily close basis.
Positional Trading Models: Our positional models are flat for now. Models indicate going short on a daily close below 4100, with a take-profit on a cross above 4065, and a trailing stop of 33 points.
By definition, positional trading models may carry the positions overnight and over multiple days, and hence assume trading an instrument that trades beyond the regular session, with the trailing stops - if any - being active in the overnight session.
Intraday/Aggressive Models: Our aggressive, intraday models indicate the trading plans below for today.
Trading Plans for WED. 02/08:
Aggressive Intraday Models: For today, our aggressive intraday models indicate going long on a break above 4167, 4152, or 4102 with a 9-point trailing stop, and going short on a break below 4163, 4145, 4113, or 4097 with a 9-point trailing stop.
Models indicate no explicit long exits and short exits on a break above 4116 for today. Models also indicate a break-even hard stop once a trade gets into a 4-point profit level. Models indicate taking these signals from 10:16am ET or later.
By definition the intraday models do not hold any positions overnight - the models exit any open position at the close of the last bar (3:59pm bar or 4:00pm bar, depending on your platform's bar timing convention).
To avoid getting whipsawed, use at least a 5-minute closing or a higher time frame (a 1-minute if you know what you are doing) - depending on your risk tolerance and trading style - to determine the signals.
(WHAT IS THE CREDIBILITY and the PERFORMANCE OF OUR MODEL TRADING PLANS over the LAST WEEK, LAST MONTH, LAST YEAR? Please check for yourself how our pre-published model trades have performed so far! Seeing is believing!)
NOTES - HOW TO INTERPRET/USE THESE TRADING PLANS:
(i) The trading levels identified are derived from our A.I. Powered Quant Models. Depending on the market conditions, these may or may not correspond to any specific indicator(s).
(ii) These trading plans may be used to trade in any instrument that tracks the S&P 500 Index (e.g., ETFs such as SPY, derivatives such as futures and options on futures, and SPX options), triggered by the price levels in the Index. The results of these indicated trades would vary widely depending on the timeframe you use (tick chart, 1 minute, or 5 minute, or 15 minute or 60 minute etc.), the quality of your broker's execution, any slippages, your trading commissions and many other factors.
(iii) These are NOT trading recommendations for any individual(s) and may or may not be suitable to your own financial objectives and risk tolerance - USE these ONLY as educational tools to inform and educate your own trading decisions, at your own risk.
#spx #spx500 #spy #sp500 #esmini #indextrading #daytrading #models #tradingplans #outlook #economy #bear #yields #fomc #fed #newhigh #stocks #futures #inflation #powell #interestrates #earnings #earningsseason #chinareopen
Sandp500

Symetrical Triangle Breakout vs Ascending Wedge Many have noted the "breakout" of the triangle over the last several sessions. I have not been convinced it has any legs. We are also developing a nice ascending wedge. My guess is the ~40% of target we hit was all the triangle had, and the wedge will play out to the downside.

S&P500 Technical Analysis-2023Hello everyone, hope you all are doing good.
Bullish Probability:(at least one or two weekly candle closes above 4100 than there is a possibility of this playing out).
There is an active Bullish Divergence playing out in RSI, so there are chances S&P500 may put new high above 5k.
If S&P500 put new High, then it can be a Triple Bearish Divergences, so after that it can be a massive dump of markets.
In this case the 1st Bottom will be 3500, so the 2nd Bottom can be massive drop from 5k to 2000, previously S&P500 dropped its 2nd Bottom from 1580 to 670(-57%).
Bearish Probability:(at least one or two Weekly candle closes below 3700 than there is a possibility of this playing out)
Currently the Fractal of SnP500 looks like similar to the previous oct-2001 to july-2002 Fractal.
S&P500 -> falling in a Descending parallel channel -> Breakout/Fake Out little and finally put lower low or 1st Bottom.
If this plays out than RSI may fall below 30 - invalidating the current Bullish Divergences. (Sometimes Divergences get invalidated due to forceful movement of Markets).
Target = around 3200 OR there is a possibility to fall on the sky Blue trendline.
Thank you, please like and share, if you have any questions please comment.

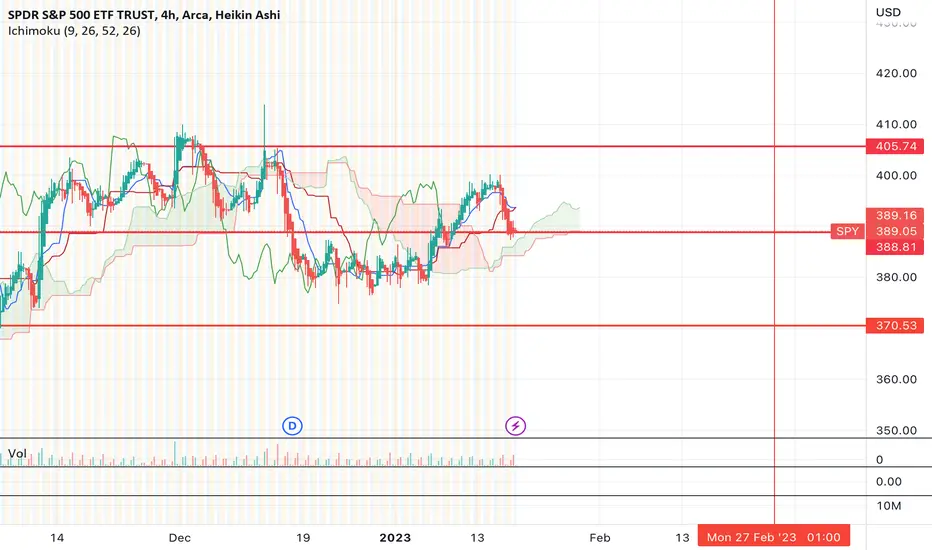
$SPY run it back turbo $405 target?Everyone turned bearish yesterday when the market fell 1.5% and are calling for new lows, however, I think the most likely scenario from here is that we push back up to $405 first before the real bear move begins.
After tagging $405, then I think the setup will favor the bears, and think we can fall back to the $370-380 range over the coming weeks.
I expect this move higher to play out by the end of next week.
Let's see what happens.
S&P 500 if this level break than we will see massive move currently i am neutral but it possibility make sure make your own decision

Jan 15,23-S n P 500-Will it hit 4100So it's earnings season and it's not supposed to be showing too well, however, the S n P is showing signs of strength from last week and his risen tonight to over 4000 again.
Hard to say but will some disappointing earnings numbers tank the 500 or will it keep going up to 4100 or 4200 before it drops back down to the 3800 area again.
Something to watch anyway...maybe put in a Sell Order at 4100.
Thoughts anyone?
Heiko

Bulls to 4150 Bears to 3100Bulls are calling for SPX to 4150 bears to 3100. Which trend-line are we headed for?
My personal belief is we are dead cat bouncing on the way to 3100 but time will tell.
If the bulls rush in we could definitely see a squeeze to 4150... If reality takes hold 3100...

S&P500 - 1 Day Chart - Short Price Target of $2,880S&P500 1 Day Chart:
Short Price Target
V Calculation Negative
V = B - (C-B) = D
C $4,102 - B $3,491 = $611
B $3,491 - (C-B) $611 = $2,880 Price Target
Ichimoku Timespan:
A to B = 41-Bars (42-1)
B to C = 34-Bars (33+1)
C to D = 75-Bars (76-1) (41+34=75) Wednesday 22nd March 2023
Notes:
The Ichimoku Conversion Line (Tenkan Sen) looks like it is about to cross back under the Ichimoku Base Line (Kijun Sen) on this 1 day timeframe.
The Ichimoku Lagging Span (Chikou Span) looks like it is about to drop under the price from 26 Periods ago.
Note that the Leading Span A (Senkou Span A) and Leading Span B (Senkou Span B) support is very thin where the S&P500 Price is located at the moment.
We have a Double Top at the 50% Fib Level $4,102 which is located around C of our Ichimoku V Calculation.
The S&P500 Price is under its Bollinger Bands Basis 20 Period SMA and we have expansion of the Upper and Lower Bands and this is for negative momentum.
The S&P500 Price is also under its Volume Profile Visible Range Point of Control (VPVR POC) for this charts Visible Range.
Looking at the Moving Average Convergence Divergence (MACD) indicator, Momentum is downwards and we can see that the MACD Line is still under its Signal Line and is getting very close to the 0.0 Base Line.
From my opinion, analysing all the above indicators it's looking very likely that we will see the Price Target of $2,880. This will also be fully confirmed when/if the Leading Span A (Senkou Span A) crosses back under the Leading Span B (Senkou Span B) creating a Kumo Twist into a Bearish Red Cloud on this 1 day timeframe.
I hope this is helpful.

#ES_F Potential Bear Flag ?ES appears to be forming a bear flag with a breakdown implying a move to 3400 ,
Good support at 3800 , would be looking there for a bounce / reversal or more downside to target 3400.


SPX hide you kids, hide yo wife?Is this the beginning of a bigger move down? or a dip?
Rejected off of the Larger downward trendline.
Broke down out of the upward trendline.
Broke the proposed wave 4.
At an important level here to keep an eye on. It as flipped back and forth from support to resistance, then willy wonka'd and reversed it from resistance to support.
SO watching 3910 area to see if it holds again. A break under will be watching for a corrective retest, throwback...Wave dependent.
If you have found this inspiring/helpful, please consider a boost and follow! Any questions or comments, please leave on comment! Also, check out the links in my signature to get to know me better! Cheers!

S&P 500 Chart Analysis....
AronnoFX will not accept any liability for loss or damage as a result of
reliance on the information contained within this channel including
data, quotes, charts and buy/sell signals.
If you like this idea, do not forget to support with a like and follow.
Traders, if you like this idea or have your own opinion about it,
write in the comments. I will be glad.

$SPY Compression & Liquidity - S & P 500 IndexGetting close to the danger zone.
Next week Opex options expire on 11/18
DXY fishing for support
no FED pivot until 2023

SAND/USDT - LONG----- Welcome, dear followers! -----
- Here is my trading methodology. I trade with a normal system and analysis of resistance and support, as well as price reversal patterns.
- For the record, I do not place a stop loss within my trades. So that I only risk 1.5% of my total capital in order to support the loss due to a price reversal against me.
- If a price reversed against my expectation and touched the drawn line r3, then I transferred targets to the entry point and waited for the price to close at it with a loss equal to almost zero.
- Today's deal is shown in the chart, and here are the entry and exit points below.
-- Support me with numbers and follow up on my account for other deals in the future. Thank you for coming to this part. --
-------------------------------------------------------
⚡️⚡️ SAND/USDT ⚡️⚡️
Exchange: ByBit USDT
Trade Type: Breakout (Long)
Leverage: Cross (3.0X)
Entry Orders:
1) 0.8519 - 100.0%
Take-Profit Orders:
1) 0.8792 - 60.0%
2) 0.9017 - 30.0%
3) 0.9353 - 10.0%
Trailing Configuration:
Stop: Breakeven -
Trigger: Target (1)

SP500 broken out of its medium term downtrend - BULLISHSP500 on 4 hour has broken out of two formations.
1. The medium term downtrend the markets been in for the last few months.
2. A W Formation which has broken into a new uptrend...
Bullish Target to 4,200
Regards
MATI Trader

S&P500 WAVESHello, dear traders, I hope you are doing well. In this analysis, you can see the corrective waves of the S&P500. I think we have a diametric and after this up we will have another down towards the demand area.
If you have a question, ask. Check out my bio
Thank You

AAPL - Short PositionWhen looking at AAPL current underlying value and most recent price behaviour when using a 2-hour range, investors can see a shooting star bar formation. Underlying price movements of AAPL witnessed a loss of its initial gains in this instance, the shooting star formation shows a bareish correction after a failed attempt to keep underlying stock prices higher.
When observing 50 and 100 day ranged EMA averages investors can see that on the 29/08/22 – 30/08/22 shorter 50-day EMA moving average crossed beneath the longer 100-day EMA moving average. This dead cross was followed by a strong down trend, underlying prices falling 5%.
This was after bullish rallies that were witnessed since July. On 06/07/22 shorter 50-day EMA moving average crossed above longer 100-day EMA moving average. This fresh bullish crossover was followed by a rally that saw the underlying share value to increase over 20%. Currently EMA moving average lines are not moving back towards one another, instead they are moving parallel in a different trajectory. This was after the rejection of bullish momentum. Therefore, the down trend is more likely to strengthen before corrections occur.
Based on EMA moving averages and candlestick patterns and behaviour we are bareish in sentiment. We anticipate that the stock will fall further and have taken a short position as a result.

SPY in Clear Downtrend - Where are we headed next??Ever since the S&P 500 topped at the end of 2021 we have been in a clear bearish down trend.
Here we're looking at the weekly chart. Drawing fibonacci lines we can see the area's of previous support tell us to keep an eye on these levels:
345
320
300
275
We can also see that the RSI is oversold on weekly so we can potentially see a little rally.
Macro trends are not looking great with inflation hanging around, Russia vs Ukraine tensions, etc
Happy trading!

Decisional BlockingToday is very choppy day, but you can't look at the market for the same scenario everyday, but rather build a context around.
The world is returning back to its wage driven motivation.
It's a lot of bubble economies now that are web based, and have no real utility in the physical plane and I believe that price's true nature is to level
the playing fields on both sides of the ticker, but directed by the true intentions of parties who have dominating interests.
And this is okay.
It's only Tuesday.

Amazon Short PositionCurrently priced at $135 Tesla’s underlying stock price sits between its weekly PP 0.236 and PP 0.382 Fibonacci resistance pivots . Currently priced just below weaker PP 0.382 resistance level the stock is trading above its central PP level. This is a bareish signal. Investors should expect a correction towards its support. Furthermore, Tesla’s underlying price sits outside the 20-day ranged Bollinger’s upper bound. This is also a bareish signal, investors should expect a correction towards it’s lower bound.
Based on these signals it’s reasonable to assume a bareish correction towards the Fibonacci’s support. We anticipate Tesla’s underlying price to reach it’s 0.382, R1 resistance pivot before bareish corrections occur. Based on buy trends since the start of the year represented by the green candles, Tesla’s underlying stock price has pretty much reached the top of a buying trend and investors are about to witness bareish corrections. I have presented this using swing low and high prices since the start of the year.
Therefore, we have set a purchase price between the PP 0.236 and PP 0.382 resistance level . We anticipate based on buying trends that the green candles will reach a price of at least $137. The team have set a target price in line with the Fibonacci’s middle support pivot of PP 0.706. The buyer should sell around $101.

SANDBOX : Day trade (LONG)SANDBOX: Day trade (LONG)
Some trends show some increased trends coming time for SAND
Its very hard to find the right coins in a moment where most coins don't move really, and same time we are in a time where the take profits are faster than before. but trends change with time
If there is real breakout trends or high increase, for 90% we will find them with our trading algorithmic including volume study
We use 10% of work depending on algorithmic the rest studies.
When we add coins it means not it will increase: but the coins that we add have the most chance at that moment to change or in the short term.

S&P Long Term chartIf we follow the other 4 times. I should buy once the monthly RSI down trend is broken and look for support at the 1929 crash bottom trend line. Use Fibs to target possible bottoming levels. Fingers crossed.

$SPX June bottom test. Up now or 40pts lower to weekly 200ma.Many people are wondering when the bottom will be in. Twitter pundits offer various reasons for a short-term rally. While those reasons may be logical and tradeable under normal circumstances, the market has yet to give us any confidence that a near-term bottom is in.
Interestingly (or alarmingly) SPX made a bullish reversal open today, only to form a bearish engulfing candle. Though remember, outside candles only trigger more selling if the low is broken, so that remains to be seem tomorrow. This chart presents a unique view of SPX using Heikin Ashi candles. White arrows mark turning points that correspond with RSI(14) dipping below 30. In the bottom pane I have included MMTH, a market breadth indicator. If you look back further on a weekly chart, MMTH normally is reliable for a turning point in markets.
While I would like to give weight to the bullish reversal today and think that markets will rally again in the next few days, I am using extra caution in my trade planning. Unfortunately, it seems this time around is not the "normal" that most traders are used to. Do not become biased by posts about historical matches and repeat patterns.
