Joe Gun2Head Trade - Correction on S&P500?Trade Idea: Buying SPXUSD
Reasoning: Holding major support on the daily. Posting a short term double bottom on the 60min.
Entry Level: 3708
Take Profit Level: 3755
Stop Loss: 3685
Risk/Reward: 2.03:1
Disclaimer – Signal Centre. Please be reminded – you alone are responsible for your trading – both gains and losses. There is a very high degree of risk involved in trading. The technical analysis , like all indicators, strategies, columns, articles and other features accessible on/though this site is for informational purposes only and should not be construed as investment advice by you. Your use of the technical analysis , as would also your use of all mentioned indicators, strategies, columns, articles and all other features, is entirely at your own risk and it is your sole responsibility to evaluate the accuracy, completeness and usefulness (including suitability) of the information. You should assess the risk of any trade with your financial adviser and make your own independent decision(s) regarding any tradable products which may be the subject matter of the technical analysis or any of the said indicators, strategies, columns, articles and all other features.
Sandp500

XLE breaking down from Ascending Channel - global slowdown?XLE just broke down from its ascending channel, which might be signalling that the market is pricing in a global slowdown.
XLE also broke down from an ascending channel in '08 and '14. In the case of 2008, SPX crashed. But in 2014, SPX traded sideways/flat for a while

SPX SUMMER RALLY BREAKING DOWN? With the SPX rallying over 18% from trough to peak over the last few weeks it looks like the recent upward trend could be under threat.
As we can see on the chart above price is threatening to breach the lower third standard deviation (-3SD) off the linear mean at 4058.16. Given the high central tendency of signal to revert toward the linear mean(Pearson’s R^2 = 0.92), a deviation this far to the edge of the regression channel is not insignificant.
We can also see that our 1 day RSI has gone below its midline into bearish trend territory and our MACD has rolled over with signal exhibiting wide downside divergence at the mouth. These are not bullish signals.
If SPX price action fails to bounce back into the channel next week and falls firmly below the 4K line for a couple days or touches down to the 3850 price region, either of those would be enough to shatter the recent rally from a structural perspective. (Not financial advice.)

MSFT - Short position When looking at MSFT current underlying value and most recent price behaviour when using a 2-hour range, investors can see that on the 02/09/22 a three-bar pattern formed making up a shooting star. In this instance, this was a bareish indication, a failed attempt to correct the underlying stock value´s bearish momentum with bullish momentum.
When observing 50 and 100 day ranged EMA averages investors can see that on the 26/08/22 shorter 50-day EMA moving average crossed beneath the longer 100-day EMA moving average. This dead cross was followed by a strong down trend, underlying prices falling 7%. This was after bullish rallies that were witnessed since mid-July. On 27/07/22 shorter 50-day EMA moving average crossed above longer 100-day EMA moving average. This fresh bullish crossover was followed by a rally that saw the underlying share value continue to increase over 10%. Currently EMA moving average lines are not moving back towards one another, instead they are moving parallel in a different trajectory. Therefore, the down trend is more likely to strengthen before corrections occur.
When observing MACD and signal lines, investors can see that 06/09/22 the MACD line crossed beneath the signal line. This further supports our bearish sentiment.
Based on EMA moving averages, candlestick patterns and behaviour as well as MACD and signal lines, we are bareish in sentiment. We anticipate that the stock will fall further and have taken a short position as a result.

TSLA- Short PositionWhen looking at TSLA current underlying value and most recent price behaviour when using a 2-hour range, investors can see that on the 01/09/22 a three-bar pattern formed making up a shooting star. In this instance, this was a bareish indication, a failed attempt to correct the underlying stock value´s bearish momentum with bullish momentum.
When observing 50 and 100 day ranged EMA averages investors can see that on the 30/08/22 shorter 50-day EMA moving average crossed beneath the longer 100-day EMA moving average. This dead cross was followed by a strong down trend, underlying prices falling 5%. This was after bullish rallies that were witnessed since mid-July. On 08/07/22 shorter 50-day EMA moving average crossed above longer 100-day EMA moving average. This fresh bullish crossover was followed by a rally that saw the underlying share value increase over 15%. Currently EMA moving average line are not moving back towards one another, instead they are moving parallel in a different trajectory. Therefore, the down trend is more likely to strengthen before corrections occur.
Based on EMA moving averages and candlestick patterns and behaviour we are bareish in sentiment. We anticipate that the stock will fall further and have taken a short position as a result.

S&P 500 will test supportWe can see strong decreasing of S&P 500 during last days, seems like falling wedge has been triggered. Also i observe some correlation between S&P 500 and BTC, especially in that year that lead us to conclusion that top companies have bought cryptocurrency assets. But now i expect testing of first support line, you should be very carefull to place any orders. Thanks for reading :)

SPDR S&P 500 ETF - Short PositionWhen looking at SPDR S&P 500 ETF’s current underlying value and most recent price behaviour when using a 2-hour range, investors can see that a three-bar pattern is made up of a Doji and an Engulfing candle. In this instance, the Doji’s suggest a sideways correction whilst the Engulfing red candle suggests continuation of the bareish momentum.
When observing 50 and 100 day ranged EMA averages investors can see that on the 26/08/22 shorter 50-day EMA moving average crossed beneath the longer 100-day EMA moving average. This dead cross was followed by a strong down trend, underlying prices falling 5%. This was after bullish rallies that were witnessed since mid-July. On 19/07/22 shorter 50-day EMA moving average crossed above longer 100-day EMA moving average. This fresh bullish crossover was followed by a rally that saw the underlying share value increase over 15%. Currently EMA moving average lines are not moving back towards one another, instead they are moving parallel in a different trajectory. Therefore, the down trend is more likely to strengthen before corrections occur.
Based on EMA moving averages and candlestick patterns and behaviour we are bareish in sentiment. We anticipate that the stock will fall further and have taken a short position as a result.

XLE and SPX Divergence Predicts Crashes?Whenever the price of XLE and SPX diverge, we seem to get a massive crash.
XLE creeps higher, but SPX makes new lows. Historically, what tends to happen next is that SPX falls off a cliff, as was the case in the 2000 and 2008 bear markets.
Today in 2022, XLE was creeping higher as SPX was making new lows. What happens next?

MSFT - Long PositionDivergence indication signals suggest bullish change in momentum.
Candlestick momentum shows a potential bullish hammer. The underlying stock price presented in the form of candlesticks seems to be reversing in line with its moderate 0.38 weekly support level. A bullish hammer can be identified within the down trend, a bullish hammer suggests that there will be a change in momentum.
When applying a weekly and monthly ranged Fibonacci, investors can see that this potential bullish hammer is occurring in line with its moderate 0.38 support level. However, when looking at the 1-month ranged Fibonacci investors are wary given that the stock is trading close to its central 0.00 pivot level.
EMA indicators suggest the stock is undervalued given that the underlying stock value is currently trading below all 20-, 50-, 100- and 200-day EMA averages. Furthermore, the crossover of 20- and 50-day EMA lines is a buy signal.
Based on these undervalued signals, we anticipate the stock to correct towards a stronger resistance.
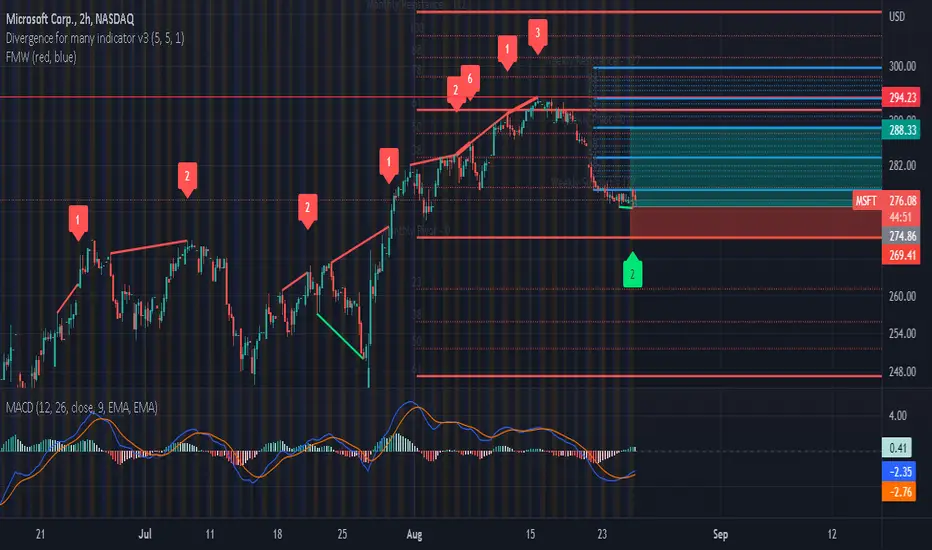
MSFT - Long PositionDivergence indication signals suggest bullish change in momentum.
Candlestick momentum shows an inverted hammer signal. The underlying stock price presented in the form of candlesticks seems to be stabilizing in line with its strong weekly support level. This suggests that the bareish sentiment is changing and loosing momentum. Inverted hammer, whist not as reliable as a Hammers, still certainly suggest that bullish momentum is likely.
When applying a weekly and monthly ranged Fibonacci, investors can see that this inverted hammer is occurring in line with its strong 1.00 support level. However, when looking at the 1-month ranged Fibonacci investors are wary given that the stock is trading in line with it’s weaker 0.22 resistance level.
It´s important to consider that the end of July and August has seen bullish rallies. The underlying stock value of MSFT has risen above 10%. This was after bearish momentum that began on 16/08/22. Before this underlying stock prices had risen as much as 20% between 26/07/22 and 15/08/22.
All things considered, we are bullish in sentiment. We anticipate the price of MSFT to reach it´s weekly central 0.00 Fibonacci pivot.
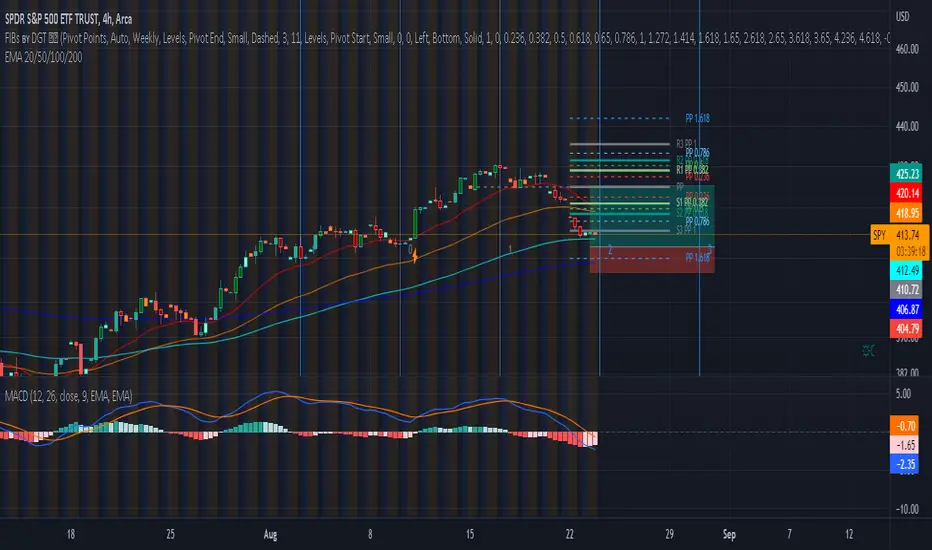
SPDR S&P 500 ETF - Bullish PositionCurrently trading below 20 and 50-day EMA moving average investors can see that the underlying share price of SPDR S&P 500 ETF Trust is undervalued. Valued at $413.58 SPDR S&P 500 ETF Trust is trading in line with its 100-day EMA average, it’s important to mention that there is still a strong possibility that the stock will fall even further in line with it’s 200-day EMA before bullish corrections occur. Regardless these technical signals indicate to investors that we should anticipate bullish momentum for this stock.
When looking more closely at the stock and its performance, Fibonacci retracement pivot points shows investors that it’s currently trading at a strong support level of 1.00; further supporting this undervalued and bullish notion. Investors should anticipate corrections towards its resistance level. Investors should also take due care to the strong possibility that the bearish sell trend might reach a stronger support level before bullish corrections occur.
Based on the above technical indication, we have set a buy price in line with the Fibonacci’s lower 1.382 support pivot, in between 100- and 200-day EMAs. We have also set a sell price just above the 20-day EMA level. Based on Fibonacci, we have set a sell price in line with the central PP level, in between it’s resistance and support.
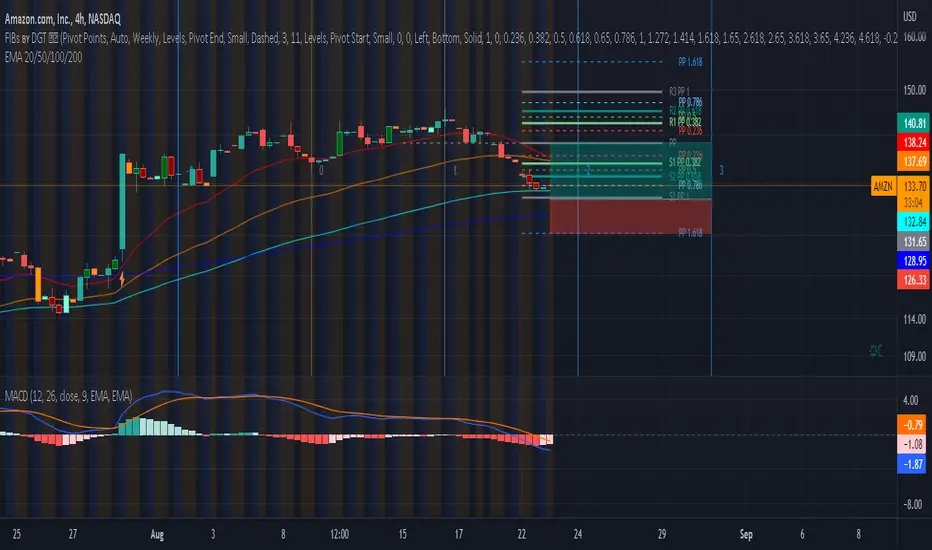
AMZN- Bullish PositionCurrently trading below 20 and 50-day EMA moving average investors can see that the underlying share price of amazon is undervalued. Valued at $133.35 AMZN is trading in line with its 100-day EMA average, it’s important to mention that there is still a strong possibility that the stock will fall even further in line with it’s 200-day EMA before bullish corrections occur. Regardless these technical signals indicate to investors that we should anticipate bullish momentum for this stock.
When looking more closely at the stock and its performance, Fibonacci retracement pivot points shows investors that it’s currently trading at a strong support level of 0.786; further supporting this undervalued and bullish notion. Investors should anticipate corrections towards its resistance level. Investors should also take due care to the strong possibility that the bearish sell trend might reach a stronger support level before bullish corrections occur.
Based on the above technical indication, we have set a buy price in line with the Fibonacci’s lower 1.00 support pivot. We have also set a sell price just above the 20-day EMA level. Based on Fibonacci, we have set a sell price in line with the central PP level, in between it’s resistance and support.
QQQ/SPY Topping Pattern?Pretty interesting relationship between QQQ vs SPY.
QQQ/SPY started massively deviating from the long term trend around March 2020.
We've since reverted to the mean a bit, and are now potentially showing signs of a top, which would mean QQQ is set to underperform vs SPY.
Double top scenario:
-we get rejected off the 21-week EMA, then break down from the channel.
Head & Shoulders top scenario:
-we rally a little longer up to the resistance level of the channel but then get rejected, forming a downward sloping H&S.
It would make sense if we saw QQQ underperform and then revert to the long term trend. However, the RSI is showing that we are very oversold, so perhaps this rally has more room to go.

The Rally Was Just A RetestThe rally we experienced in the last month was simply to retest the top of these two channels. The market is respecting those resistances and staying within the range of the channels. It might give you an idea of where we trade in the coming months.
Note: I'm using $AAPL here as a proxy for the overall market.

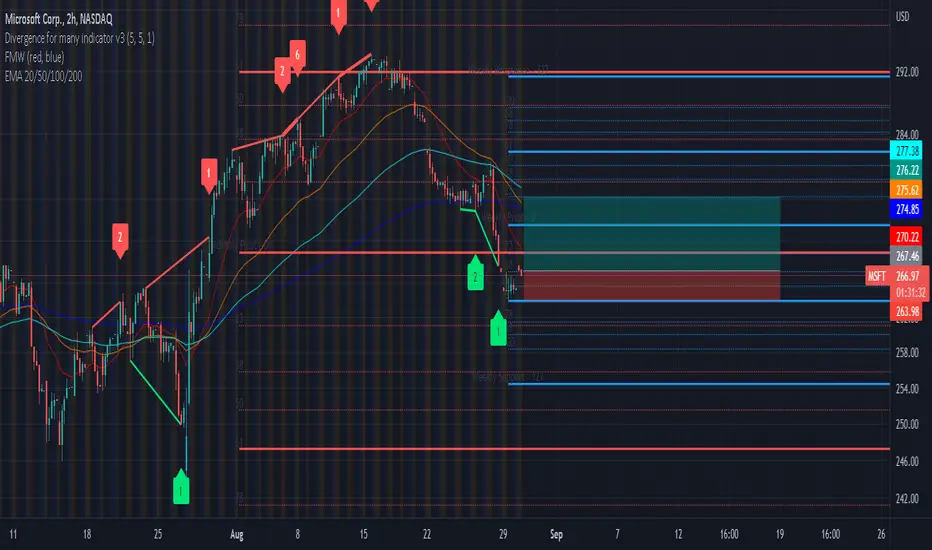
MSFT Short position Much to the surprise of many investors, this month has seen stocks continuing to rally. A bullish rally can be identified using swing high and low underlying price points since the start of July. The golden dotted line presents this, indicating upward underlying price movements. During this period MSFT saw lows of $243 and highs of $293.
Currently trading above 20, 50, 100 and 200 day ranged EMA levels, the underlying valuation of the stock is suggested to be overvalued given that it’s trading above these averages. When trading above all EMA levels, investors should anticipate a correction, back in line with these moving averages.
When using a 1-week ranged Fibonacci investors can see that the stock is currently trading in line with its weaker 0.382 resistance level: a price of $293. Based on bullish momentum, we anticipate this resistance level to strengthen. We anticipate the stock to reach it’s stronger 0.786 resistance level: a price of $298. The investor should look to buy around this price. Once the underlying price of the stock reaches this point, it is reasonable to anticipate a correction towards its support.
Therefore, we have set a sell price in line with the 100-day ranged EMA and stronger 0.786 Fibonacci support level. The buyer should sell at $275.

Going down sir?
“The Rowing Song”
Round the world and home again
That’s the sailor’s way
Faster faster, faster faster
There’s no earthly way of knowing
Which direction we are going
There’s no knowing where we’re rowing
Or which way the river’s flowing
Is it raining, is it snowing
Is a hurricane a–blowing
Not a speck of light is showing
So the danger must be growing
Are the fires of Hell a–glowing
Is the grisly reaper mowing
Yes, the danger must be growing
For the rowers keep on rowing
And they’re certainly not showing
Any signs that they are slowing

Alphabet Inc - Short PositionWith an underlying share value equal to $117, Alphabet Inc has seen bullish movements since our last position published on 28/07/22. When reassessing Alphabet Inc using a 4hr range, investors can see that it’s now trading above its central Fibonacci PP level. In fact, the stock is trading above its PP 0.382 1st level resistance. The underlying price of Alphabet is in line with it's PP 0.5 resistance level. This is a bearish signal, investors should anticipate bullish trends to begin to correct and for stock prices to bear towards their support. Whilst it would be reasonable to anticipate the bullish resistance trend to continue to strengthen, this signal tells us to begin to anticipate a bare and profit off a short. This notion is further supported by the 20-day ranged Bollinger Band. The underlying stock price is currently trading close to the Bollinger’s upper bound which suggests a correction toward it’s lower bound, close to the Fibonacci’s central PP level. It would be justified to set a buy price in line with the Fibonacci’s P 0.5 resistance pivot. We anticipate the underlying stock price of Alphabet to reach this resistance point before bareish corrections occur.
Therefore, we have set a buy price in line with the PP 0.5 resistance pivot, our investors will look to buy at a price of $118. Based buy and sell trends since the start of the year, we anticipate a strengthening bareish trend. We anticipate bareish trends to strengthen over bullish trends and for the underlying stock price to reach it’s Fibonacci support level. We have set a target price in line with the Fibonacci’s PP 0.5 support level. The buyer should sell at around $105.

📌 How long Will this AltParty last? (crypto & Altcoins)🥂🚀 What is the reason behind the recent growth of crypto market❓❔
The rise of cryptocurrencies following market optimism to reduce/stabilize the trend of increasing interest rates without the risk of recession❓❔❕❗
✅ BITCOIN has reached above $24 k and Ethereum above $1700 , and the markets are still welcoming the possibility of the arrival of the last steps of the US central bank to suppress inflation, as well as optimistic data indicating a slowing down of the economy (without the risk of entering a recession). Although, in reality, the drop in the GDP of the United States in this quota was more than expected; The gross domestic product was not positive this time either, and recording the second consecutive negative number (although small) for this index, at least from a technical point of view, means that the world's largest economy has now entered a "recession".
✅ It seems that the market's interpretation of this economic contraction was something else; The market now believes that in the face of this bump in the path of economic growth, the Federal Reserve will actually put the brakes on its interest rate hike at its next meeting in September.
In fact, the market has already celebrated this auspicious event, and after that, the risk-free indicators of the market all started to rise. From the S&P 500 index to the Nasdaq and the Dow Jones, they all began to rise, and of course, as expected, whenever there is talk of risk-taking, cryptocurrencies have been and are at the forefront of jump and sharp movements.
✅ In fact, although we have entered a "technical recession", many economists - and even Jerome Powell (Federal Reserve Chairman) and Janet Yellen (US Treasury Secretary) have so far refused to use the word recession because other factors For example, the "labor market situation" is considered as a sign of a "strong economy".
✅If we look closely, the optimism came when on Wednesday, investors reacted positively to a 75 basis point increase in the base rate by the US Federal Reserve and Powell's "dovish" signals that the Federal Reserve is unlikely to raise interest rates in the next few months. . The next day, that is, Thursday, following the announcement of the second negative GDP data in a row, Yellen stated that the definition of an economic recession is actually "a broad weakening of the factors of the economy" and "this is not what we are currently witnessing". And of course, it is believed that Yellen was referring to the National Bureau of Economic Research's (NBER) definition of the term recession, which, in addition to GDP, also includes indicators such as employment, personal income, and industrial production in the definition of this term.
👉 It didn't take long that the wave of optimism caused by this misinterpretation quickly spread from the stock market to the crypto market, and in the middle of the rise of cryptocurrencies, even the negative news related to the bankruptcy filing by the Zipmex exchange in Singapore was lost. Voyager Digital, which filed for Chapter 11 bankruptcy protection in a U.S. court earlier this month, also faced an executive order to stop spreading falsehoods about government support. But even this bad news could not stop the crypto party.👌💯
📛 But The question is ;how long does this celebration last? 🤔
We know that the economy is now walking on the edge of inflation-recession. All the tools that the Federal Reserve has are to control the demand side; So the Fed cannot control the inflation caused by the crisis in Ukraine, this institution does not even have control over the inflation caused by the supply chain problems, and this is what we think will cause the world economy to slide into recession sooner or later, and may all this celebration will not be stable (from stocks to crypto).
This article is for informational purposes only. It should not be considered Financial or Legal Advice.

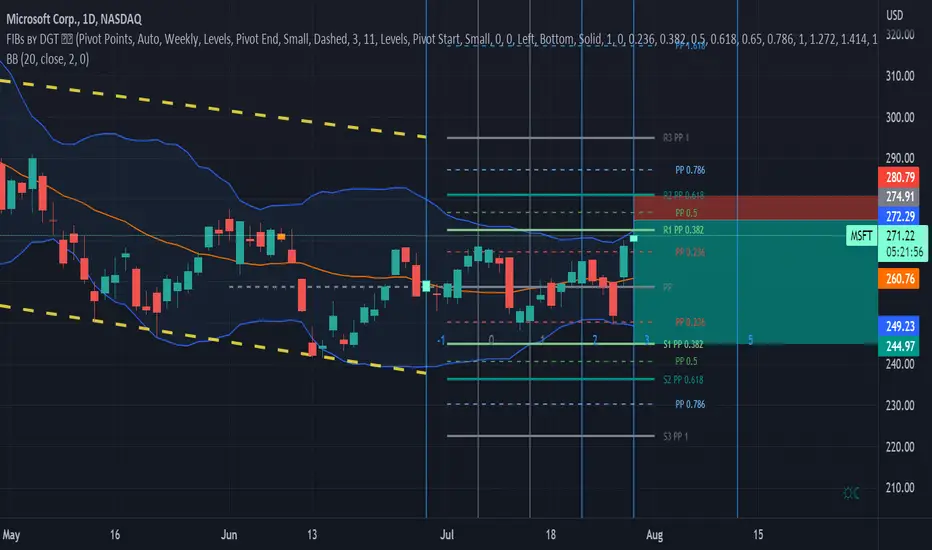
Microsoft Short PositionCurrently trading around $270, Microsoft is priced close to this month’s R1, PP1 pivot resistance level. Currently priced bellow this weaker resistance level the stock is trading above its central PP level. Furthermore, using a 20-day ranged Bollinger investors can see that the price currently lies just below its upper bound. In fact, the upper bound is equal to the R1, PP1 resistance level supporting a bareish sentiment.
Based on these signals, it would be reasonable to assume a bareish correction towards its support. However, it would also be reasonable to assume more bullish movement towards it’s PP1 resistance pivot before any bareish corrections were to occur. Based on buy trends represented by the green candles, it would seem as though there will be modest bullish movements before the stronger bareish corrections were to occur. This trend is represented by swing high and low patterns since the start of the year.
Therefore, we have set our purchase price in between the PP 0.5 and R1 resistance levels. We anticipate based on chart trends that the green candles will reach the price of at least $275 before any bearish corrections occur. The team have set a target price in line with the Fibonacci’s S1, PP 0.382 support pivot. The buyer should sell around $244.
Moreover, negative earnings are expected to be announced today. Therefore, expect bareish corrections in line with this report.
Rejected! Next Stop Point Of Control!When taking a look at the S&P500 on the Daily TF, we can see that there was a clear rejection from the Volume area high (Blueish line above). The next stop will be the point of control (Red line). Most of the market does follow this chart so before you short, double-check their chart.
Every day the charts provide new information. You have to adjust or get REKT.
Love it or hate it, hit that thumbs up and share your thoughts below!
Don't trade with what you're not willing to lose. Safe Trading, Calculate Your Risk/Reward & Collect!
This is not financial advice. This is for educational purposes only.

SANDBOXSAND/USDT 1h Time Frame we are looking Order Block and waiting for price to Come on our sell zone and waiting for retest

S&P500 may fall further on recession fears!!U.S. stocks have been under relentless selling pressure this year, with the S&P 500 (.SPX) posting its steepest percentage drop in the first half since 1970 as the Federal Reserve stepped away from easy money by raising borrowing costs. The rest of the markets, including the crypto market, have also experienced a sharp decline under the influence of these policies.
Investors are currently considering the positive report and data related to the unemployment rate and non-agricultural wages and salaries of the United States, which showed significant job growth in professional and commercial services (74K), management of companies and organizations (12K).
, the design of computer systems and related services (10K) has occurred, they are more convinced that the Fed is determined to continue the expansionary policies and thus strengthen the dollar index.
Although concerns about recession dominate the market.
"The real question is, while the economy is slowing down, then why are some people still waiting for news that could act as a catalyst for growth to happen in the markets?"
New orders for U.S. manufactured goods rose more than expected in May, data showed, suggesting demand for products remains strong even as the Federal Reserve seeks to cool the economy.
Separately, trade growth across the euro zone slowed further in June and European natural gas prices rose again, fueling fears of an economic slowdown in the bloc.
"Earnings projections were being artificially held up. Over the next two weeks, everyone is going to start lowering estimates and we expect to see a significant amount of volatility," said Dan Genter, chief executive of Genter Capital Management.
.FUND news source : kitco.com
✌️ Good luck with your trading and investing and remember: Trade smart…OR JUST DON’T TRADE!
--------------------------------------------------------------------------------------------------------------------
👉This analysis is my personal opinion ,not a financial advice ,so do your own research.
💜 if you're fan of my analyses please follow me , give a big thumbs 👍 OR drop a comment 🗯

ES Futures Week 5 analysisThe four hour chart just completed the reverse head and shoulders. I am looking for a counter trend sell back to the MA and then the support Long trade back to 4100.
