Sand elliot wave analysisThis is how i count sand. looks like it's going to make another dip but I have big goals for long term keep hodling
SANDUSD

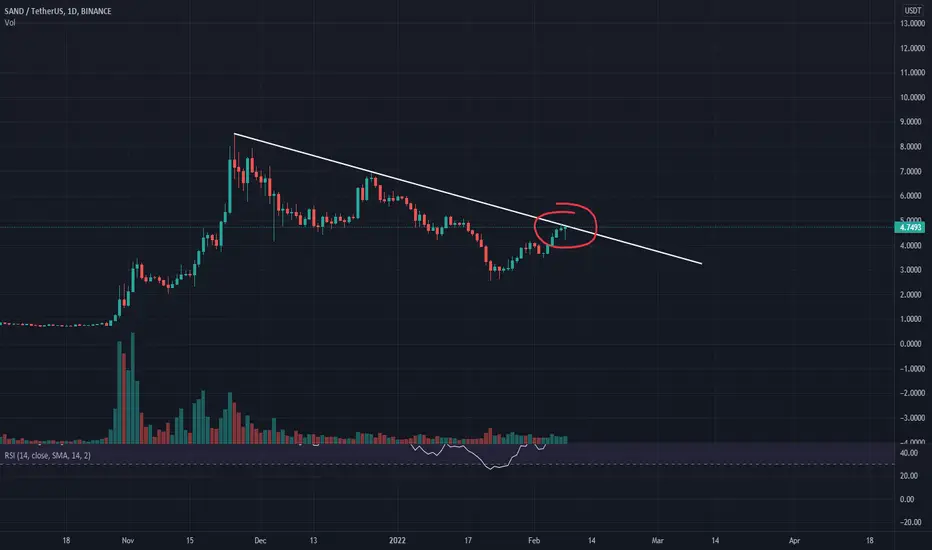
Time to get excited?Here's a quick Look at SAND daily chart. As we can see, the price has been forming a bigger descending triangle and a break to the upside could be around the corner! The price is very close to a bigger break to the upside. The best entry would be, when the price breaks above the 3.45$ with good amount of volume . Definitely one to keep an eye on.
The market might shift soon, and big gains could be coming our way!
-------------------------------------------
The idea is: Buy when the price breaks above 3.45$ and take profits at the levels shown in the chart.
Targets:
1. 3.85$
2. 4.4$
3. 5.7$
-------------------------------------------
What are triangles when it comes to trading?
Key points:
"1. In technical analysis , a triangle is a continuation pattern on a chart that forms a triangle-like shape.
2. Triangles are similar to wedges and pennants and can be either a continuation pattern, if validated, or a powerful reversal pattern, in the event of failure.
3. There are three potential triangle variations that can develop as price action carves out a holding pattern, namely ascending, descending, and symmetrical triangles."
-------------------------------------------
If you like the content, then make sure to comment and like the post :D
Follow me for daily profitable trading setups
BTC dictates the market. If BTC falls, then Alts will fall as well. Trade safe!

SAND LONG FINISHING PATTERNSand bounced off of a support 3 times, and is at the end of a flag pattern, after break out we should see retracement to the 50% fib zone.
Aroon: On a daily time frame we see orange line crossed a blue one which shows start of a bullish trend.
MACD: We are already seeing light red candles which indicates bullish movement gain.
Bollinger band: We just bounced off of a bottom Bollinger band which indicates bullish trends start.
Entry: 2.97
Invalidation: 1.95
Target: 5.38

Time to short Sand - again?In this post, a quick look at the SANDBTC pair, price action seems to show little to no effort to try and get past the Tenkan sen. In the past days it's found temporary support (dark blue line) while making lower highs, in a descending triangle fashion although I won't consider it as such because I prefer starting to count the lower highs within the triangle after the price has first found support, so just consider the orange dotted line as a simple resistance; nonetheless, the message conveyed by the price action stays the same, and I see no will to fight back from buyers. One thing that could argue for a reversal is that we've traded quite far away from the Kumo cloud for a while now, and the current price is a "fairly big but not huge" 12% away from the 25D MA: nothing really meaningful though until we get a clear sign of reversal from the PA, I believe. Ultimately, bias seems to be bearish for now. I probably won't be taking any trade myself for the moment, this post is for an information purpose mainly.

🔻 SAND SHORT🔻Hello everyone.
sand rejected from resistance and lost the support. Targets are in the chart.
🚨 Disclaimer: this is not a piece of financial advice always do your own research.🚨

SAND double bottom- Order block support
- Double bottom
- MACD curling up
- Bullish divergence
Looking for it to break and retest the trendline or the recent high before I enter. Preferably with some nice volume.

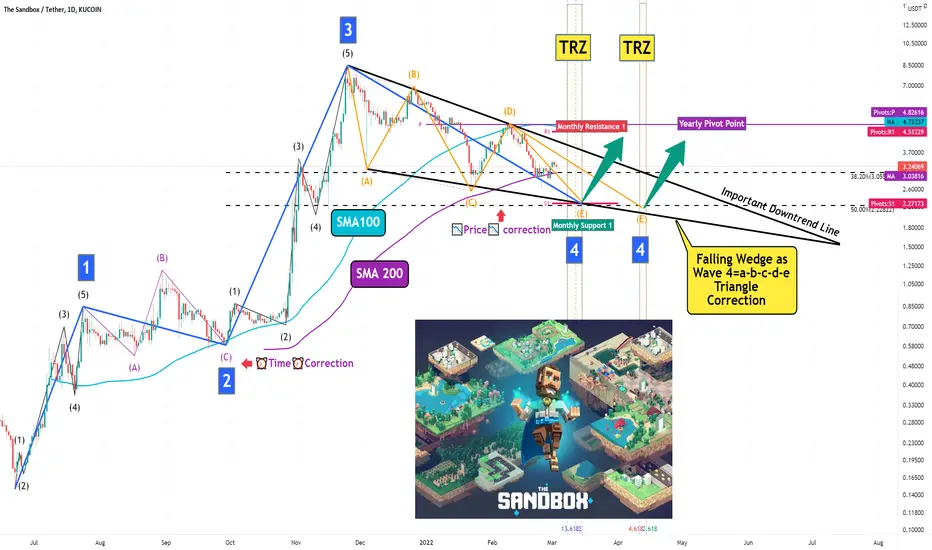
The Sandbox Analyze (Road Map)!!!🗺️What Is The Sandbox (SAND) ❗️❓
Launched in 2011 by Pixowl, The Sandbox is a blockchain-based virtual world allowing users to create, build, buy and sell digital assets in the form of a game. By combining the powers of decentralized autonomous organizations (DAO) and non-fungible tokens (NFTs), the Sandbox creates a decentralized platform for a thriving gaming community.
According to the official whitepaper, the Sandbox platform’s main mission is to introduce blockchain technology in mainstream gaming successfully. The platform focuses on facilitating a creative “play-to-earn” model, which allows users to be both creators and gamers simultaneously. The Sandbox employs the powers of blockchain technology by introducing the SAND utility token, which facilitates transactions on the platform.
The Sandbox Analyze ( LUNAUSDT ) Timeframe Daily ⏰ ( Log Scale )
Location 🌊: The Sandbox has passed the main wave 3 at 8.48$ . And then it started the main wave 4 In the form of Falling Wedge Pattern . I tried to show the end of the main wave 4 on my chart. So if you want to add The Sandbox to your portfolio , you can wait for it to break the Important Downtrend Line .
Where is the end of Main wave 4 ❗️❓
🎯 Target 🎯: Around 2.22$ probably at my TRZ ( Time Reversal Zone )
Do not forget to put Stop loss for your positions (For every position you want to open).
Please follow your strategy , this is just my idea, and I will be glad to see your ideas in this post.
Please do not forget the ✅' like '✅ button 🙏😊 & Share it with your friends; thanks, and Trade safe.

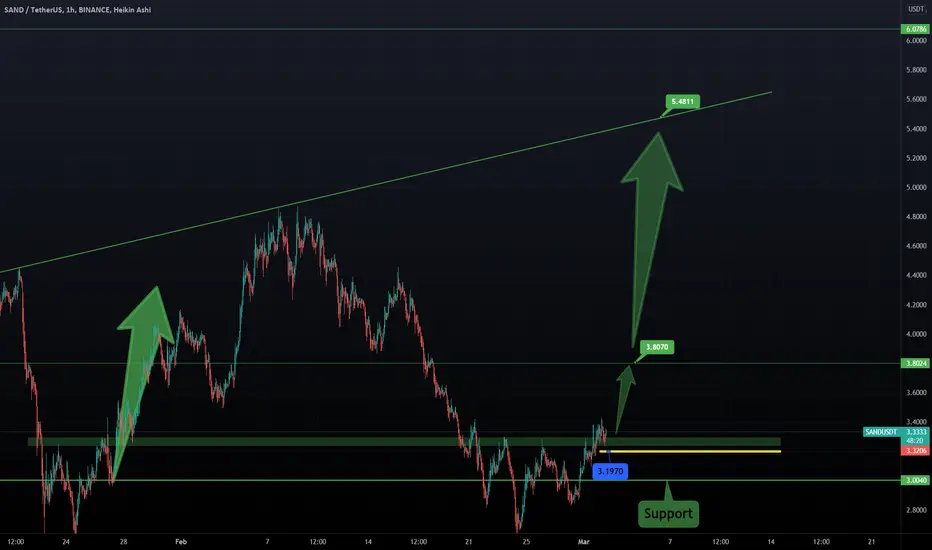
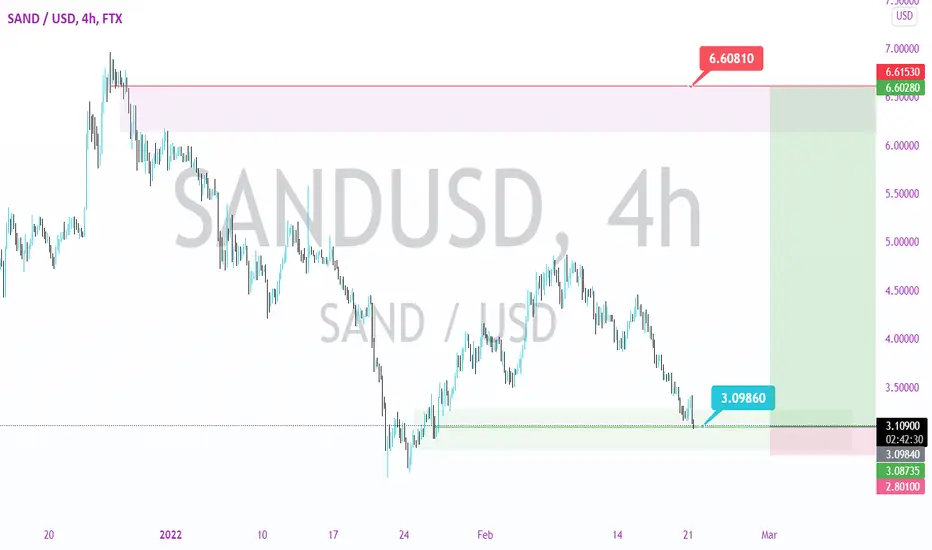
⌛🦜 SANDBOX Targets: 3,8$ and 5,4$ 🏴☠️☠Our updated chart on SANDBOX.
3,8$ and 5,40$ are our targets for the next months.
The project is great. here are some news about it:
Snoop Dogg Drops 10,000 Playable Sandbox Avatar NFTs – Mint a Unique Doggie and Explore the Metaverse in Style
Gucci is doubling down on its commitment to the metaverse.
The designer clothing brand announced on Wednesday that it’s bought an undisclosed amount of virtual land on the decentralized blockchain game The Sandbox.
Sounds and looks good to me, fundamentally and also on the chart. Time to go higher again? Why now!
One Love,
the FXPROFESSOR
2nd Bottom at 200day MA; Bullish Divergence In Falling WedgeWe have Bullish Divergence on both the RSI and MACD with a Double Bottom at the 200 day Simple Moving Average inside a Falling Wedge.

SAND, squeeze and breakout as a good buying opportunity. A key level of $3.28 can be highlighted on the SAND chart. At the moment, this level acts as resistance. The price has already tested this level several times, with each test the resistance is weakening. This means that a breakout might occur soon.
A squeeze and breakout could be a good buying opportunity.
Write in the comments all your questions and the instruments you want to see analyzed.
Friends, press the "like" button, write comments and share with your friends - it will be the best THANK YOU.
P.S. Personally, I open an entry if the price shows it according to my strategy.
Always do your analysis before making a trade.

SANDSAND bullish TA from technical + fundamental TA
Find entry, sl n tp in TA
Trade safe...
NB: Patience + risk management is key to winning trades.
SAND/USDT ChartHi, I try to post often so if you could follow and like it would mean a lot to me. I stream on TradingView.
SAND is looking good right now with the coin reaching the 3.50$ support. In the short term I think we can still see a drop to 3.45$ but the RSI is already undervalued in the 4H chart adn a bulllish divergence in the 1H chart. I think that in the short term 3.65$ seems a good taget. In the mid term I am bearish because BTC is not looking good and everything seems to think that we will fall again to the 37K-38K. With that drop I expect alts to underperform BTC. Comment what you think.
Next stream on friday at 3pm UK time. I didn't stream last friday because of internet problems. I will post everyday this week to make up for that mistake. Good luck on your trades.

SANDUSD | A final correction before the pump Hi everyone,
I would like to show you how SAND could evolve to my own opinion based on waves analysis.
First, as we can see we probably have reached our bottom on SAND around $2.55. If you have reloaded your positions during this last correction you have made a very good decision ! However, if you haven't done so, don't worry, you will have the opportunity to place again in our wave 2 correction.
Then, we are currently on the formation of our minor wave 5 which will complete wave 1 in order to start our correction phase on our wave 2. This one should approximately reach the 0.618 Fibonacci retracement before starting the big rebound.
Next, if this scenario is validated we can turn to our $10 goal during our wave 3 but we must be patient.
Finally, a quick update on the fundamentals of The Sandbox project. The adoption of the metaverse proposed by Sébastien Borget's team is progressing steadily. Indeed, several large companies are already starting to invest in plots like Ubisoft, Carrefour or Gucci and many others. The future of The Sandbox promises to be much brighter than we had hoped.
So we remain focused and above all we remain cautious.
Let's give SAND time to validate this analysis.
If you agree with this scenario let me know with a like.
Otherwise let me know your point of view with a comment, thank you !
(This is my own hypothesis and in no way suggests a buy or sell advice.)

SAND DAILY CLOSE ABOVE TRENDLINEHey Guys, SAND closed the daily above the trendline! Let`s get a new ATH!!
What are you thinking?

SAND (quick one)SAND could break trough the resistence on the daily... that could be a big pump to the upside!
What are you thinking guys?
Going to break through corrective channel$Sand looks like correction over. but we need to wait break out from the corrective channel first

DESCENDING TRIANGLE u can scalping it before the downtrend and short after the breakout or bouncing after candle touch the massive support

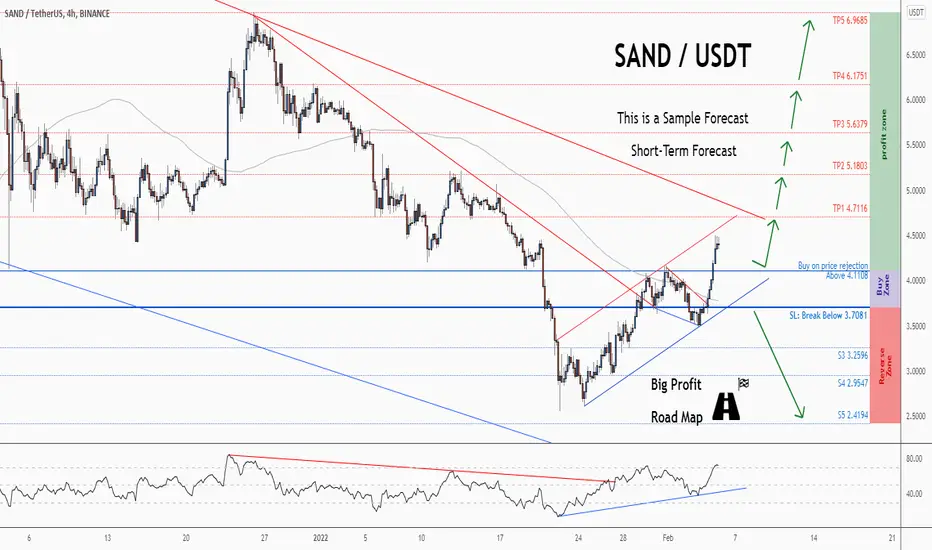
💡Don't miss the great buy opportunity in SANDUSD Trading suggestion:
". There is a possibility of temporary retracement to the suggested support line (4.1108).
. if so, traders can set orders based on Price Action and expect to reach short-term targets."
Technical analysis:
. SANDUSD is in a range bound, and the beginning of an uptrend is expected.
. The price is above the 21-Day WEMA, which acts as a dynamic support.
. The RSI is at 71.
Take Profits:
TP1= @ 4.7116
TP2= @ 5.1803
TP3= @ 5.6379
TP4= @ 6.1751
TP5= @ 6.9685
SL= Break below S2
❤️ If you find this helpful and want more FREE forecasts in TradingView
. . . . . Please show your support back,
. . . . . . . . Hit the 👍 LIKE button,
. . . . . . . . . . Drop some feedback below in the comment!
❤️ Your support is very much 🙏 appreciated!❤️
💎 Want us to help you become a better Forex / Crypto trader?
Now, It's your turn!
Be sure to leave a comment; let us know how you see this opportunity and forecast.
Trade well, ❤️
ForecastCity English Support Team ❤️
💡Don't miss the great buy opportunity in SANDUSD @TheSandboxGamTrading suggestion:
". There is a possibility of temporary retracement to the suggested support line (4.1108).
. if so, traders can set orders based on Price Action and expect to reach short-term targets."
Technical analysis:
. SANDUSD is in a range bound, and the beginning of an uptrend is expected.
. The price is above the 21-Day WEMA, which acts as a dynamic support.
. The RSI is at 71.
Take Profits:
TP1= @ 4.7116
TP2= @ 5.1803
TP3= @ 5.6379
TP4= @ 6.1751
TP5= @ 6.9685
SL= Break below S2
❤️ If you find this helpful and want more FREE forecasts in TradingView
. . . . . Please show your support back,
. . . . . . . . Hit the 👍 LIKE button,
. . . . . . . . . . Drop some feedback below in the comment!
❤️ Your support is very much 🙏 appreciated! ❤️
💎 Want us to help you become a better Forex / Crypto trader ?
Now, It's your turn !
Be sure to leave a comment; let us know how you see this opportunity and forecast.
Trade well, ❤️
ForecastCity English Support Team ❤️

SANDbox Beauty and perfectionIt is impossible to ask for more perfection to SANDbox. It has waves 1 and 2 (yellow) in place and is now at the heart of wave 3 (yellow). Wave 3 itself has 5 waves, of which wave 1 and 2 (white) have been built. Wave 3 of 3 (white) is in progress nad touched extension 1,236 and retraced to the 0,764 extension. This is textbook behavior. Now SAND is going to continue the upside movement to end wave 3, 4. and 5, which will complete all of wave 3 (yellow.). Ideal target is at 150. This is the region of confluence of 2,618 extension and 2,00 extension.

Update: #Sandbox #SAND 's 6 tasks on the daily chart ...Sandbox´s 6 tasks on the daily chart ...
1. break the FIB golden pocket (done)
2. break the RSI resistance (done)
3. hold the OBV support (done)
4. hold the FIB 0.786 and volume support (done)
5. flip the MA Ribbon bullish
6. confirm breakout(s) and have fun 😎
What do you think? 😎
Drop me a nice comment if you'd like me to analyze any other cryptocurrency.
*not financial advice
do your own research before investing

DigitalSurf: SANDUSDRecently just hearing of the Metaverse and deciding to take a look closer at SANDUSD (thanks for the idea, Big Dave). The all-time structure suggests that this NFT based virtual asset is currently in a diagonal wave for its Wave 5 move. Considering the present build of the said diagonal, it appears that it may develop in very volatile and aggressively bullish fashion.
I anticipate an upcoming test near the range of $10.
I also expect this test to find initial failure.
Upside pattern becomes immediately invalidated if the red line becomes broken.
For more analytical coverage of SANDUSD, BTCUSD and other promising cryptocurrencies, grab a board :)
