SANDUSD

SANDUSD ❕ near the trend lineTrading volumes have increased.
The price is near the trend line.
I believe the asset may rise after fixing above the upper boundary of the range.

✅TS ❕ SANDUSD: low volatility✅✅ SAND/USDT holds the uptrend line.
Volatility has declined.
We expect a rebound. ✅
🚀 BUY scenario: long to the resistance area. 🚀
----------------------------------------------------------------------------
Remember, there is no place for luck in trading - only strategy!
Thanks for the likes and comments

SANDUSDT on weekly support, long favorable towards weekly resistThe price has hit the weekly support and trading currently just above it. Since the price is around support, a long is favorable here.

SANDUSD Daily: 25/03/2023: First long then short!!!
You can see all the details on the chart.
Please pay attention, we need low-timeframe confirmation.
It's not investment advice, so do your own research!!!
If you have questions, feel free to ask!
💡Wait for the update!
🗓️25/03/2023
🔎 DYOR
💌It is my honor to share your comments with me💌

Buying these crypto for the next bull run(ZEC,FIL,SAND,MANA,XTZ)We are approaching very interesting entry points regarding these coins. We have confirmation entries in some of them and some risky entries in others. Let me know what do you think?

SANDUSD ❕ above the liquiditySAND trades above liquidity.
Price has fixed above 200EMA (4H TF)
The growth of the asset will continue after the resistance is overcome.

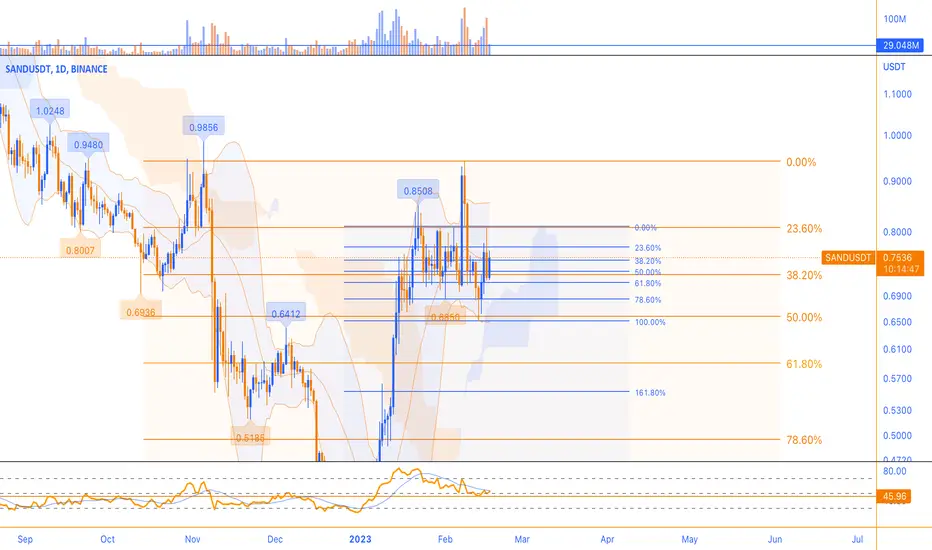
SAND had a strong bullish trend over the past weekSAND had a strong bullish trend over the past week, holding the support of the $0.70 range, creating a strong bullish wave on the daily timeframe.
The break of the previous ceiling has been confirmed, but there has been a strong reaction as the price has hit the resistance identified in the $0.90 range. One of the important resistance levels of the sandbox is in the range of $1 rand, which is the target of buyers.
Sandbox has had a range trend over the past week. The price fluctuates between the considered resistance support levels.
The support range of this currency is at the price of 0.610 to 0.670 dollars and its resistance is at the level of 0.880 to 0.900 dollars. Above this resistance, there is a very strong level in the $1 range, breaking these levels requires special support from buyers. Given the selling pressure created in the market yesterday, we expect the Sandbox corrective trend to deepen more likely, and by breaking the current support, the decline could continue to the $0.550 range.
But in the bullish scenario, if minor support is maintained in the range of $0.700 to $0.685, and in the 4-hour timeframe, we can expect another positive swing.
The important point for the medium and long term is the strong bullish wave started at the $0.40 range, if the supports hold, there is the potential for the sandbox to break the $1 resistance, to the $1.25 level. to continue
SAND TO HIT $1$SAND was below 200 daily MA since April, 2022!
This daily breakout candle is a strong buy signal indicator. Retest looks clean.

SANDUSD Bullish BAMMWe have alot of shorts popping up on SAND as the BTC price action remains sideways we also have Hidden Bullish Divergence and this is all happening at Session Levels; If this goes as expected we can see it move up about 10%

Like Sand in the hour glass...If you find this info inspiring/helpful, please consider a boost and follow! Any questions or comments, please leave a comment! Also, check out the links in my signature to get to know me better!
From an Elliott Wave stand point I would be looking for at least a sweep of the low. My main focus is on these levels that seem to be reactive atm.
I will be keeping an eye on these levels for plays.
Cheers!

SANDUSD ❕ ready to riseThe correction took place on declining trading volumes.
SAND is trading in a channel above the support area.
I expect the price growth.

Formation of the next bullish waveBuying pressure on SANDBOX increased again after going through a corrective trend, and buyer support led to the formation of the next bullish wave. The target that we considered in the previous analysis is seen, and the main target is in the range of $1.02. Of course, due to the high strength of yesterday's bullish candle, which is closed at the ceiling, there is also a possibility of breaking this resistance. Its strongest resistance is considered in the range of 1.42 to 1.49 dollars.

SAND Coin (Sandbox) : "Buy the dip" with a nice TargetHi everyone!
Sand's main trend is still bearish, but we do not rule out some interesting corrective moves in the near term. If our analysis is correct, it might be interesting to accumulate on corrective swing and let Long positions run up to 0.6765 area.
If this idea will be supported by your "Likes" we will continue to follow the crypto with updates below.
thanks for your attention and please... trade with care! 💖

#SAND $SAND #SANDUSDSand have to finish above the MA 200 with big volume to confirm we are in a bullish trend, only then i will enter the trade!

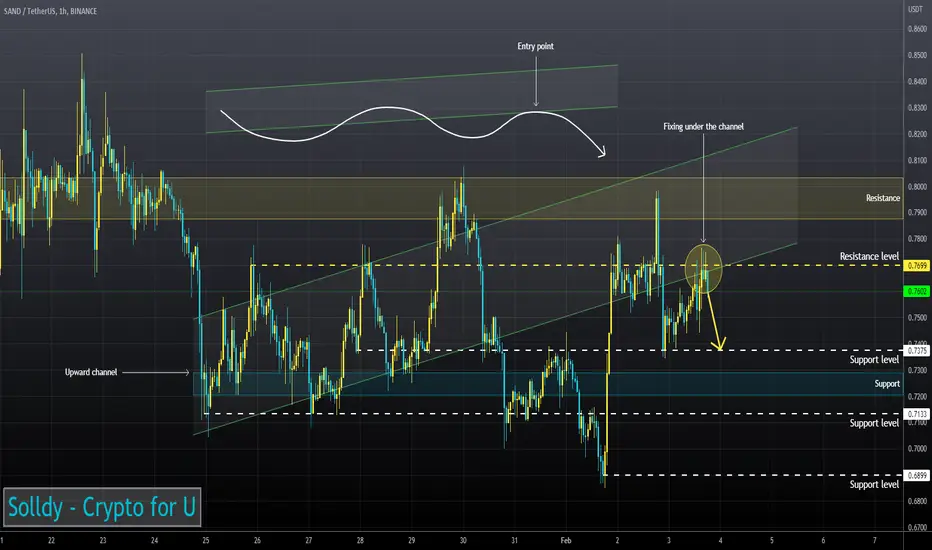
SANDUSD ❕ fixing under a channelSAND rebounded from the resistance area.
The price has fixed under the lower boundary of the channel.
I think the asset will continue to fall.
We can expect a stronger positive reactionSAND's price, which had a negative reaction in the resistance range of $0.805, pulled back to its support in the range of $0.657 to $0.750. If this area has a positive reaction, SAND can grow to the targets of the $1 range this week or next. The strength of the bullish wave is enough to change the trend in the daily time frame. But a bottom pivot and the formation of a corrective wave are needed, which with more probability, we can expect a stronger positive reaction in the second support range, i.e., the price of $0.584 to $0.641. So, if the support area of $0.67 is broken, the decline can continue to the level of $0.584, and in this area, we can expect the formation of reversal patterns.

Buyers' support allowed the price to continue movingSAND continued its strong uptrend over the past week, and buyers' support allowed the price to continue moving without a pullback after breaking through the $0.56-$0.59 resistance range. This 102% growth, which started from the floor area of $0.38, stopped at $0.75. A weekly resistance was considered in the $0.65-$0.74 area, which was broken in the past due to heavy selling pressure.
In the past few days, the price hitting this range has been accompanied by reactions, and in the 4-hour timeframe, we see the formation of a complete range area. More likely, the price can break the bottom of the range channel and enter a deeper corrective wave. The supports that can again create signs of positive reaction, and are considered the range of demand, are at the prices of $0.6423 and the range of $0.5600. But if the current resistance is broken, the next target for buyers after the pullback will be in the range of $1.0742 resistance.

NeutralSand
It was behind a downward trend for months , But now it has managed to break .
The last time we exited this currency with the beautiful identification of the channel ceiling and the number 8.36 .
If we manage to break 0.71 , we can set the next target at 0.96

Best entries for SAND and why I think it's a bull trap right nowI will be waiting for 25 and 20 cents to buy SAND if it couldn.t cross the the 200 EMA. If it did I will be entering after some retracement from the leg that broke the EMA maybe (61 or deeper retracement). Let me know what you think.

SAND continued its price growth last weekSAND continued its price growth last week. The support of the buyers caused the breaking of an important resistance in the range of $0.47-0.48. The increase in the price of the sandbox continued to the resistance range of 0.56 to 0.59 dollars. The bullish wave was corrected by hitting this resistance. The first hit of the $0.50 support area has given a positive reaction. But this quick return has increased the possibility of the price entering the range trend. Therefore, we expect to see a short-term range trend between the current resistance and support of this currency. Another support is considered in the range of $0.47-0.48, which, if the first high does not react positively and is broken, the price decline can continue to this level. According to the upward trend line, we can expect a stronger reaction from this range.

The Sandbox SANDUSDT price has a chance to form "Inverted H & S"It is very likely that the SAND token price of the once quite popular The Sandbox project is now close to the low of this protracted downtrend.
Looking at the global chart of SANDUSDT, it is safe to say that the price range of $0.38 - $0.45 is a tasty zone for placing buy orders with a grid. Of course, if you believe in this project and see future prospects in it and in the gaming crypto world in general.
The first target for the possible growth of the SANDUSD price is $1-1.20 (x3-x4 growth)
In the longer term, if and when the crypto market comes to life, we can think about the SAND price in the range of $2.50-3.50.
It is in this liquidity zone that the target of the probable "Inverted Head and Shoulders" pattern falls.
More precisely, the final growth target can be calculated when the formation of this pattern is finally confirmed.
Then we will update the idea of SANDUSDT with more specific targets for the final growth.
_____________________
Did you like our analysis? Leave a comment, like, and follow to get more

SANDUSD ❕ trading volumes increasedTrading volumes have increased and are still showing interest in the upside.
Price has broken up 200EMA on the 4H Timeframe.
TD Sequential forms a reversal signal up (30m TF)
With all these arguments, price has formed a gravestone at the peak on the 4H Timeframe.
I expect growth after the completion of the correction.
