SANDBOX ⌛🦜 Could Accelerate 🏴☠️☠Technically speaking we had the perfect buy-back level when sellers got exhausted:
Fundamentally STRONG:
Key Insights
Given the overall market cool off, secondary sales of digital land parcels decreased 54% but are still up 865% from Q3 2021.
Primary sales grew 23% from new parcel issuance.
The Sandbox reached 2+ million registered users upon the launch of the Alpha Season 2 gameplay in March 2022.
A gasless staking program launched on Polygon.
The Sandbox focuses on partnerships across gaming, music, entertainment, and sports engagement.
The Sandbox in a Nutshell
The Sandbox is a platform for both creating and hosting entertainment experiences in virtual worlds. In The Sandbox, anyone can create 3D assets like buildings, in-game items, and non-player characters. These assets can then be used to build diverse experiences including games, music and fashion events, social activities, quests, art exhibits, and contests. The Sandbox offers creators a set of intuitive tools that require no background in coding or in designing experiences. These tools include a 3D editor for making and animating items, a game maker for making experiences, and a game client. The Sandbox is actively working on making these tools as user-friendly as possible in order to unleash the creativity of its community. For instance, the 3D editor combines different in-game tokens to create user-generated assets.
These user-generated assets are ERC-721 non-fungible tokens that can be monetized on open markets. The Sandbox ecosystem leverages a series of tokenized gaming features including: a digital in-game currency used for purchases, monetization, and asset creation (i.e., SAND); ownable digital land within The Sandbox virtual world (LAND); a combination of LANDs to create a larger plot (ESTATE); a bundle of assets and scripting logic to create interactive experiences (GAMES); 3D virtual images created by players (ASSETS); tokens burnt to give attributes to assets (GEMS); and tokens burnt to create ASSETS (CATALYSTS). Thanks to the tradeable nature of these user-generated assets within its virtual world, The Sandbox has robust in-game economics.
In addition to owning the assets that they build, creators will be able to make experiences available on LAND parcels in The Sandbox Metaverse. The long-term goal of The Sandbox is to enable creators to build immersive experiences. The possibility to monetize LAND and in-game experiences has attracted investors to acquire LAND. The top owners of LAND include large investors in The Sandbox, such as Binance, Everyrealm, and Galaxy Interactive, as well as NFT communities such as Whale, MetaKovan, and Cyber Kongz. In addition, The Sandbox is actively forming partnerships with businesses that are willing to develop experiences within its virtual world and become early adopters. These partnerships span a suite of business verticals including gaming, music, entertainment, fashion, and lifestyle, to name a few. Partnership examples are presented in “The Sandbox Ecosystem: Notable Events” section below.
Macro Overview
There is a finite amount of Sandbox LAND — 166,464 parcels. New LAND parcels are subject to primary sales — they are sold to private entities (in partnerships) or released for sale through auctions. Notably, 65% of all the LAND parcels have already been distributed, up 2% from Q4 2021.
As the volatile Q1 2022 has come to a close, LAND secondary sales volume decreased by 54% compared to the previous quarter. To put this into perspective, the secondary sales volume in Q1 2022 is still up 865% relative to Q3 2021. This quarter's decrease is the result of the metaverse hype starting to settle down since Meta's rebrand announcement in October 2021. The market is merely finding its equilibrium, and demand for LAND remains healthy despite the buying frenzy of Q4 2021.
At the same time, relative to Q2 2021, primary LAND sales grew 23%. The subject of primary sales are LAND parcels that are newly issued and are usually either sold to partners or through auctions. Still, primary LAND sales volume ($16 million) accounted for only 12% of the marketplace LAND sales volume ($136 million) in Q1 2021.
In terms of usage, The Sandbox launched the Alpha Season 2 of its gameplay in March 2022. Notably, during this launch, The Sandbox reached 2 million registered users. Considering the launch lasted four weeks, tracking its active daily or monthly users isn’t useful at this point. Instead, unique LAND buyers may be an alternative proxy for the interest in LAND utility.
The number of monthly active LAND buyers is back to the more sustainable levels seen before Meta’s announcement in late October 2021. This poses the question of what drives the value of digital land in The Sandbox virtual world, given that only a limited number of its users are currently being able to host and monetize experiences.
In our previous quarterly report, an in-depth analysis uncovered that LAND ownership is fairly concentrated, with the top owners holding onto their parcels. A follow-up question is whether this holding behavior is specific only to top owners. This quarter’s report analyzes the LAND holding time and discusses the potential implications on the value of land in virtual worlds.
Micro Overview — Holding Behavior
In an effort to understand LAND holding time, one may consider various clusters of buy & hold behavior. In this sense, one can think, for instance, of long-term buying behavior as holding onto parcels for longer than one year, while buy & sell could be described as holding periods shorter than 30 days. The current breakdown of the LAND holding time reveals that 7% of purchasers hold LAND for longer than one year, while 11% of purchasers hold LAND for less than 30 days. At the same time, the vast majority (72%) of LAND buyers hold the asset for 1–3 months.
Sandusdt

SAND Swing trade opp$SAND Short opp with potential Triple top(TT) around daily supply zone.. As long as price doesn’t break $1.35 I expect Bears selloff to retest June lows at $0.95 and $0.73, first target $1.05..
If Today Closes below $1.19 it’ll trigger the TT short..
Break above $1.35 will invalidate TT and instead trigger Bull flag long opp with measured move target at $1.82..
Eyes on the Charts..

AXSUSDT 6H TA: Breaking TrendLineAccording to the chart, the line has broken the downward trend and if it can break the resistance of $15.5, it can move up to $19. A buy offer is given at $15.5 if the resistance is broken.
Its not Buy or Sell SIGNAL
DYOR
BY : Mohamad Teriz - @AtonicShark

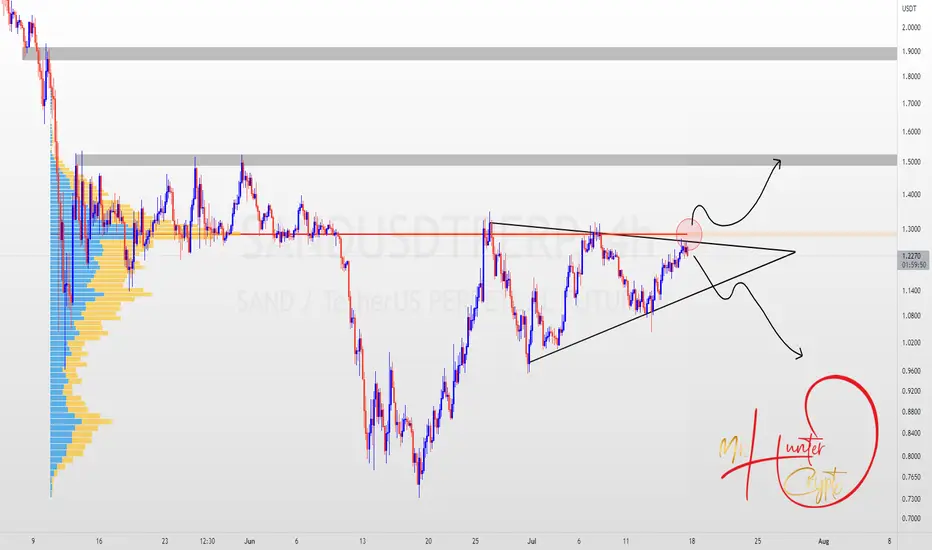
SANDUSDTPERPAs shown in the chart, the price is being rejected when it reaches the ceiling of the triangle pattern and the area of volume density. If the price can break this area, it can grow as much as the triangle pattern. Otherwise, expect the price to fall and hit the bottom of the triangle. And the price continues to fall
SAND : if this weekly close green If the weekly candle close green
Then it looks so good , MACD is crossing up as well as RSI weekly oversold

Sand signal was got its second TP The great shot in Sand with 15% spot profit.
this signal had two target and second Tp was the exact point to raise again .

BITCOIN 6H TA: Can bullish?Given the previous chart, we have properly predicted the loss to the specified support level. We have now identified the possible scenarios according to the trend line and the support and resistance in the 6-hour time frame. By losing the line, we will have up to $ 18500 and $ 17300, otherwise the price increase to the specified resistance range is not unexpected.
Its not Buy or Sell SIGNAL
DYOR
BY : Mohamad Teriz - @AtonicShark

ANOTHER CHANCE TO SHORT SANDUSDTHELLO GUYS!!!
in my opinion sand still has bearish trend and that gray zone that I mentioned as "best entry level" it's great for entry but if you missed that that is fine you can get another short position like what I recommend on the charts!
best luck
thank you for you attention please like and follow!

SAND Medium-term trade - our target $1,795Hello colleagues! We decided to publish the trade we entered tonight using a limit order.
This medium-term trade is carried out on the basis of the long-term forecast for SAND , which we published on July 5:
Details of the medium-term trade in SAND cryptocurrency:
Entry: $1.1026
Stop: $0.9157
TP : $1.795

SANDUSDT long with huge potentialJust a great trade with A LOT of future POSSIBLE profit.
We can see a FALLING WEDGE that we have already BROKEN. Price is trying to settle above the MA 50. Also we have small trend line that probably will help SAND to settle above MA and than we will have TWO really strong supports and just as strong pattern behind.
Here is info about preferable POSITION:
SANDUSDT LONG
ENTRY: 1.162 (+- 0.01)
SL: 0.942
TP1: 1.99 (40% of position)
~AFTER reaching TP1 move SL slightly beyond entry point~
TP2: 3.69 (35% of position)
TP3: 6.25 (25% of position)
Personally I am performing this position using leverage 3x. But it DOESN'T MATTER as long as you follow PM and RM (if you don't know what does this mean. I strongly recommend you to read and learn topics of risk and portfolio management)

Head and shoulders Enteri: 1.10_1.15
Sl: 0.95
Tp1: 1.73
Take profit zone: 1.93_1.96
🚨cross moving 100&200 in 4H time
🚨head and shoulders
🚨FOLLOW FOR MORE

SANDUSDT | Wave Projection | Inverted H&S Target 4-Wave breakoutPrice action and chart pattern trading
> Inverted head & shoulders upcoming breakout for uptrend 4-wave, estimated retracement 0.382 retracement zone of previous 3-wave and is exactly equal to the Inverted H&S Target
> Key resistance at downtrend upper channel resistance
> Indicator: RSI bullish above 60 and MA line
> Entry @ H&S breakout
> Stoploss @ right shoulder - 20% downside
> Target Wave 4 + 40%
> Risk reward ratio: 2:1
Always trade with affordable risk and respect your stoploss

SAND +27✅ after the last idea! Where is the next entry point?Hi friends! I hope you find the entry point last time and open a trade ✅with good RR!
Additionally, you can open lon using this BTC ✅free trading idea.
📊Now SAND is in 27% profit. Check this idea to understand the preconditions to open a trade if you a newcomer.
Now we can expect the local pullback. Of course it happen if BTC will not continue it`s pump to 24-25k in a few days and consolidate till the monday.
What you should expect:
🔥squeeze to the trendline
🔥bullish BTC
🔥false breakouts and liquidity colletion. The price can make shakeout to the $1-1,05 value areas
🔥volume growth - sogn of bulls and buyers
🚩Targets:
1️⃣$1.5 - key level
2️⃣$1.68-1.85 - value area
💻Friends, press the "like"👍 button, write comments and share with your friends - it will be the best THANK YOU.
P.S. Personally, I open an entry if the price shows it according to my strategy.
Always do your analysis before making a trade.

2D Buy on $SAND.The atmosphere for a bull cycle within this bear market appears to be developing.
UCTS is indicating a 2D Buy on $SAND.
In search of a break or flip above the range high ($1.5) as a continuation
Sand/btc droped as I signaled it beforeSand / BTC droped from the third wave and make head and shoulder pattern

Price Determinant Range!Hello to all members of TradingView and my followers.
SAND continued to rise to $ 1.30 after a break of $ 0.80 last week with the support of buyers. The Sandbox continued to decline due to the dynamic resistance and the static resistance level of $ 1.20 to $ 1.30. Again, with the downturn in the market, there is selling pressure to move the price towards $ 0.80 support. If the monthly support is maintained, there is a strong growth potential up to the main downtrend range, ie, the price of $ 1.50 and the next target of $ 2. For the current week, as long as the price is below the $ 1.11 level, the price will move towards the support of $ 0.90 and $ 0.77.
If it is helpful to you, please like it. If you have a comment, I'll be happy to know. Respectfully.

Continue the good growth of last week?Hello to all members of TradingView and my followers.
SAND had good growth last week. It was one of the most active coins on Thursday, with values increasing by as much as 14%.
After reaching a low of $1.13 on Wednesday, its pair reached a session high of $1.28 earlier today.
The buying pressure has brought the price to the resistance range of $1.18 to $1.26, and if the buyers can stabilize the price of this currency above the resistance range, considering that the reverse head and shoulder pattern is also formed on the chart, in this case, the pressure Buying can lead the price to the resistance area of the ceiling of the descending channel.
The resistances of SANDBOX are in the ranges of 1.38, 1.55, and 1.85 dollars. A downtrend line is also drawn inside the channel; if it is not broken, the price can even break out of the downtrend channel.
In general, I expect the price to react negatively after hitting the $1.70 range resistance, and there is a possibility of a correction towards the supports.
If it is helpful to you, please like it. If you have a comment, I'll be happy to know. Respectfully.

SANDBOXSAND/USDT look at the chart we have 2 Support Zone and one Resistance zone should you think it will be followed that we expect in the chart!
Disclamer:
We are not financial advisors. The content that we share on this website are for educational purposes and are our own personal opinions.


BITCOIN 4H TA: Support TrendLineIn the previous analysis, we mentioned the price range of Bitcoin, which is out of this range and the upward trend line is formed in the 4-hour time frame. If the support of this line is maintained and it can break the resistances, we will see an increase in the price, and if not, we will have a correction to the important support area.
Its not Buy or Sell SIGNAL
DYOR
BY : Mohamad Teriz - @AtonicShark

Sand - Another one bites the dust!💨Reasons to take short if BTC allows:
⭐️ Trendline is 3 days long
⭐️ Trendline is clean
⭐️ Price is squeezing to the trendline
⭐️ Volume appeared at top
⭐️ Buyer is getting weaker
⭐️ 5th touch
⭐️ Under VWAP
Will enter when price squeezes to the trendline on 5m timeframe, the base will form and the tape will get faster.
If you don't understand the previous sentence, just use swing stop-loss 3-5%
Fix profit by parts:
1% - 1/3
2% - 1/3, stoploss to breakeven
What's left, hold to the maximum
What do you think of this idea? What is your opinion? Share it in the comments📄🖌
If you like the idea, please give it a like. This is the best "Thank you!" for the author 😊
P.S. Always do your own analysis before a trade. Put a stop loss. Fix profit in parts. Withdraw profits in fiat and reward yourself and your loved ones

Sand drop signal Sand creates a huge divergence and returns from its downward trendline.
I published Sand/Btc too and this pattern exists there too.

SAND - Buying SignalBYBIT:SANDUSDT
4 Hours time frame
-
SAND is showing a potential double bottom here
We can long it here with strategy as below.
-
Targets:
1) 1.3491
2) 1.5173~1.585
3) 1.6582
Stop:
1) 1.1507
