SANDUSDT Breaks Major Downtrend – Golden Pocket Retest!
Technical Analysis:
SAND/USDT has successfully broken out of a descending trendline that had been capping the price since late 2024. The breakout occurred with increased volume, signaling strong buyer interest.
Following the breakout, price rallied and is now retesting a key support zone, which includes:
A demand zone (yellow box) between 0.2748 - 0.2885, aligning with the Fibonacci Golden Pocket (0.618 - 0.5)
A solid horizontal support around 0.2913
Fibonacci retracement levels are clearly defined:
0.3126
0.3467
0.4010
0.5417
Up to major resistance near 0.9384
---
Bullish Scenario 🟢:
If the price holds above the Golden Pocket zone and prints bullish confirmation (such as a bullish engulfing or hammer candlestick), then further upside potential is likely:
1. Initial targets: 0.3126 and 0.3467
2. Mid-range targets: 0.4010 and 0.5417
3. Long-term potential: 0.6981 and possibly the major resistance at 0.9384
Stronger confirmation would come from a daily candle closing above 0.3126.
---
Bearish Scenario 🔴:
If price breaks below the 0.2748 zone, it could indicate a failed breakout, potentially leading to:
1. Initial support: 0.2700
2. Deeper pullback zone: 0.2131 (previous low)
3. Potential fakeout of the trendline breakout
A daily close below 0.2748 would strongly validate the bearish setup.
---
Chart Pattern Overview:
Descending Triangle Breakout already confirmed
Price is now in the retest phase of the breakout
The Golden Pocket Fibonacci zone is the crucial point of trend continuation or reversal
---
Conclusion:
The breakout from the long-standing downtrend marks a strong shift in structure. However, a successful retest at the Golden Pocket will be key to confirming further bullish continuation. If buyers defend this zone, SAND is likely to print a higher low and resume its upward move.
#SANDUSDT #CryptoBreakout #AltcoinAnalysis #TechnicalAnalysis #FibonacciLevels #TrendlineBreakout #GoldenPocket #BullishSetup #BearishSetup
Sandusdtidea

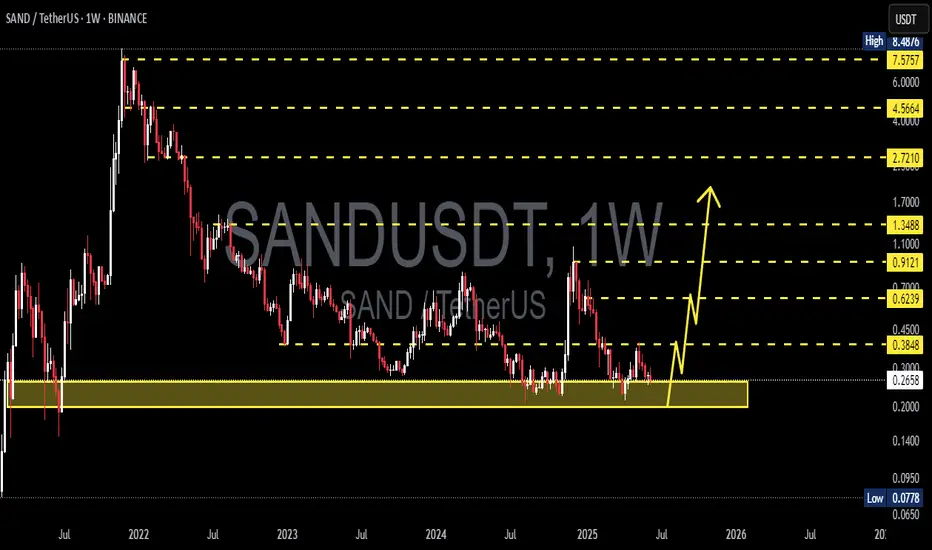
SAND/USDT at Critical Support Zone – Rebound Potential?Detailed Technical Analysis:
The SAND/USDT weekly chart shows the price currently hovering around a historically strong support zone between $0.20 – $0.25. This yellow-marked demand area has been tested multiple times since 2021 and has consistently prevented further downside, making it a crucial decision point for both bulls and bears.
🟢 Bullish Scenario:
If the price manages to hold this key support and prints bullish price action (e.g., a bullish engulfing or hammer candlestick), a reversal is likely. The projected upward path on the chart outlines the next key resistance levels:
1. $0.3710 – Initial resistance.
2. $0.4500 – First major breakout confirmation.
3. $0.5825 - $0.7000 – Mid-term resistance cluster.
4. $0.8218 - $1.3530 – Longer-term targets if bullish momentum sustains.
Bullish Confirmation:
Weekly candle close above $0.37
Breakout with strong volume beyond $0.45
🔴 Bearish Scenario:
If the price breaks below and closes under the $0.20 support zone, it would signal a bearish continuation, with possible downside targets at:
1. $0.14 – Minor historical support.
2. $0.09 - $0.075 – Extreme low support region and historical bottom.
Bearish Confirmation:
Weekly close below $0.20
Strong breakdown volume without immediate bullish rejection
📊 Chart Pattern Overview:
✅ Triple Bottom / Accumulation Zone:
The current support area resembles a potential triple bottom structure or long-term accumulation phase. If confirmed, this pattern could mark the beginning of a new bullish cycle.
🧠 Conclusion:
SAND is at a make-or-break level. As long as the price holds above the $0.20 - $0.25 support zone, bullish recovery remains a valid possibility. However, a breakdown below this level could trigger a significant bearish move.
#SANDUSDT #CryptoAnalysis #AltcoinSeason #TechnicalAnalysis #BullishScenario #BearishScenario #CryptoTrading #PriceAction #SupportResistance #TripleBottom

SANDUSDT 1W AnalysisSAND ~ 1W Analysis
#SAND Buy back gradually from here if you still have confidence in this coin with a short term target of at least 20%+ from this support.
SANDUSDT 1D Analysis SAND ~ 1D Analysis
#SAND Buy gradually from here if you still have confidence in this coin with a short term target of at least 15%+ from here.

SANDUSDT 1D AnalysisSAND ~ 1D Analysis
#SAND Buy gradually after successfully penetrating this resistant line with a short -term target of at least 15%+.

SANDUSDT 1WSAND ~ 1W Analysis
#SAND Buy from here if you still have a Conviction on this coin with a short -term target of at least 20%+.

SANDUSDT 1WSAND ~ 1W Analysis
#SAND Buy gradually from here if you still have a Conviction on this Coin with a minimum target of 20%+

SANDUSDT 1WSAND Update ~ 1W
#SAND Still maintaining its bullish structure. This is the 2nd wave in the Eliot Wave pattern. Buy in stages. Target 20%++

sand idea"🌟 Welcome to Golden Candle! 🌟
We're a team of 📈 passionate traders 📉 who love sharing our 🔍 technical analysis insights 🔎 with the TradingView community. 🌎
Our goal is to provide 💡 valuable perspectives 💡 on market trends and patterns, but 🚫 please note that our analyses are not intended as buy or sell recommendations. 🚫
Instead, they reflect our own 💭 personal attitudes and thoughts. 💭
Follow along and 📚 learn 📚 from our analyses! 📊💡"

SANDUSDT 1WSAND ~ 1W
#SAND So far continuing to maintain this support Block,. If you still have Conviction on this coin,. Buy in increments on this support block, with a minimum target of 20%++

SANDUSDTSAND ~ 1W
#SAND If you still have Conviction on this coin,. This support block would be a very good buy for now.

SANDUSDTSAND ~ 1W
#SAND We think this key support will start to be retested. If this support block is strong enough to hold the price,. then the price will bounce off this support block.
We will update if plans change to this Chart.

SANDUSDT 1WSAND ~ 1W
#SAND Double Bottom-up will be formed here. all you need to pay attention to is that BITSTAMP:BTCUSD is not decreasing again. then this pattern will be a continuous increase.

SANDUSD 1WSAND ~ 1W
#SAND The H&S pattern is formed from this.
Make purchases in stages with a target of at least 20%+ from here.

SAND/USD - Bullish Potential Identified at Key Support ZoneKey Support Area Analysis:
SAND/USD is currently positioned at a critical support level, historically significant as a former resistance zone. This level also coincides with the 4-hour trendline, reinforcing its importance in our analysis.
Bullish Outlook:
Considering the convergence of support factors, our analysis suggests a bullish bias for SAND/USD from this juncture.
Trade Recommendations:
Entry Point:
We recommend taking entry near 0.59085, aligning with the support zone and anticipating the initiation of a bullish move.
Stop Loss:
To mitigate potential downside risk, it is prudent to set a Stop Loss near 0.5350, strategically placed below the support level.
Take Profit Targets:
We propose the following Take Profit levels:
- TP-1: 0.6487
- TP-2: 0.7038
- TP-3: 0.7600
These targets are derived from technical analysis and represent potential areas of resistance where profit-taking could be considered.
Risk Management:
It is essential to adhere to sound risk management principles, including proper position sizing and adherence to the predetermined Stop Loss level.
Conclusion:
In conclusion, the technical analysis suggests a favorable risk-reward opportunity for a bullish move in SAND/USD, with clear entry, exit, and risk management parameters outlined. Traders should monitor price action closely and adjust their positions accordingly as the market evolves.

SANDUSD 1WSAND ~ 1W 📈
#SAND Pay attention to this resistance line, you can start making purchases after this resistance line is successfully broken. With a minimum target of 20%+.
Attention, active buying after this resistance is successfully broken

SAND/USDT AnalysisSAND has recently surged, breaking free from its weekly downward trend and presenting a significant growth potential in the upcoming period. There is an opportunity for a potential 5x increase. Key targets include $0.7, $1.3, and $2.6.

SAND showing a very impressive investment opportunityHi Everyone;
today we have one of the best risk to reward Investment opportunity
it is more than 550 times the risk and the chart is look very promising.
I expect breaking the previous bear market key point will clear the way to the final target

SAND target 0.564h time frame
-
SAND is creating a potential bottom head and shoulders, the right shoulder hasn't been formed yet. Currently, 0.37 achieve the condition of HS, but shall notice another possibility that SAND go back to 0.35 to make the low of right shoulder.
I will provide another trading plan if SAND reach 0.35, and now we can follow this plan which targets as below.
TP: 0.56 / 0.66
SL: 0.381

SANDUSDT relevant support and resistance levelsThe price bounced from weekly support WS1 and head towards 4h resistance 4HR1. From there it was rejected and pulled back. It seems logical that the price will visit the daily support again before attempting the 4h resistance 4HR1 again. Anyways, a long is favorable from daily support if the price reaches there. Overall all the relevant supports and resistances are marked and the principle remains same: long the support and short the resistance.

SANDUSDTI am still expecting a drop for SANDUSDT. Resistance seems to be holding really nicely. Just have to wait and see how it plays out.

SAND LONGHELLO folks
sand now going to uptrend wave analyisis and smc
entry : 0.47
sl : 0.444
tp : 0.68
dyor

SAND/USDT. BitVero Crypto Academy.
Disclamer:
We are not financial advisors. The content that we share on this website are for educational purposes and are our own personal opinions.
