Sbinanalysis
SBIN--Which is Support Trendline or Resistance??Observations::
the stock is trending upwards.
------>>Today SBIN is showing Bearish pressure.
-------->>Bearishness is continue or Reversal May Happen at 570 levels.
---------->>Previously A strong selling pressure is observed at 570 level ,look at the reaction at these levels to go upside or downside.
---------->>Previous Resistance if turned as Support again, price will rise.
------------>>price break and acts as resistance more fall is going to observe. keep an eye at these levels.
------>> we have a trendline support as well, keep look at these levels.
Please like, if this information is Helpful.
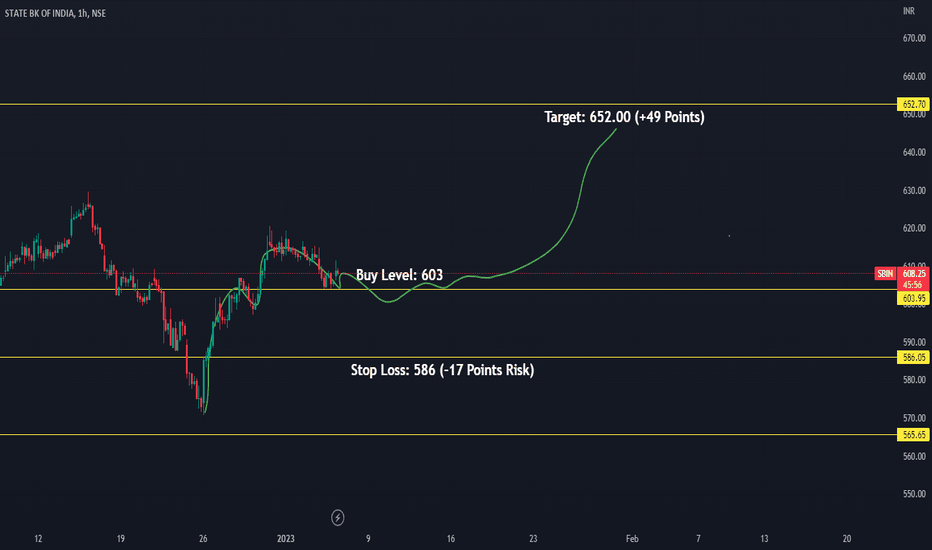
SBIN Conditional Buy levels 28.03.2023This is conditional buy view on NSE:SBIN . If 45min candle closed above 515, we can make a entry with stop loss of 507. My expected upside target will be 528.00. It would be positional trade for 1-2 days.
Note: This is my personal analysis, only to learn stock market behavior. Thanks.
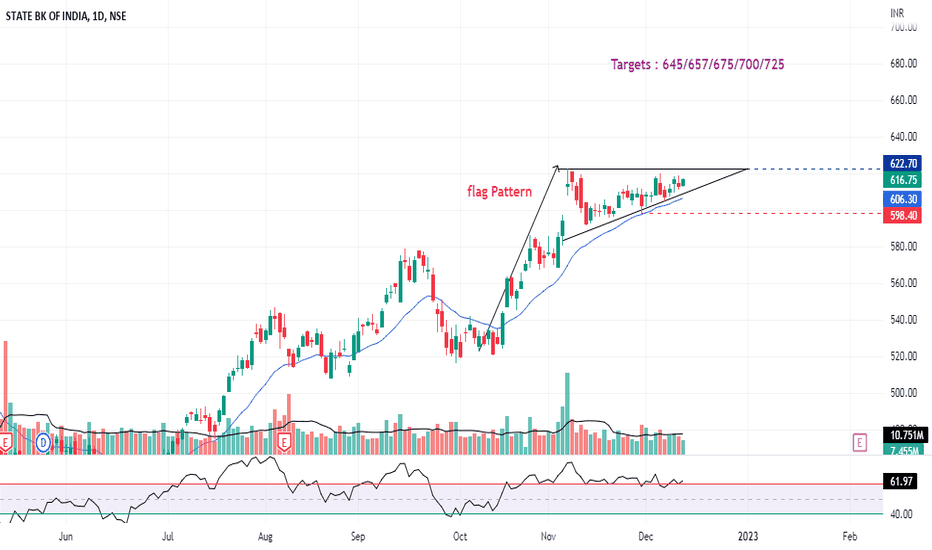
SBIN : Breakout Candidate (Flag Pattern)#SBIN : King of PSU Banks in a kind of Flag structure, Breakout Candidate Soon.
Good Strength in all 3 Time Frame (D/W/M)
Banking Sector will Grow as long as Indian Economy grows.
Take 10% & keep Trailling.
Happy Trading !!!
Keep Sharing, Loving & following to Learn more.
SBI Levels & Strategy for next few daysDear traders, I have identified chart levels based on my analysis, major support & resistance levels. Please note that I am not a SEBI registered member. Information shared by me here for educational purpose only. Please don’t trust me or anyone for trading/investment purpose as it may lead to financial losses. Focus on learning, how to fish, trust on your own trading skills and please do consult your financial advisor before trading.
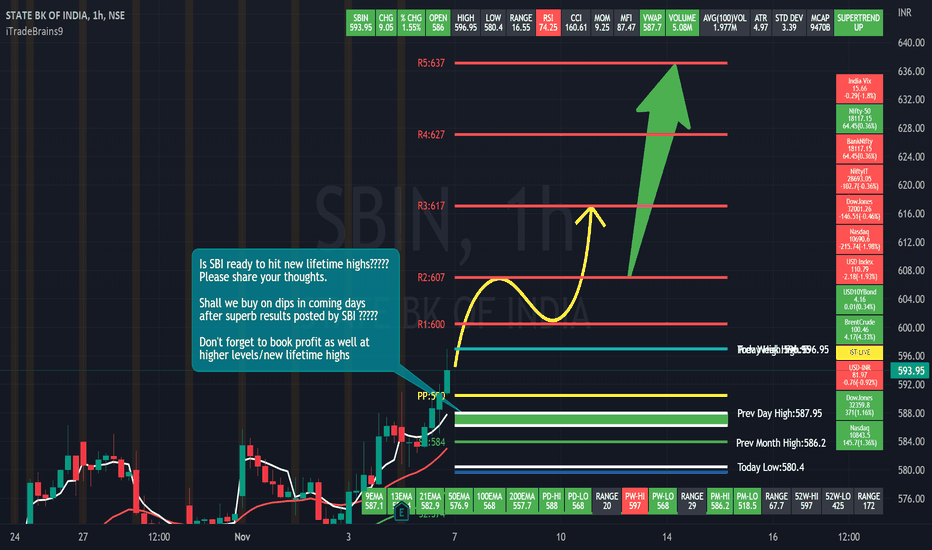
SBI has posted excellent results and clearly beat the market expectations. I am feeling quite happy for long term investors who are consistently getting rewarded. SBI is trend is positive & momentum on buying side is strong. Buy on dips strategy is working well in SBI, however traders must be careful near new lifetime highs and work level by level with strict stoploss and maximize the profit using trailing stop loss.
Shall we wait & look for buy on dips opportunity in SBI in coming days?????
Yes, I think so.
Shall we book profits near major resistance levels/near new lifetime high?????
Yes, I think so.
Shall we short SBI near new lifetime high?????
We should avoid to short.
Is correction in coming days due to imported weakness in Indian market/RBI rate hike to curb inflation, likely to be buying opportunity for traders & long term investors????
Yes, I think so.
Please share your thoughts as well. Good luck to traders & investors for profitable trading in SBI.
SBIN - TRADE PLANCheck out the trade plan for SBIN today based on the technical analysis. Hope this analysis is useful, make sure to hit the thumbs and also follow my tradingview profile for future updates. Thank you!
SBIN has Revisited the resistance and is now in consolidation under this resistance and support zone.
SBI Daily Chart - Evening Star Pattern with high selling volumesDear traders, I have identified chart levels based on my analysis, major support and resistance levels. Please note that I am not a SEBI registered member. Information shared for educational purpose. Please do take trade based on your own analysis and risk-taking abilities. Never ever worked with fixed mindset. Any news/result data may change the direction of the trend instantly. Focus on learning so you can take correct/better decision based on your analytical skills. PLEASE NOTE THAT NO ONE CAN BE 100% CORRECT. OVERALL, WE SHOULD CONTINUE TO LEARN & BE ABLE TO CLOSE IN PROFIT EVEN IF WE ARE 50% CORRECT WITH RISK REWARD RATIO 1:2
Evening Star Pattern near 52 W high- Reversal Pattern. Shall we expect profit booking after decent rally in SBI?


