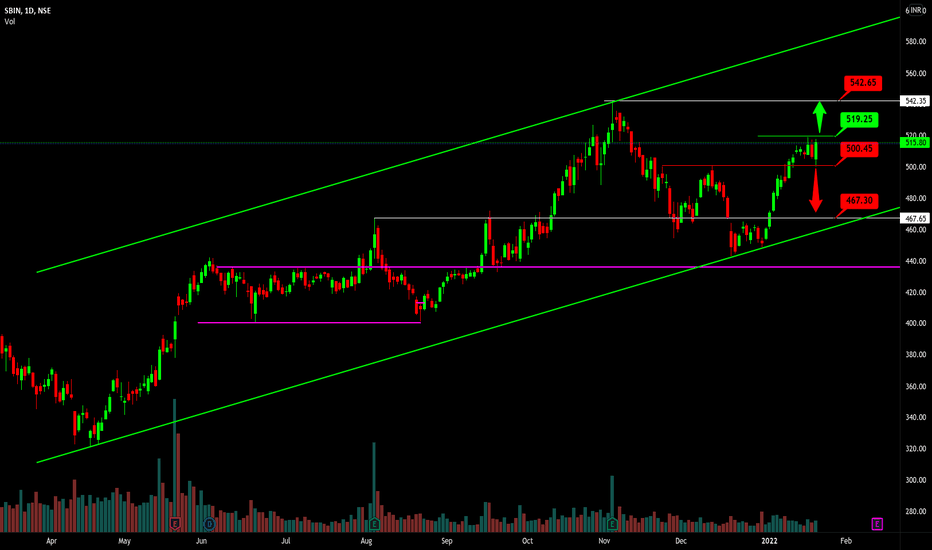
SBIN SBIN is currently trading around ₹800 and is positioned at a crucial support/resistance zone (around ₹790–₹800). This level previously acted as resistance and may now act as strong support.
Before taking a trade, two scenarios should be clearly considered:
1. Upside Confirmation (for a Bullish Trade):
If SBIN closes above ₹805–₹810 with strong buying momentum, a long (buy) position can be initiated.
Target: ₹840 / ₹870
Stop Loss: Below ₹788
2. Downside Confirmation (for a Bearish Trade):
If SBIN gives a daily close below ₹790 and the support breaks, a short (sell) trade can be taken.
Target: ₹765 / ₹740
Stop Loss: Above ₹805
DISCLAIMER: I am NOT a SEBI registered advisor or a financial adviser. All the views are for educational purpose only
Sbinbuy
SBIN : at Wave C completion zoneSBIN Analysis (20th Dec 2024)
The chart of SBIN (State Bank of India) illustrates an extended retracement to mitigate liquidity, a failed breakout (BO), and a corrective wave completion. Let us dive into a step-by-step educational breakdown of actionable levels.
Current Structure:
The price has recently formed a corrective wave structure (A-B-C) and is trading near a potential demand zone around 818-834.
The first target zone lies between 850-852. Further breakout could lead to an extended target between 900-912.
The stop-loss is below 814, where failing the deep retracement may result in bearish continuation.
Action Plan:
Buying Opportunity: Consider entering near 818-834, as this aligns with the golden retracement zone. This is a low-risk entry given the confluence of previous support and corrective wave completion.
Targets: Book partial profits around 850-852. If momentum sustains, trail stop-loss to 845 and aim for 900-912 as the extended target.
Stop Loss: Place a stop-loss below 814 to manage risk. A failure here could invalidate the setup, resulting in further downside risk.
Risk-Reward Ratio: Buying around 830 with a target of 850 (initial) and 900 (extended) offers a risk-reward ratio of approximately 1:3, making it a favorable trade setup.
Key Educational Note:
Green trendlines denote bullish movement, while red illustrates potential bearish risks. The yellow trends indicate a sideways range, highlighting consolidation zones.
Disclaimer: This is not financial advice. Always consult with a SEBI-registered advisor before trading. Like and share if you find this analysis helpful!
SBIN Long for Swing PositionOverview: SBIN has been in a downtrend on the 4-hour timeframe but recently bounced from the key support level of 775. The price faced strong resistance at 795, which was a critical level for any upward movement. However, SBIN has now broken through this resistance with solid bullish momentum and has reached 805. This former resistance level is likely to act as a new support if the price comes back for a retest.
Trade Plan: Keep a close watch on the 795 support level, especially on a lower timeframe like the 15-minute chart. If the price shows bullish signs around this level, consider buying a small position and holding it for a potential swing trade. The target for this trade would be 900 or higher. On the other hand, if the price fails to hold the 795 support and breaks below, the next area to watch would be 774. If bullish signals appear at 774, it could be a good opportunity to add to the position for another swing trade. However, if the price continues to decline and doesn't hold this level either, it may be wise to wait and look for a better entry at 726 or exit with a stoploss below 775.
Conclusion: If the swing high of 805 is broken, open a long position with the trading plan mentioned above. I'll keep you updated on further price action as it develops.
Please let me know which stock do you want me to do analysis on. Write down any doubts or thoughts in the comment section and please hit the boost to show support and follow for more update.
SBIN Long Trade setup in 15m TF using RisologicalSBIN Long Trade setup in 15m TF using Risological
SBIN profit target 1 done!
The dotted line on the Risological swing trader acts as the trailing stop of the trade.
The trade looks good and should reach the Target 4 within a few days, unless there is a bad reversal.
So, keep a close watch on the trailing stop and trade safely.
SBIN--Head & Shoulders pattern??This stock is bullish in action.
A strong fall is noticed from the header section 795 levels
and we have a left shoulder at 780 levels.
price after clearing the liquidity below neckline price will take u turn until the right shoulder which is strong. So keep an eye on this stock for short once reaches to the right shoulder area.
we have a demand zones lies at 650-640 areas.
wait for the price to form a right shoulder, to confirmation and breaks the neckline for more confirmation and retest for more confluence to enter short side up to the demand zones.
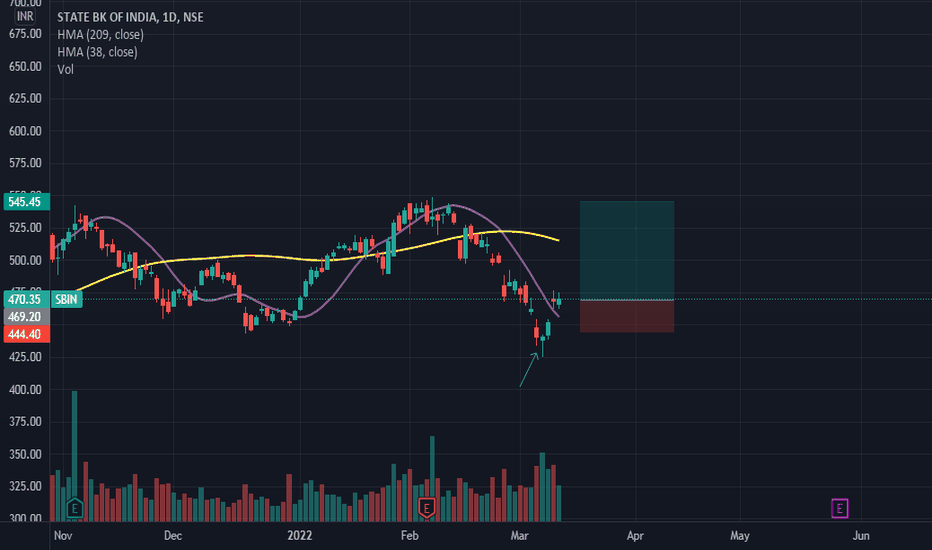
BUY SBIN AROUND 440 TGT 495/535/580/640 SL BELOW 380 AVG @ 425Currently it is trading below 100 DMA and it is supposed to make a minor pull back before taking support around 200 DMA and will resume its further uptrend. As budget session is also approaching and the previous quarterly results were also stable and is supposed to perform better in the current quarter. Any breakout above the price action line will make it to go for above mentioned target with given SL.
SBI - Elliott Wave CountSBI - Elliott Wave Count
SBI - the market breaks the recent tl support and can go around 615 range and then we can expect the reversal up to 670 range.
Please note that this information is solely for educational purposes, and it is essential to exercise caution when trading
NSE:SBIN NSE:SBIN1! BSE:SBIN
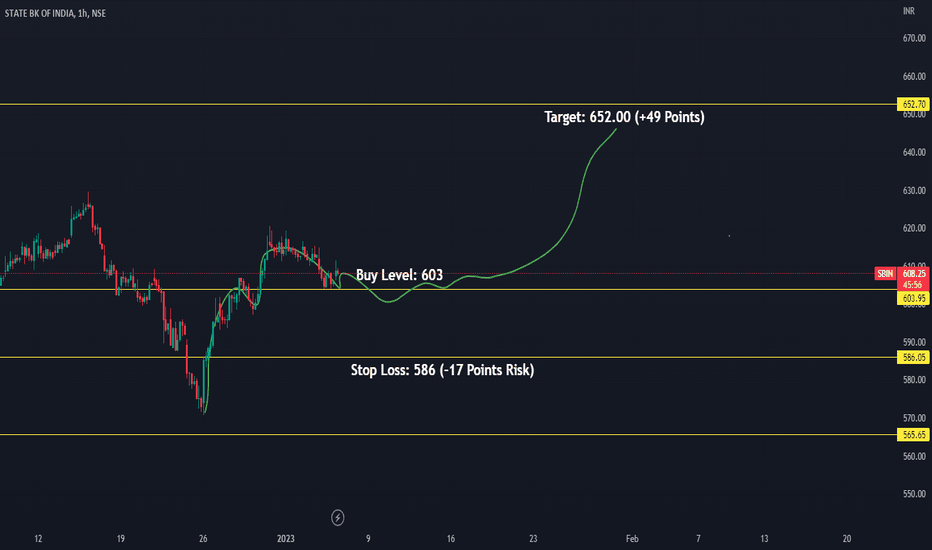
SBIN Conditional Buy levels 28.03.2023This is conditional buy view on NSE:SBIN . If 45min candle closed above 515, we can make a entry with stop loss of 507. My expected upside target will be 528.00. It would be positional trade for 1-2 days.
Note: This is my personal analysis, only to learn stock market behavior. Thanks.
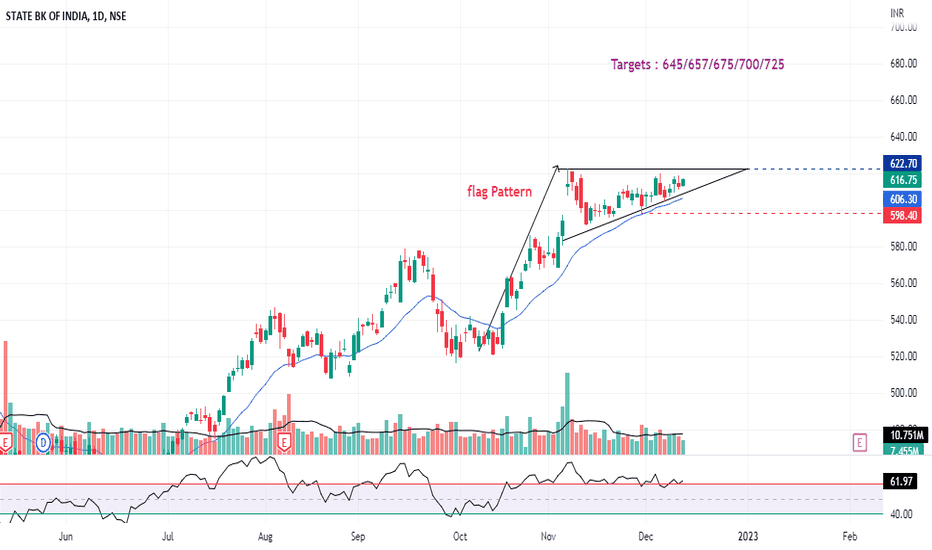
SBIN : Breakout Candidate (Flag Pattern)#SBIN : King of PSU Banks in a kind of Flag structure, Breakout Candidate Soon.
Good Strength in all 3 Time Frame (D/W/M)
Banking Sector will Grow as long as Indian Economy grows.
Take 10% & keep Trailling.
Happy Trading !!!
Keep Sharing, Loving & following to Learn more.
SBI Levels & Strategy for next few daysDear traders, I have identified chart levels based on my analysis, major support & resistance levels. Please note that I am not a SEBI registered member. Information shared by me here for educational purpose only. Please don’t trust me or anyone for trading/investment purpose as it may lead to financial losses. Focus on learning, how to fish, trust on your own trading skills and please do consult your financial advisor before trading.
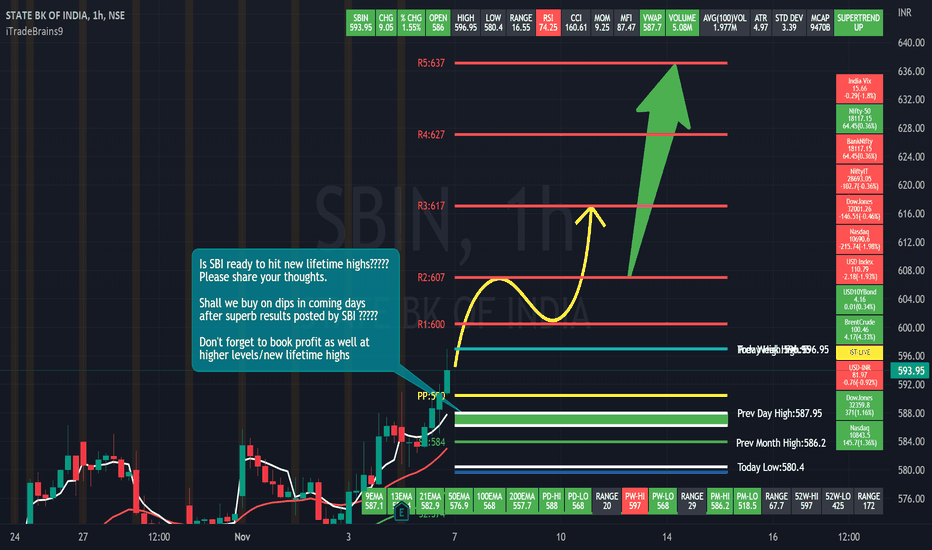
SBI has posted excellent results and clearly beat the market expectations. I am feeling quite happy for long term investors who are consistently getting rewarded. SBI is trend is positive & momentum on buying side is strong. Buy on dips strategy is working well in SBI, however traders must be careful near new lifetime highs and work level by level with strict stoploss and maximize the profit using trailing stop loss.
Shall we wait & look for buy on dips opportunity in SBI in coming days?????
Yes, I think so.
Shall we book profits near major resistance levels/near new lifetime high?????
Yes, I think so.
Shall we short SBI near new lifetime high?????
We should avoid to short.
Is correction in coming days due to imported weakness in Indian market/RBI rate hike to curb inflation, likely to be buying opportunity for traders & long term investors????
Yes, I think so.
Please share your thoughts as well. Good luck to traders & investors for profitable trading in SBI.
SBIN DAILY TIMEFRAMESNIPER STRATEGY
This magical strategy works like a clock on almost any charts
Although I have to say it can’t predict pullbacks, so I do not suggest this strategy for leverage trading.
It will not give you the whole wave like any other strategy out there but it will give you huge part of the wave.
The best timeframe for this strategy is Daily, Weekly and Monthly however it can work any timeframe above three minutes.
Start believing in this strategy because it will reward believers with huge profit.
There is a lot more about this strategy.
It can predict and also it can give you almost exact buy or sell time on the spot.
I am developing it even more so stay tuned and start to follow me for more signals and forecasts.


