SBUX

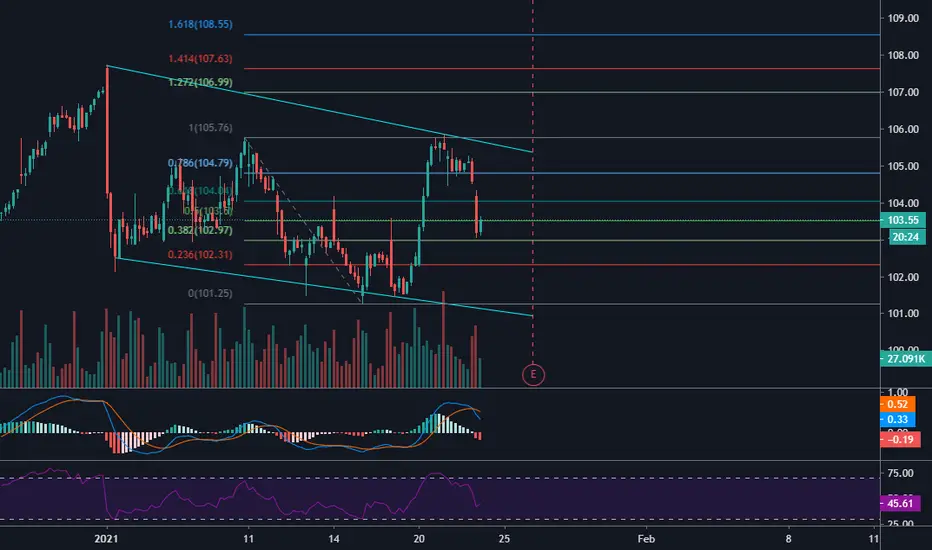
Flag Pattern on SBUX Let's wait for the breakout Today, we will share a clear trading situation we are observing on SBUX.
Main items to pay attention to:
a) Ascending channel: key structure of the bullish movement
b) Support Resistance Area: The price is above this level showing strength on the bullish view
c) Flag Pattern: Continuation structure supported on the Ascending trendline + Support zone
How to execute a setup?
We will open positions above "B," and we will aim for a final target on the 2nd fibo extension. We will protect our setup on the first fibo extension. Stop below "C". We expect a 30 days resolution if the price executes our order. Cancel if the price goes below the stop level.
Thanks for reading!

SBUX headed for 104-106 this week :) simple and sweet, Starbucks is ready to run. Looking like it is going to hit 104-106 this week before culling some profits. Trade well and hope you hold some.

Weekly Outlook! 2/1 - 2/5 Here i go over last weeks video as well as some stocks i'm looking at in the coming week!
NASDAQ:SBUX
NYSE:MCD
NYSE:WMT

$SBUX Hourly, stuck in range. ER catalystNASDAQ:SBUX currently stuck in range, consolidating a bullish flag and waiting for earnings to decide which way it wantst to go.

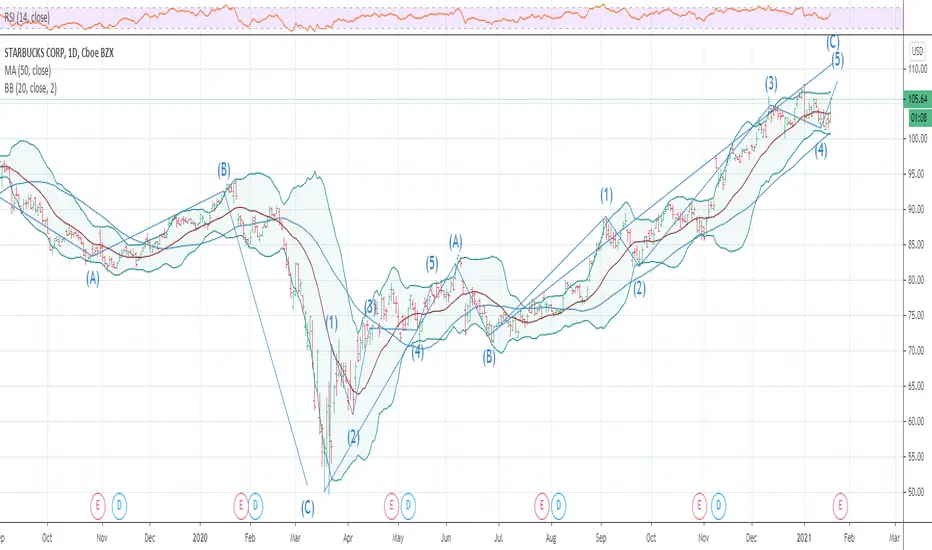
SBUX UPDATE ALT WAVE STRUCTURE WARNING I am posting the major alt wave structure .REASON is the put call model and cycles point to a major panic into mid feb to mid march
SBUX ER run up! New ATH coming?Peppermint mochas out of season? oh well Starbucks released 5 new drinks to start off 2021! Now with earnings coming up we could see a nice rally. Sitting at the bottom of my channel here, could see a nice bounce near 101 and break of the recent downtrend line to retest ath, break over 107 I can see 110. Trading plan annotated in the chart!

SBUX WAVE 4 MINOR ENDING NOW TARGET 110 I AM BOING LONG A 33% NET LONG ONLY IN SBUX BEST TRADES GREAT AND SAFE WEEKEND WAVETIMER

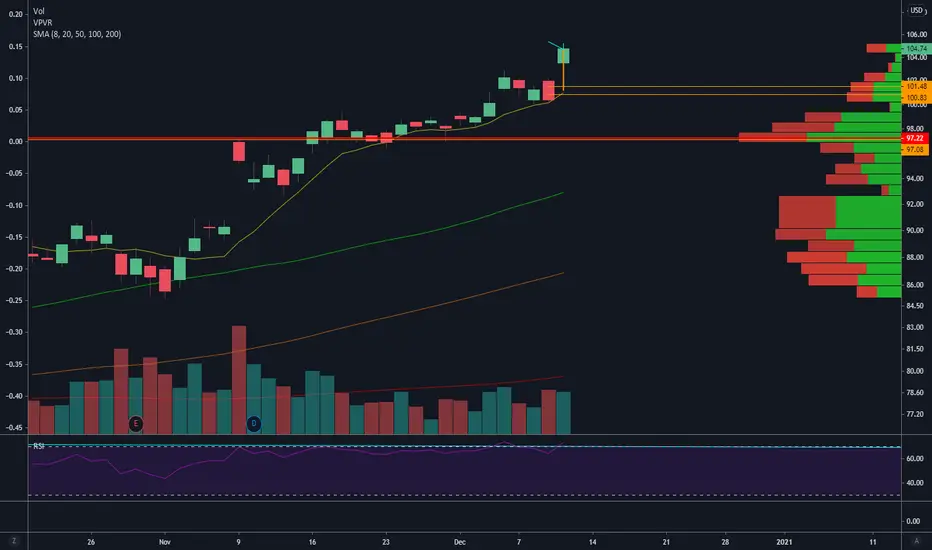
Starbux, everyone's favorite bean juice/drugJust broke out of weekly resistance. Last time this happened, it went 4x (where we are rn). If no lose high 80's prob gonna keep going.
Green areas are targets. Timing? I have no idea but unless people stop drinking coffee, im pretty sure your grandkids gonna be glad you bought.


SBUX to 110under 100 would invalidate this idea looking for a break above 103 and hold above that for an entry.
Safe play: 105C for 1/15 has the best liquidity for otm contracts nothing for 1/8 is appealing to me
Lotto/ day trade: 12/31 105C .13 (highest oi contract for otm weeklies) all weeklies for this have low volume


SBUX Looks like a near-term top here back down to $100Not advice, just my opinion. Back down to $100 to the 8day MA. SBUX
NASDAQ:SBUX

SBUX 9/29 Candle Stick Prediction Here is my daily candle stick prediction for SBUX. I will continue this segment as long as I am following SBUX and actively trading.
This is a prediction and not a guarantee. Please check out my SBUX to $88 before earnings technical analysis. A fundamental analysis is in the works! If you are watching Starbucks then follow this account as I will be actively updating my technical analysis and fundamental analysis. Stay tuned!


Starbucks pull back before completing trend channel?Starbucks could be heading to the top of the channel but the speed/momentum at which it is doing so looks like due for a correction. Currently the price point looks to be at 1.618 of wave 1 which is an ideal resistance point for some correction. But, if it were to continue its momentum which is likely then the purple box is the next target point which is both a fib resistance and 2.0 fib extension. I think that SBUX will continue up to the purple box before any correction.
RSI: is overbought on the higher daily & 4hr time frames
EMA's: SBUX has gone pure vertical leaving all EMA's in the dust as well as bollinger-bands. These combined with the RSI lead me to believe there is a correction in store before the next run up.
News: There is no substantial news that I could find that would explain the crazy momentum.
Follow the $: overall the options trading volume is substantially in the bullish direction. looking at the charts this makes sense.the september 18th call expirations look to have almost 7x more capital in them than the puts.
Plays: I would look into $85 or $87 puts if the underlying continues with this momentum to purple box to play the correction. overall I am bullish on starbucks and will be following charts for long term bullish moves. Thanks!

☕ SBUX (8/31) - (9/11) ☕ Options☕ SBUX ☕
SBUX had a nice bull run last week topping out around @85.30
Holding above @83.50 and SBUX will have a high chance to break last's week's high. Above @85.65 and we'll find @87-88
On the downside, failing to break @85.30 and we'll most likely pullback to @82.50's, @79.50's, then rock solid support @77.15


Starbucks (SBUX) - Hangs Around 21 EMAAs you all know, I regularly post pullback trade ideas as stocks pullback to their 21 day EMA. Today, I am looking at Starbucks NASDAQ:SBUX . What's different about this pullback is that Starbucks usually doesnt hang out at the 21 for more than a day or two. However, its been 4 days... so I wonder if the powers that be are on to us! ... just kidding. But in all seriousness, I like this chart. I think that it really shows that support at the 21 EMA is being tested hard and should SBUX close the day out above the 21 EMA or even the 8 EMA on the daily chart (putting it in the Green), then I think next week we could see SBUX go even higher.
