BTCUSD : Short levelHere is a great entry point for those who scalp this instrument or pips. The level is marked with a red arrow. It will be active until I report. It may become inactive over time.
Watch out for trading on the news.
Scalping

ETH SCALP SHORT RR 3:1 Ethereum just hit weekly level with two 15min lower high and lower low. Rules are telling us to not short against trend, but there can be hedge for long positions.
I don't ask to trade more then 0.5 % capital per trade.

Major Move Ahead for ADA – Breakout or Breakdown?
🔍 ADA/USDT Analysis – Dual Scenario Setup (BUY & SELL)
Currently, ADA is ranging between major supply and demand zones. Two clear scenarios are in play depending on how price reacts to key levels:
📈 Bullish Scenario (Long):
Entry: On breakout and confirmation above $0.6027
Target: $0.869 (major resistance zone)
Stop Loss: Below $0.523
Trigger: Break of descending trendline and solid structure above $0.6027
📉 Bearish Scenario (Short):
Entry: Around $0.5120 (rejection from supply zone)
Target: $0.315 (strong demand zone)
Stop Loss: Above $0.6027
Trigger: Failed breakout and rejection from $0.5120 level, with confirmation below it
📌 Based on the descending channel structure, this might have been the final leg of the downtrend, and a reversal to the upside could be underway. However, for confirmation, we prefer to wait for stronger price action signals before fully committing.
🛑 Always use risk management. Market remains bearish until proven otherwise.

Us30 Long Day Trade New York OpenIm looking for a long on the Us30 for a 1:3 min , im trade a long after a the retest due to the the trend has been bullish

Exact Entry Levels & Profit Potential (July 3, 2025)🎯 Market Structure Breakdown – Exact Entry Levels & Profit Potential (July 3, 2025)
📊 In today’s session, I revisit the market for the second time – and you’ll see why I’m ruling out some setups altogether. There’s value in looking twice. What did I miss earlier? It's all in the structure.
I break down price action step by step, highlight precise entry zones, and show where the real potential for movement lies. Clean levels, no guessing.
⚠️ Note: I don’t trade the first 10 seconds – all orders are placed after 9:30:10 and I'm looking for entries only until 11:30:00.
👉 Check out the full breakdown and stay ahead of the game.
NASDAQ:AMZN
NYSE:ANET
NASDAQ:AVGO
NYSE:BA
NASDAQ:COIN
NASDAQ:CZR
NYSE:DELL
NASDAQ:GOOG
NASDAQ:MSFT
NASDAQ:AMD
NASDAQ:RKLB
NASDAQ:SBUX
NASDAQ:SMCI
NYSE:VRT
NASDAQ:NVDA

USDCAD - Scalping in the deepHello dear scalpers, this is our next little scalping setup...
With a ratio of 1.14 ^^
I think this will be a nice position in this downtrend situation.

GBPUSD ScalpAs we see, here we have strong and beautiful resistance level.
The price will go down and test previous levels. TP: 1.35659 (30-33pips).

PYPL: Strong Resistance Zone in Play – Watch 73.34 for EntryNASDAQ:PYPL is showing a potential triple top formation near the 73 level. If price breaks above the 73.34 resistance , there's room to move toward 74.15 – a medium-term swing high.
💡 Trade idea: Enter 1 tick above 73.34, set your target and SL based on the 5-minute chart.

BTC Scalping / Intraday Signal – Entry, Stop & Target Ready!🕒 Timeframe: 15min / 5min
⚠️ Note: Manage your risk — intraday volatility is high.
This is a short-term opportunity, not a long hold.
Disclaimer: This is our personal analysis and not financial advice. Always do your own research before making any investment decisions.
💬 What’s your take on this? Drop your thoughts in the comments and feel free to share this with your friends! ❤️

ETH Scalping Signal – Entry, Stop & Target Ready!🕒 Timeframe: 15min / 5min
⚠️ Note: Manage your risk — intraday volatility is high.
This is a short-term opportunity, not a long hold.
Disclaimer: This is our personal analysis and not financial advice. Always do your own research before making any investment decisions.
💬 What’s your take on this? Drop your thoughts in the comments and feel free to share this with your friends! ❤️

BTC Short analysis + GRID Bot Scalper Strategy for BTC FuturesHELLO DEAR TRADERS,
If you're reading this right now, consider yourself one of the lucky few. You're gaining access to insights that, until now, have remained exclusive — reserved for a very small circle of insiders and influencers.
For a long time, we've hesitated to step into the spotlight and reveal the deeper truth behind the movements of financial markets. But everything comes in due time… and that time is getting closer.
Have you ever wondered how figures like Trump or Elon Musk always seem to bet on the right horse?
Many believe they're the ones moving the markets — but that’s far from the truth.
The real secret?
Their teams have access to advanced tools and knowledge — the right kind of science — to analyze the markets in ways most people can’t even imagine.
We won't go into too much detail here — some information is too powerful (and risky) to be shared publicly. But remember this:
"Trading is a game. And if you know the rules, you always play to win."
Starting today, we’ll be introducing a completely new vision of how to trade the financial markets — or any asset whose price is reflected on a chart.
Get ready to see the markets like never before. 🔥
Scalping Made Simple: The Power of GRID Bots
If you're serious about scalping the markets, one of the most effective tools at your disposal is the GRID trading bot. When properly configured, it can deliver consistent, automated profits by executing micro-trades around the clock.
Let’s be real:
Sitting in front of charts all day, hunting for the perfect sniper entry, is not just exhausting — it’s inefficient.
Why not let automation do the heavy lifting while you focus on strategy?
________________________________________
⚙️ AUTO SCALPER MODE: ON (SHORT TERM BOT
Here are the optimal parameters to configure your GRID BOT on Binance for effective scalping:
🔧 Recommended Settings:
o Trading Pair: BTC/USDTP (futures GRID)
o Mode: Grid Trading (long)
o Price Range: 105000 – 112000 USDT
o Current leverage : x18
o Number of Grids: 22-25 levels
o Order Size: Depends on your capital)
o Profit Mode: Arithmetic
o Margin mode : isolated
o Trailing up : Disabled
o Take-Profit: 112000
o Stop-Loss: 104000
o Open a position on creation : Disabled
o Close all position on stop: Enabled
o Close all positions on TP/SL stops: Enabled
📌 Notes :
⚠️The settings listed aboce have been meticulously calculated using precise algorithmic models. Every parameter serves a purpose — and even the slightest deviation can significantly impact performance, potentially leading to capital loss.
⚠️Do not judge the bot’s performance based on its real-time PNL. The true profit is only realized once the bot reaches its target and closes all active orders.
⚠️These bots are designed with high-level precision, offering a powerful edge when configured and used correctly.
✋ Manual Entries (For Experienced Traders)
If you're a more advanced trader, you can combine the GRID bot with manual entries based on:
o Buy orders listed on the chart
o You can enter a buy position at any price within the defined range on the chart — as long as the price does not break above the upper boundary of that range
o Using leverage is possible, but only under one condition:
-Your stop-loss and liquidation price must always remain below the highest protected low or in the SL area
o Your stop loss should always be bellow the highest protected Low
🔍 Disclaimer: This is our personal analysis and not financial advice. Always do your own research before making any investment decisions.
💬 What’s your take on this? Drop your thoughts in the comments and feel free to share this with your friends! ❤️

CHFJPY - Scalping is Back! Let's see...Hi guys. I will just be scalp here.
Entry price: 173.884 TP: 173.332 SL: 174.438 Win/Loss Ratio 1:1!
Let's do some good scalp! ^^

Short-Term BTC Scalping Opportunity⚡Say less
💥Setup and forget
💥the position is off if price hits 111,959 first.
💥leverage maybe used according to your risk management

Grass short (scalp)Grass short retesting golden zone of fib 0.5 / 0.618
If we have a rejection in that zone then it can be a new support en we can look for an entry for long position.

TAO/USDT – Long Setup ActivatedA potential bottom might be in place here.
🔍 Key confluences:
– Strong CVD rebound (spot + futures)
– Funding rate turning positive
– Top traders ratio shifting bullish (smart money buying the dip)
– Open Interest stabilizing after a clean flush
– And above all: my Scalp Cloud Signal just fired a bullish confirmation ✅
🎯 Targeting a short-term move to the 365–373 zone.
SL clearly defined below the local sweep.
💡 Tool used: Scalp Cloud Signal by The Degen Company
— Precision tool for scalping and micro trend shifts.

How To Customize The 1 Minute Scalping IndicatorThis tutorial explains each setting of the 1 Minute Scalping Indicator in detail so you understand exactly how to adjust your settings to get the results you would like from the indicator.
Here is a list of the details we discuss:
How to fix loading errors
Tooltips that explain each setting for your reference
Trade modes and how they are affected by other settings
Average candle size rejection parameters
Higher timeframe candle filters, settings and levels
External indicator trend filtering capabilities and how to set them up correctly
Stoploss and take profit calculations and settings you can adjust
Signal arrow customization options
Candle coloring adjustments
Visual/styling options
Make sure to watch the whole video so you fully understand how each setting affects the indicator for best results.

How To Filter Signals On The 1 Minute Scalping IndicatorThis tutorial shows you how to use external indicators to filter out signals on the 1 Minute Scalping Indicator so that you only get signals that are in the direction of the trend.
Step By Step Process:
1. Pick an external indicator that provides an output value of 1 for bullish, -1 for bearish or 0 for neutral and add it to your chart. We have multiple indicators that can do this, but you can also customize your own indicators to provide this value and use that to filter out signals.
2. Set your desired trend parameters on your external indicator and make sure that indicator is on the same chart as the 1 Minute Scalping Indicator.
3. Go to the indicator settings for the 1 Minute Scalping Indicator and turn on one of the 3 available External Indicator Filters. Then from the dropdown menu, select the external indicator you want to use and make sure to choose the output value that gives the 1, -1 or 0 output for trends. Our indicators will have an output titled "Trend Direction To Send To External Indicators" to make that value easy to find in the dropdown menus.
That's it! Let the 1 Minute Scalping Indicator reload with the external indicator trend values and it will only show buy signals during bullish trends, only show sell signals during bearish trends or no signals during neutral markets. Make sure to back test your setup until you find the best external indicators and settings to use that work best for your trading style and then apply that setup to any chart you would like.
Here is the code you can use to add a trend value to your own custom indicators and send it to the 1 Minute Scalping Indicator:
trendDirection = 0
if close > ema1
trendDirection := 1
else if close < ema1
trendDirection := -1
else
trendDirection := 0
plot(trendDirection, title="Trend Direction To Send To External Indicators", color=#00000000, display=display.data_window)
Change the (close > ema1) and (close < ema1) to use your own variables from within your script.

$2.29 to $11.17 in 45 minutes $UPXI🔥 $2.29 to $11.17 in 45 minutes with Buy Alert sent in trading view chat before $6 with more than enough of time before it went vertical to $12 🚀
While the rest of the world woke up into red, it's great to catch highly predictable trade like this early Monday morning
Been doing it for 20 years, I hope you profited along! You're most welcome 😉
NASDAQ:UPXI

LONG inside a GIANT SHORT...Mostly I believe the Main trend is Bearish and the Main IDEA represents the same...
small bullish movement is happening... (hope to be true...)

NQ! Short Idea (MXMM, Quarterly Theory)Hello, after 2 successful weeks I'm planning to continue this streak. Current WR is 75%.
After taking a quick Short on NQ, I'll be waiting for the NY Session for my next setup. I'm expecting a BSL Sweep at around 9:30 UTC-4, after that I will wait for the Macros 9:50 to enter Short.
Praise be to God
-T-

BTC/USD Long Setup – Bullish Reversal PlayAfter a sharp drop, BTC is testing a key liquidity zone around 78.2k. The market structure suggests a potential bullish reversal, with a fakeout and recovery in sight.
📌 Trade Idea:
Entry: After confirmation of a reclaim and bullish structure break (above ~79.3k)
SL: Below recent low ~77.6k
TP: 82.8k zone
RRR: ~3.2
📅 Timeframe: 30min
📈 Bias: Counter-trend long
🔁 Watch for: Price reaction at current support and market structure shift
🚨 Wait for confirmation – patience is key in volatile conditions!

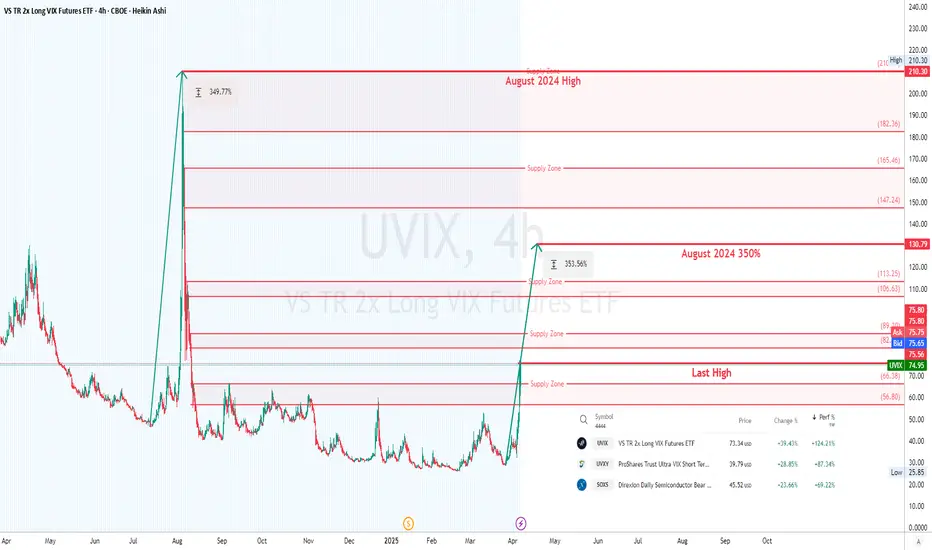
Trading UVIX for Effective Hedge📊 Trade Idea: UVIX Multi-Layered Entry Strategy (Scalping Volatility Spikes)
The current market environment presents a unique opportunity to trade the Volatility Shares 2x Long VIX Futures ETF (UVIX), which has surged nearly 50% on Thursday and 124% over the last week. With ongoing fears surrounding President Trump's reciprocal tariffs, volatility is expected to remain elevated.
🔍 What Is UVIX?
UVIX is a leveraged ETF designed to provide twice (2x) the daily return of the Long VIX Futures Index. Unlike the VIX itself, which measures expected market volatility, UVIX holds futures contracts on the VIX, aiming to profit from both upward spikes in volatility and the structure of the futures market.
Pros of UVIX:
High Return Potential: Can deliver significant gains when market volatility spikes.
Effective Hedge: A powerful tool to offset losses during broad market declines.
Liquidity: Offers easy access to volatility exposure without directly trading VIX futures.
Cons of UVIX:
High Volatility: Amplified moves can result in large gains or substantial losses.
Decay & Compounding Issues: Daily rebalancing and futures roll costs can erode value over time.
Not Suitable for Long-Term Holding: Designed for short-term plays, not buy-and-hold investing.
Here’s my detailed risk-managed trading plan to profit from continued volatility.
🚀 Entry Strategy: Layered Buy Entries with Trailing Stops
🎯 Initial Entry:
Entry Price: 80.00 (Just above the breached Supply Zone 0: 56.80 - 66.38)
Stop Loss: Below the lower trend line from the recent parabolic move (For example, around 70.00).
📈 Position Scaling: Adding to Winning Positions
Use Buy Stop Orders:
As the price breaks above significant supply zones, place Buy Stop Orders to add positions.
Scale in positions at:
Level 1: Above 89.20 (Top of Supply Zone 1)
Level 2: Above 113.25 (Top of Supply Zone 2)
Level 3: Above 147.24 (Bottom of Supply Zone 3)
Level 4: Above 182.36 (Bottom of Supply Zone 4)
Manual Entries:
Alternatively, you can manually add positions on strong breakouts during or outside Regular Trading Hours (RTH) to catch volatility spikes.
!!!Use Limit Orders Outside RTH!!
Place limit orders during off-hours to capture sharp volatility moves when liquidity is lower.
Market volatility often increases during pre-market or post-market sessions. Capitalize on these moves with well-placed limit orders.
🛡️ Risk Management: Trailing Stops & Break-Even Protection
Initial Stop Loss:
Set below the lower trend line (e.g., 70.00). This provides a wide margin for market fluctuations while still protecting your position.
Trailing Stop Loss:
As the price progresses upward, move your stop loss to higher levels to secure profits.
Use a dynamic trailing stop that follows major support levels or recent lows.
Break-Even :
Once UVIX has moved 10-20% above your entry point (80.00), move your stop loss to break even (80.00) for a risk free trade.
📌 Profit Targets
Target 1: 130.79 (Historical 350% level from July 2024 move)
Target 2: 165.46 (Top of Supply Zone 3)
Target 3: 210.30 (August 2024 High)
Adding positions as the price moves in your favor allows for maximum profit potential while limiting risk on initial entries.
Moving the stop loss to break-even creates a risk-free trade, allowing you to ride the momentum without worry.
Continually adjusting stops protects profits as they accumulate, ensuring that gains are secured even if the market turns sharply.
📣 Final Thoughts
The Volatility Shares 2x Long VIX Futures ETF (UVIX) is a powerful instrument for profiting from short-term volatility spikes. Given the current geopolitical and economic uncertainty, this setup offers a strong risk-reward opportunity.
💡Advice: Avoid Greed & Gambling in Volatility Trading
Trading the Volatility Shares 2x Long VIX Futures ETF (UVIX) offers tremendous profit potential during periods of heightened market volatility. However, the same leverage that can generate huge gains can just as easily cause significant losses. Avoiding greed and gambling behavior is crucial for your long-term success.
RSI 101: Scalping Strategy with RSI DivergenceFX:XAUUSD
I'm an intraday trader, so I use the H1 timeframe to identify the main trend and the M5 timeframe for entry confirmation.
How to Determine the Trend
To determine the trend on a specific timeframe, I rely on one or more of the following factors:
1. Market Structure
We can determine the trend by analyzing price structure:
Uptrend: Identified when the market consistently forms higher highs and higher lows. This means price reaches new highs in successive cycles.
Downtrend: Identified when the market consistently forms lower highs and lower lows. Price gradually declines over time.
2. Moving Average
I typically use the EMA200 as the moving average to determine the trend. If price stays above the EMA200 and the EMA200 is sloping upwards, it's considered an uptrend. Conversely, if price is below the EMA200 and it’s sloping downwards, it signals a downtrend.
3. RSI
I'm almost use RSI in my trading system. RSI can also indicate the phase of the market:
If RSI in the 40–80 range, it's considered an uptrend.
If RSI in 20 -60 range, it's considered a downtrend.
In addition, the WMA45 of the RSI gives us additional trend confirmation:
Uptrend: WMA45 slopes upward or remains above the 50 level.
Downtrend: WMA45 slopes downward or stays below the 50 level.
Trading Strategy
With this RSI divergence trading strategy, we first identify the trend on the H1 timeframe:
Here, we can see that the H1 timeframe shows clear signs of a new uptrend:
Price is above the EMA200.
RSI is above 50.
WMA45 of RSI is sloping upward.
To confirm entries, move to the M5 timeframe and look for bullish RSI divergence, which aligns with the higher timeframe (H1) trend.
RSI Divergence, in case you're unfamiliar, happens when:
Price forms a higher high while RSI forms a lower high, or
Price forms a lower low while RSI forms a higher low.
RSI divergence is more reliable when the higher timeframe trend remains intact (as per the methods above), indicating that it’s only a pullback in the bigger trend, and we’re expecting the smaller timeframe to reverse back in line with the main trend.
Stop-loss:
Set your stop-loss 20–30 pips beyond the M5 swing high/low.
Or if H1 ends its uptrend and reverses.
Take-profit:
At a minimum 1R (risk:reward).
Or when M5 ends its trend.
You can take partial profits to optimize your gains:
Take partial profit at 1R.
Another part when M5 ends its trend.
The final part when H1 ends its trend.
My trading system is entirely based on RSI, feel free to follow me for technical analysis and discussions using RSI.
