US500 Need to break current 5500 rangeUS500 is currently ranging between 5500 & 5485. It need to break current 5500 range to break upside resistance at PDL 5522.70 and next will test PWL 5556.90 which coincide with Tuesday low of 5555.80 before heading upwards.
Scalping

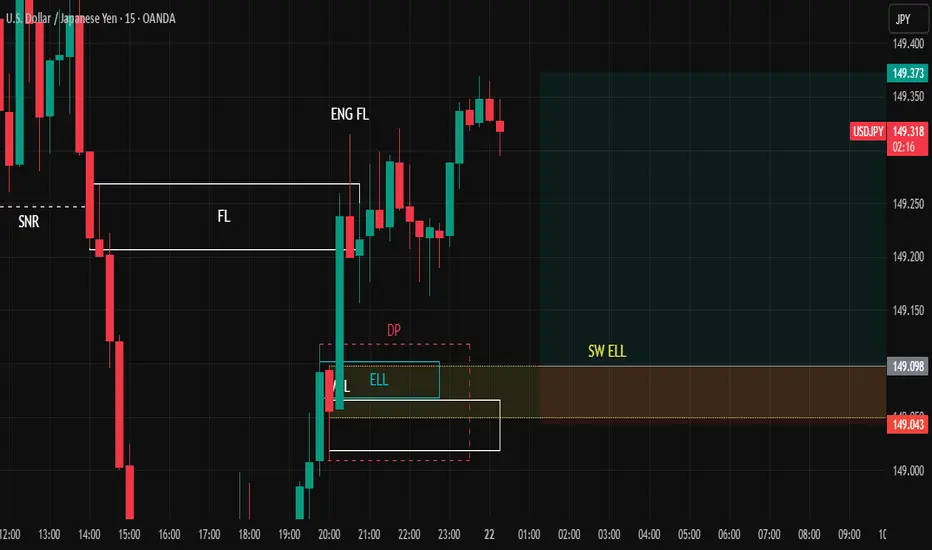
USDJPYAre you ready for scalp?
Buy USDJPY
Entry: 149.098
SL: 149.043
TP: 149.373
The reward is 4 times greater than your risk.
#BTC #BTCUSDT #BITCOIN #LONG #Scalp #Scalping #Eddy#BTC #BTCUSDT #BITCOIN #LONG #Scalp #Scalping #Eddy
BTCUSDT.P Scalping Long Setup
Important areas of the upper time frame for scalping are identified and named.
This setup is based on a combination of different styles, including the volume style with the ict style.
Based on your strategy and style, get the necessary confirmations for this scalping setup to enter the trade.
Don't forget risk and capital management.
The entry point, take profit point, and stop loss point are indicated on the chart along with their amounts.
The responsibility for the transaction is yours and I have no responsibility for not observing your risk and capital management.
Be successful and profitable.

#TON #TONUSDT #TONCOIN #LONG #Scalp #Scalping #Eddy#TON #TONUSDT #TONCOIN #LONG #Scalp #Scalping #Eddy
TONUSDT.P Scaliping Long Setup
Important areas of the upper time frame for scalping are identified and named.
This setup is based on a combination of different styles, including the volume style with the ict style.
Based on your strategy and style, get the necessary confirmations for this scalping setup to enter the trade.
Don't forget risk and capital management.
The entry point, take profit point, and stop loss point are indicated on the chart along with their amounts.
The responsibility for the transaction is yours and I have no responsibility for not observing your risk and capital management.
Be successful and profitable.

Nasdaq Intraday TradeWith the overnight GAP, price jumped above the white Centerline, just to come back in the Asia session.
We see that price broke the white CL and halted afterwards. Do yo see where it halted? Yes, at the Centerline of the yellow Momentum Fork!
And currently it's pushing up through the white CL again...hmmm...
So, we have momentum, clear support at the yellow CL, a potential new push through the white CL and a loooooot of Air...and stop/losses above to be sucked in §8-)
I'm long with a stop below the yellow CL low, and with multiple targets to the upside.
Let's have fun!

The Steps to Identify Key Levels on Chart Scalping Opportunity)**The Steps to Identify Key Levels on Chart:**
1. **Support & Resistance:**
- Identify areas where the price has bounced multiple times.
- Based on your chart, key **support** seems around **2900**, while **resistance** could be near **2925-2930**.
2. **Trendlines:**
- Check if highs/lows are forming a triangle pattern.
- If lower highs and higher lows appear, it could be a **symmetrical triangle** (potential breakout).
3. **Moving Averages & Volume:**
- The **moving averages (EMA)** are close together, suggesting consolidation.
- Look for a volume spike near breakout points (above 2925 or below 2900).
### **Possible Chart Pattern Scenarios:**
- If price **breaks above 2925-2930 with volume**, it could be a **bullish breakout**.
- If price **drops below 2900**, it may confirm a **bearish breakdown** (continuation down).
- If price keeps bouncing between 2900-2925, it's likely **range-bound** (scalping opportunity).

Gold sell off to $2,883Small scalping opportunity on Gold. Sell towards $2,883 - $2,878 before buying again. Overall trend remains bullish.

ORDI update for previous idea - local short scalpORDI had a nice drop since the upper golden pocket, as mentioned in the previous TA. Price also had a good local drop since the last post, but bears are just about to begin.
Locally I am also bearish and want to see continuation.
The previous high confirmed trapped longs but buyers stepped in at the range POC. Now the price is in the same zone of the previous high with the trapped longs. The previous high had lower OBV than the beginning of the range. The current high is even having lower OBV than the previous high. Imo this is just a retest / upthrust to trap more longs into the distribution setup.
Another interesting fact is that the range had the LVN (low volume node) at the top of the range above the range POC, which is a sign of weakness. That never changed but at the end of the range ones longs started to build above the range VAH (value are high). Then the LVN could have been found at the bottom of the range, below the POC. This was the first early sign for me for trapped longs even before the trapped longs of the previous high got confirmed by breaking back into the range (failed auction).
We still want to see much lower.

Bitcoin/USDT 1-Hour Outlook: Consolidation Near 200 EMA at 86k.As traders awaiting for breakout
1. **Trend & EMA (200):**
- The **200-period EMA** (Exponential Moving Average) is plotted, acting as dynamic support/resistance.
- Price hovering near the EMA suggests a potential inflection point. A sustained break above could signal bullish momentum, while a drop below may indicate bearish pressure.
2. **Key Levels:**
- **Immediate Resistance:** 86,000 USDT (current price level).
- **Support Levels:** 84,000 → 82,000 → 80,000 USDT.
- A close below 84,000 could trigger further downside toward 82k or 80k. Conversely, holding above 86k might target new highs.
4. **Actionable Insights:**
- **Bullish Scenario:** Hold long positions if price sustains above 86k, targeting 88k–90k.
- **Bearish Scenario:** A break below 84k could signal short opportunities toward 82k.
- Use tight stop-losses (e.g., below 84k for longs) due to the tight consolidation range.

XAUUSD📌Gold price holds the previous rebound from weekly lows early Wednesday.
📌Fresh haven demand on tariff uncertainty and US economic woes underpin Gold price.
📌Gold buyers stay hopeful amid bullish daily RSI, while the 21-day SMA at $2,883 holds.
🔥Buy Gold
$2905 -> $2903
SL $2900
TP 1->$2908 >2->$2912 >3->$2920
🔥Buy Gold
$2889 -> $2887
SL $2882
TP 1->$2895 >2->$2903 >3->$2910
🔥Sell Gold
$2946 -> $2948
SL $2953
TP 1->$2940 >2->$2930 >3->$2920

Gold (XAUUSD) 30Min – Short-Term Scalping SetupBearish Divergence & Resistance Rejection
Price is reaching the strong resistance zone (2936 - 2940), near the ATH (2942.710).
RSI shows bearish divergence, signaling potential weakness in momentum.
A rejection from this resistance zone could trigger a short-term pullback.
Possible Short Entry : Upon confirmation of rejection (e.g., bearish engulfing, wick rejections).
Short-Term Targets (TPs):
First TP: 2,928.762
Second TP: 2,921.587
Potential Next Moves:
Short-Term Correction – A rejection from 2936 - 2940 could lead to a brief pullback toward support levels (2928 - 2921).
Bullish Continuation – If price holds at support, we could see a new impulsive move toward the ATH (2942.710) and beyond.
📉 Scalping Play: Short from resistance with TPs at 2928 & 2921.
📈 Long Opportunity: If resistance breaks, look for confirmation of bullish continuation.

Sharing a strategyFor my scalping or Intraday trade, I created this pine script combining various indicator (namely the famous Alphatrend by @KivancOzbilgic, Previous Day Close and 52WeeksHigh/Low) into one indicator.
If price goes above the PDC and Alphatrend is a buy then I will make quick long trade. If price goes below the PDC and Alphatrend is a sell then I will make quick short trade. I added a percentage based on PDC to give me where I need to put my stoploss. Not really important as I always have proper risk reward ratio but it comes handy most of the time.

Why you should choose your trading period carefullyFirst, let's look at the four most important trading sessions. The Forex and stock market is divided into different trading sessions, which are based on the opening hours of the main financial centers:
Session Opening Hours (UTC) Major Markets:
-> Sydney session 22:00 – 07:00 Australia, New Zealand
-> Tokyo session 00:00 – 09:00 Japan, China, Singapore
-> London session 08:00 – 17:00 UK, Europe
-> New York session 1:00 p.m. – 10:00 p.m. USA, Canada
Note: Times vary slightly depending on summer or winter time.
Why are trading sessions important?
-> Volatility & Liquidity
Depending on the session, there are different market movements.
High liquidity → tight spreads and better order execution.
Low liquidity → greater slippage and wider spreads.
-> Active currencies & markets
During the Tokyo session, JPY and AUD pairs are particularly active.
During the London session, EUR and GBP pairs are the most volatile.
During the New York session, USD pairs and stock markets moved the most.
Opportunities & risks during overlapping times:
The overlaps between sessions are the most volatile times because several major markets are active at the same time.
1. London-New York Overlap (13:00 – 17:00 UTC)
→ Highest volatility
Why?
The world's two largest financial centers operate at the same time.
Opportunities:
Big price moves → good for breakout traders and scalping.
High liquidity → tight spreads, fast order execution.
Risks:
Extreme volatility → rapid price changes can trigger stop losses.
News (e.g. US jobs data) can cause sudden movements.
Practical example:
A trader is watching EUR/USD and sees strong resistance at 1.1000.
US inflation data will be released at 13:30 UTC.
If the data is better than expected → USD strengthens, EUR/USD falls.
If the data is worse → USD weakens, EUR/USD rises.
Within a few minutes the price can fluctuate by 50-100 pips.
→ Strategy: News traders rely on quick movements, while conservative traders extend stop losses or pause during this time.
2. Tokyo-London Overlap (08:00 – 09:00 UTC)
→ Medium volatility
Why?
London opens while Tokyo is still active.
Opportunities:
JPY pairs (e.g. GBP/JPY) are moving strongly.
Breakouts through the European opening.
Risks:
Sudden changes in direction as European traders often have a different market opinion than Asian ones.
Practical example:
A scalper is trading GBP/JPY in a narrow range of 185.00 – 185.20 during the Tokyo session.
At 08:00 UTC London opens with GBP/JPY breaking above 185.50.
Within 30 minutes the price rises to 186.00 as European traders buy GBP.
If you recognize the breakout early, you can quickly take 50-100 pips.
→ Strategy: Scalpers rely on quick entries and take profits before volatility subsides.
3. Sydney-Tokyo Overlap (00:00 – 07:00 UTC)
→ Low volatility
Why?
Mainly the Asian market is active.
Opportunities:
Less volatility → good for range trading.
Cheaper spreads for AUD and NZD pairs.
Risks:
Little liquidity → Slippage may occur.
Strong moves are rare, except for major news from Japan or Australia.
Practical example:
A swing trader notes that AUD/USD has been fluctuating between 0.6500 and 0.6550 for days.
During the Sydney-Tokyo session the price mostly stays in this range.
The trader places a sell limit order at 0.6550 and a buy limit order at 0.6500.
Since there is little volatility, it can be profitable with multiple small trades.
→ Strategy: Range trading is ideal because no major breakouts are expected.
Conclusion:
Each trading session has its own characteristics, opportunities and risks.
The crossovers are the most volatile times - good for day traders, but risky for inexperienced traders. Anyone who understands the market mechanisms can take targeted action at the right time. The strategies mentioned above are simply derivations from the advantages and disadvantages of the respective sessions. Of course, a well-founded strategy concept requires much more.

1000BONKUSDT: Ready for a Breakout?
🔥 **1000BONKUSDT.P** has been consolidating under resistance for a long time, accumulating liquidity. The price has tested **0.017630 USDT** multiple times, and whales are clearly building positions. The question is: will we see a breakout, or will there be another dip before the pump?
---
🔑 **Key Levels:**
**Support:**
**0.017630 USDT** — Major demand zone. A breakdown below this level could trigger further declines.
**0.016800 USDT** — Last defense for bulls to maintain the uptrend.
**Resistance:**
**0.018481 USDT** — Initial liquidity zone, where a local rejection may occur.
**0.019000 USDT** — Key level that, if broken, opens the way to 0.020 USDT.
**0.024379 USDT** — Ultimate target where large players might start taking profits.
---
🚀 **Trading Strategy:**
**Entry Points:**
- Long upon breakout of **0.018481 USDT**, confirmed by volume increase.
- Alternative entry on a retest of **0.017630 USDT**, provided support volumes increase.
**Stop-Loss:**
- Below **0.016800 USDT** to avoid liquidity grabs before the potential move up.
**Take-Profit Targets:**
**0.019000 USDT** — Partial profit-taking, securing position.
**0.020000 USDT** — Major target if momentum follows through.
**0.024379 USDT** — Ideal scenario if a strong impulse move occurs.
---
📈 **Market Analysis:**
Price has been consolidating near resistance, suggesting an impending breakout.
Large orders in the order book indicate whale activity.
Volume is starting to pick up, signaling a potential phase transition.
---
💡 **Conclusion:**
1000BONKUSDT.P is at a decisive moment. A confirmed breakout above **0.018481 USDT** could lead to a strong bullish move. However, if another fakeout and dump happen, it's time to reassess. What’s your take—ready for the pump? 🚀💬

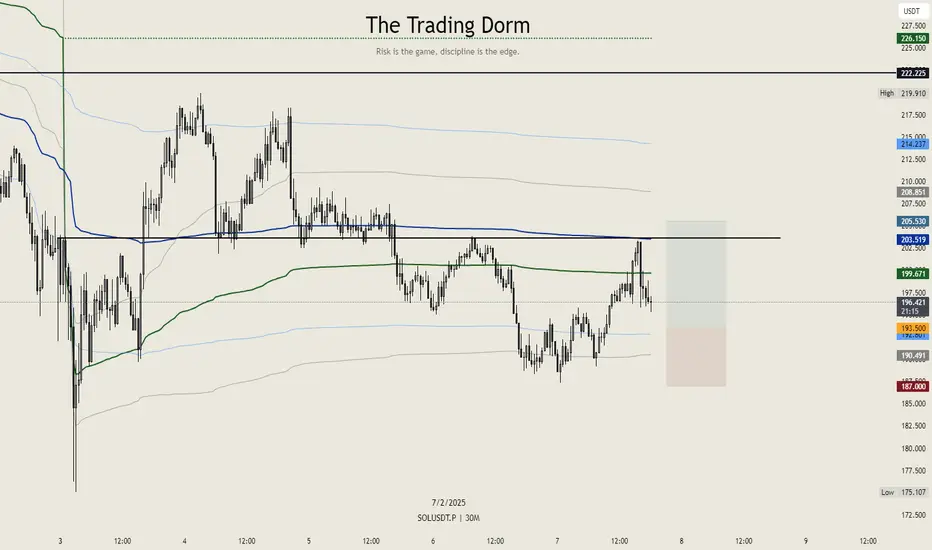
Solana $SOL Setup – Keeping it CleanSolana looks strong, so it’s time for a trade. The entry is placed at $193.50, with a stop-loss at $187 to keep risk in check. The target is set at $205.53, aligning perfectly with the monthly and weekly VWAP VALs.
This setup offers a 1:1.85 risk-to-reward ratio—nothing crazy, just a clean, structured trade. No moonboy fantasy for now, just following the price action and executing accordingly.
TOSHIUSD demand zone (0.00070) waiting for bullish confirmation 🚀 TOSH/USD Analysis: Fresh Demand Zone on M15 – Awaiting Bullish Confirmation
🔍 Why is this setup interesting?
✅ Fresh Demand Zone created on M15 at 0.00070 → Potential strong buy pressure 📊
✅ Trade not confirmed yet → Waiting for a bullish signal h1📈
✅ Confluence with Price Action and Market Structure 💹
📊 Key Levels & Scenarios:
🔵 Demand Zone (daily Support): 0.00070
🟢 Potential Confirmation: Wick rejection + Bullish close
🟢 Target Levels: 🎯 ATH
🛠 Supply & Demand Strategy Applied:
Fresh Demand Zone → Strong bounce potential ✅
Waiting for bullish confirmation (Engulfing candle, wick rejection, high volume) 📉
Optimized Risk/Reward Ratio: 1:3 🎯
🔥 Follow me for more live market analysis

short btcusd for an scalp with 1:2 R/Rdue to leg 1=leg 2 theory you can see that btc is 60% in favor of a short fast scalp in 15m timeframe

XAU/USD 4H Analysis: Bullish Momentum Towards $2,780?📊 XAU/USD 4H Chart Analysis – Bullish Momentum 🚀💰
📌 Key Observations:
🔹 Current Price: $2,754.16 (+0.19%)
🔹 Support Zone: $2,740 - $2,750 (Previous resistance turned support ✅)
🔹 Resistance Zone: $2,780 (Next potential target 🎯)
🔹 200 EMA: $2,687.43 (Price is above = Bullish signal 📈)
🔹 Breakout Confirmation: Price has broken past a key level and might retest before moving higher 🔄📊
📉 Potential Scenarios:
✅ Bullish Case: If price holds above $2,750, we could see a rally towards $2,780+ 🚀
❌ Bearish Case: If price drops below $2,740, we might see a correction back to $2,720 ⚠️
🔥 Conclusion:
Gold is showing strong bullish momentum and may continue its uptrend towards $2,780+ if it sustains above the breakout level! Keep an eye on support at $2,750 for confirmation. 👀💎
Would you like further indicators or a different timeframe analysis? ⏳📊

GBPJPY 30min TF Price action analysisHello Traders, as explained on the chart, this is a prime setup for me with a clean range to the left, 45-50 pip tradable range and a break and close below a key level with bearish volume accumulating. Great R:R opportunity!

Expected Long at EurusdMy chwrt analysis and Trend analysis say that Eurusd again push him upside and test the high level again to change direction from bearish to bullish.
Let us hope it finds his way.
I m bullish into it.

Scalp Like a Pro: 5-Minute Trades for Big Wins in Micro-TradingMorning Trading Fam
I'm sharing how I use just price action and candlesticks for my scalping strategy. We'll look at where to enter and exit trades super fast. Perfect for beginners or to refine your skills. Let's get into it with our TradingView setups. Like, Boost, Follow and Share is much appreciated.
Kris/Mindbloome Exchange
Trade What You See

Short Bitcoin Now! Perfect entry for a short on this BTC trade.
Not financial advice.
This is what I am trading per this bearish trendline pre-Trump week.
You won’t be disappointed

From Novice to Scalping Master: The Art of Reading CandlesticksMastering Scalping Trading Through Candlestick Patterns
In the realm of financial markets, scalping trading has emerged as a popular strategy for many investors seeking to capitalize on short-term price movements. Differing from long-term investment approaches, scalping entails making quick trades based on small price fluctuations, often holding positions for mere minutes or seconds. To succeed in this fast-paced environment, traders must hone their analytical skills and mastery of various tools—among which candlestick patterns are paramount. Understanding these patterns can provide traders with insights into market sentiment and potential price reversals, proving especially beneficial in the context of scalping. This essay delves into the intricate world of candlestick patterns, categorizing them into bearish and bullish formations, and examining some of the most significant patterns that traders should master.
The Foundation of Candlestick Patterns
Candlestick charts, originating from Japanese rice traders in the 18th century, have evolved into a universal tool for market analysis. Each candlestick provides a visual representation of price movement within a specific time frame, encapsulating opening, closing, high, and low prices. By analyzing these candlesticks, traders can infer market sentiment and potentially anticipate future movements. A comprehensive understanding of bullish and bearish candlestick patterns is critical for any trader seeking success in scalping.
Bearish Candlestick Patterns
Bearish candlestick patterns indicate a potential reversal of an upward trend, signaling that prices may decline in the near future. Among the most notable bearish patterns is the Three Black Crows, characterized by three consecutive long-bodied candlesticks, each opening within the previous body and closing lower. This pattern suggests a strong downward momentum and a high likelihood of further declines.
Another prominent pattern is the Bearish Engulfing pattern, wherein a small bullish candle is followed by a larger bearish candle that completely engulfs the previous one. This stark contrast denotes a shift in control from buyers to sellers and serves as a powerful bearish signal. The Three Inside Down pattern, consisting of a bullish candle followed by a smaller bearish candle within it, and concluding with a bearish candle that closes below the first candle’s low, further exemplifies a market reversal.
Bearish Meeting Lines represent another vital bearish pattern, occurring when a bullish candle is followed by a bearish candle that opens above the previous candle’s close but closes at or near a similar price level. This pattern indicates hesitation among buyers and can serve as a cue for sellers to enter the market.
Bullish Candlestick Patterns
Conversely, bullish candlestick patterns suggest potential upward reversals, signifying that prices may rise after a downtrend. The Three White Soldiers pattern consists of three consecutive long-bodied bullish candles, each opening within the previous body and closing higher. This pattern is indicative of strong bullish momentum and may signal a significant upward trend.
The Hammer is a fundamental bullish pattern characterized by a small body and a long lower shadow, occurring after a downtrend. This candlestick shape indicates that buyers have stepped in to support the price, often suggesting the potential for a reversal. Similarly, the Bullish Engulfing pattern features a small bearish candle followed by a larger bullish candle that engulfs it, signaling a shift in control from sellers to buyers.
The Three Inside Up pattern begins with a bearish candle, followed by a smaller bullish candle within, and concludes with a bullish candle closing above the first candle’s high. It can signal the start of an upward trend. Meanwhile, the Bullish Breakaway indicates a transitioning phase where significant bullish momentum begins after consolidation.
Complex Patterns for Intricate Analysis
Beyond the primary patterns are more nuanced formations that warrant attention. The Advance Block and the Deliberation are sophisticated patterns that suggest market indecision, signaling possible directional changes. The Stick Sandwich, which features a bearish candle flanked by two bullish candles, conveys market uncertainty that can lead to bullish reversals.
The Concealing Baby Swallow offers a blend of complex sentiments. This pattern arises when a small bullish candle appears in between two larger bearish candles, indicating that buyers are beginning to gain strength against the prevailing trend. Moreover, the Matching High and Matching Low patterns can signify potential reversal points in the market by indicating that prices are struggling to maintain upward or downward momentum.
The Importance of Risk Management
While mastery of candlestick patterns is indispensable, scalpers must also emphasize risk management. The inherent volatility and rapid nature of scalping necessitate a disciplined approach to trading. Utilizing stop-loss orders, position sizing, and adhering to a trading plan are essential practices that can safeguard traders from significant losses.
Conclusion
In conclusion, mastering scalping trading requires a comprehensive understanding of various candlestick patterns. From bullish formations such as the Three White Soldiers and Bullish Engulfing to bearish patterns like the Three Black Crows and the Bearish Engulfing, the ability to read these signals can significantly enhance a trader's effectiveness in the highly competitive realm of scalping. Additionally, by integrating sound risk management strategies, traders can navigate the complexities of market fluctuations with greater confidence and proficiency. The combination of analytical skill, experience, and strategy within the framework of candlestick analysis positions traders to thrive in the dynamic world of financial markets.
