EURUSD 5 DEC 2022EURUSD 15MIN
We didn't have any specific movements from Sydney session up to US PMI RATE !
After that the market dropped down and we started to create a bearish channel!
I think this channel can create at least one more leg but we will be in TR until next session!
Scalping

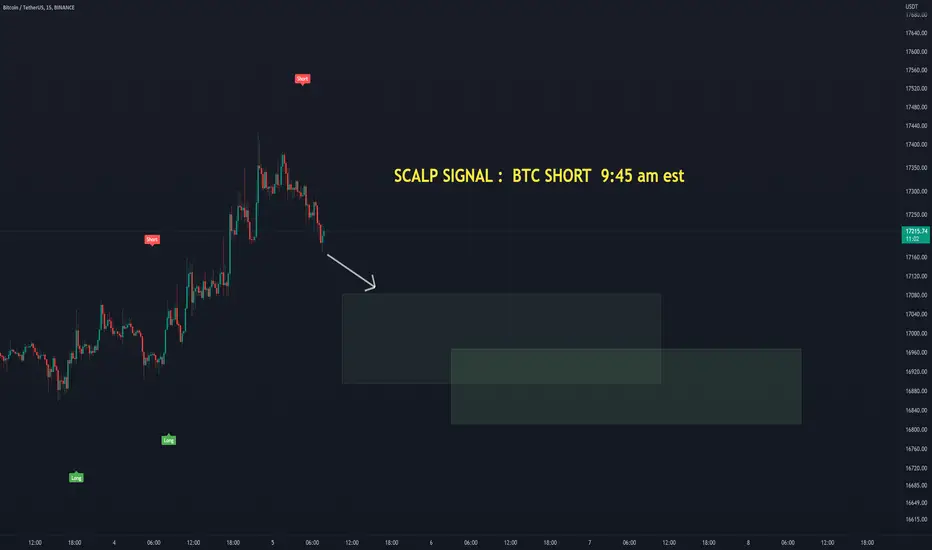
Bitcoin Scalping Signal for Day Trading🖥️ We have determined there is a 60% chance Bitcoin will Fall from our current entry point.
📉 SHORT - BTC : $17,210 📉
💵 Length of trade: we are expecting BTC to hit a 225 scalp, with a high end of $325, and a minimum expectation of $150.
🕰️ Duration of trade: we are expecting this to occur within 1.5 hours - 4 hours. Then we see a maximum duration of 14 hours.
📊🖥️ INDICATOR SHOWN ON CHART : Scot Signal Indicator
Bitcoin : Patience is KeyHello Team,
Currently Bitcoin is between a support & resistance level. For us we will not be placing trades within this range.
- If the price breaks above the resistance we will look for a buying opportunity.
- If the price breaks below the support we will look for a selling opportunity.
Patience is key, let price action tell us the answer.

Increased volumes. Good entry point The tool is in the leaders of growth, on increased volumes formed a resistance level with two touches on a round number, I expect a small trade, an increase in activity in the glass and an impulse exit to the long with the withdrawal of liquidity behind the level, I recommend going into the analysis of a large density at the level. Goal 88.88$

illiquid weekend analysis - trading=art .____.
//volume profile//
---->Value area high/low (confirmation/invalidation)
----> Point of control (confirmation/invalidation)
!!! high probability trade opportunity
//Blue candle vs purple candle//
----> pivot point at specific closing/opening time
(illiquid or liquid???)
//Grey cloud vs Black cloud//
black up
grey down
switchingpoint = res/sup/(orderblocks???)
//trendlines //
---> (confirmation/invalidation/scalps)

Scalping Idea for BTCUSDUnemployment rate coming out tonight if it come higher than expected which is obvious we can see some uptrend to 17230
disclaimer on

Scalping Idea for XAUUSD (Gold)scalping plan for tonight NFP
this is not signal just purely documentation
disclaimer on

A big shadow collected liquidity + volume passed. Goal - $16700After a rapid increase, the price went to the sideways. A big shadow collected liquidity from above + volume passed. Nailed the inclined level and fixed lower. We have come to the POC level and are working on it. I expect a breakdown of the level and a movement lower. First goal - 16700$

Scalping Idea for BTCBUSD
Beautiful huge candle breaking pivot. this is not signal but purely documentation.
position sizing and risk management depend on you like BEP, trailing stop loss using EMA or nearest instituonal level
disclaimer on especially tomorrow is the friday (non farm payroll)

Scalping Idea for EURJPY
Beautiful huge candle breaking pivot. this is not signal but purely documentation.
position sizing and risk management depend on you like BEP, trailing stop loss using EMA or nearest instituonal level
disclaimer on

Scalping Idea for GBPJPY
Beautiful huge candle breaking pivot. this is not signal but purely documentation.
position sizing and risk management depend on you like BEP, trailing stop loss using EMA or nearest institutional level
disclaimer on

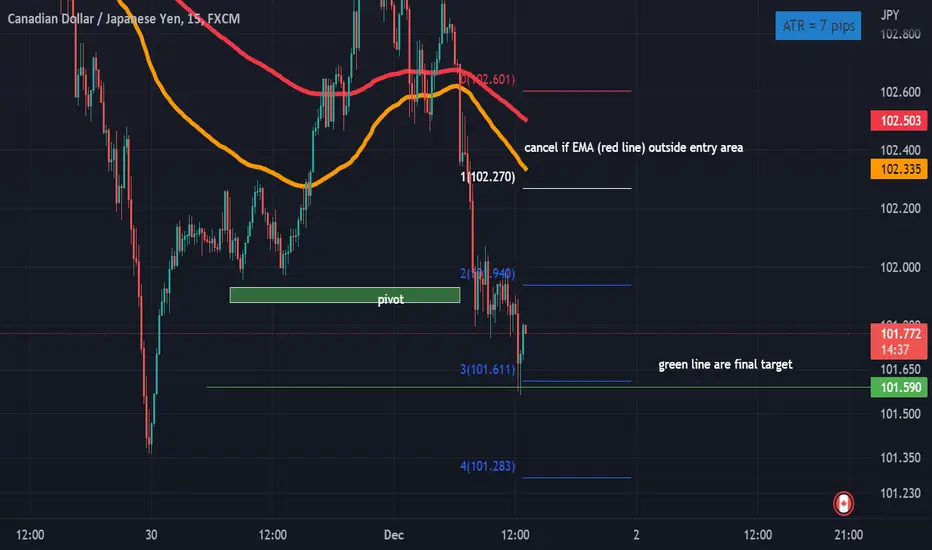
Scalping Idea for CADJPYBeautiful huge candle breaking pivot. this is not signal but purely documentation.
position sizing and risk management depend on you like BEP, trailing stop loss using EMA or nearest instituonal level
disclaimer on
ETC: when for $9?If you look at the global price movement, you can see that the coin is now in a downward structure.
The downtrend and the signal of the indicator show that it is better not to buy in long-term deals. Short positions remain in priority.
If we consider purchases, then only within the day and with short take profits.
In the future, I think that the price will continue to decline to $ 9. There is support in the form of an uptrend here, and there has not yet been a buy signal from the indicator.

Triangle. Breakout of the resistanceThe instrument is inside the local triangle. There was a fake breakout of the resistance and sellers took the advantage. Points of control resist buyers while delta has changed into stable red. Open short during the execution of the pointed limit order. Target - 0.375

An asset with great volatility. Time to sell!The asset today is traded on volumes. After a strong movement, the price went to the sideways. From the upper border of the sidebar we get a reaction in the video of large shadows. At the bottom, an inclined level was formed. I expect the exit from the sideways down and the movement to the inclined level

NZD JPY SHORT SCALPTarget 1:1 RR
Disclaimer:
The contents in this Idea are intended for information purpose only and do not constitute investment recommendation or advice. Nor are they used to promote any specific products or services. They serve as an integral part of a case study to demonstrate fundamental concepts in risk management under given market scenarios. A full version of the disclaimer is available in our profile description.

XAUUSD INTRADAY ANALYSIS 29.11XAUUSD ANALYSIS PREFERENCE LONG
Long Target 1750/1763
Pivot 1734
Short Target 1728/1720

Triangle. Time to sell!15m TF. A triangle formed on the asset. Got a strong movement. The price is pressing towards the lower limit. Shadows form on top. I think the buyer is weak. I expect a breakdown down. Goal - 72.16$

MES trade recap Monday 11/28Just a quick recap of what the market did and my thought process behind trades that I took.

NZDCAD Sell-OffPrice is trading in an impulse move, I'm expecting a wave 5 drop soon whether on the current level which is the 50% or 61.8% Fibonacci level although the price can't break the marked-up level.

GBPCAD short trade, look for pullback.GBPCAD (short trade)
Base on One hour and Four hour chart,
1 hr and 4 hr MACD - going down
1 hr and 4 hr STOSH - going down
daily - going up
technically it is good to do a pullback trade on next trading day if the price isn't break the previous high.
entry price place around 1.1600 / 1.16700 and aim for 50 to 100 pips TP and SL.


BTCUSDT Shorthey traders
price fighting in the 1H Zone
what u think ?
can we touch 13650 ?
share ur chart and leave a comment
