CHFJPY short Diamond ScalpThis post does not provide financial advice. It is for educational purposes only! You can use the information from the post to make your own trading plan for the market. But you must do your own research and use it as the priority. Trading is risky, and it is not suitable for everyone. Only you can be responsible for your trading
Scalping

Egld/USDT Long📈Egldusdt long breakout
All conditions for long is confirmed
If we get divergence on 5min chart take profit will be very low
Take profit is dynamic/trailing stop loss.I may update trailing stop loss in the comment box
P.S.THIS IS NOT A FINANCIAL ADVICE

" Gold " Let's Take Buy Trade With Many Pips Good Morning Trader's ,, How Are You Today ?
Let's Explain Together "Gold" Chart And Reasons To BUY From This Area !
!! We Sell Gold From 1785 And Get All Tp Done ,, Now We Look For Buy Trade !!
1- What Is The Trend For Gold ? Now ,, It's In Down Trend ,, IF we Break Out 1800 We Will Going To Up Trend To 2070
2- Why We Will BUY From This Area ? Support Area + Golden Zone + SMC Area + Gann Level
3- When We Close The Target As Stop Lose ? Close Down 1670 Daily Candle
4- Best Area To Lone ? 1700 - 1680
Any Questions Please Write me On Comments !

"GBPUSD " Buy Limit Trade With 0 Reflection Good Morning Trader's ,, How Are You Today ?
Let's Explain Together "GBPUSD" Chart And Reasons To BUY From This Area !
1- What Is The Trend For GBPUSD ? Now ,, It's In Down Trend ,, And We When Break Out The Trend Line We Will Going To Up Trend
2- Why We Will BUY From This Area ? Golden Zone Area
3- When We Close The Target As Stop Lose ? Close Daily Candle Down 1.15500
Any Questions Please Write me On Comments !


eurusdsupply demand surfaces and levels you can apply and set your orders on the levels fore scalping in day trade time


btc ANALYSE| BTC/usdt idea 1hi think we will have dump to 20500 atleast / 21100 risk free / 20500 close

ATOM - Stoploss hunt is coming🚧Shib is awesome candidate for long since:
⭐️ BTC bearish
⭐️ Domination looks bullish
⭐️ We are in the end of formation
⭐️ Spread is getting lower
⭐️ 4th approach
⭐️ Seller appeared
⭐️ Stoplosses are close
⭐️ Volume increases at top
⭐️ 30 ATR
⭐️ Under VWAP
Will enter when price slowly squeezes to the levelon 5m timeframe, the base will form and the tape will get faster.
Fix profit by parts:
1% - 1/3
2% - 1/3, stoploss to breakeven
What's left, hold to the maximum
What do you think of this idea? What is your opinion? Share it in the comments📄🖌
If you like the idea, please give it a like. This is the best "Thank you!" for the author 😊

INFY DAY CHARTInfy has started sustaining below channel on 1day and 15 min chart.
Guess What could be the target ?
Chart is for study purpose only !

Zil/USDT Long📈 5min scalpN.B. These lines and levels are for 15min chart only
All conditions met
High risk: Very High rewards
P. S. THIS IS NOT A FINANCIAL ADVICE
IT'S LIKE A TRADING JOURNAL TO ME

Gmt/USDT Long📈 5m scalping tryI will buy after the pullback when a buy dot signal appears
If I take a long position I will update in the comment box
After long entry if we see bearish divergence we will close the trade after confirmation or else we will take profit at resistance area/trailing stop loss
P. S. THIS IS NOT A FINANCIAL ADVICE

SHIB - Woof-Woof! Long✈️Shib is awesome candidate for long since:
⭐️ BTC bullish
⭐️ Domination looks bearish
⭐️ We are in the end of formation
⭐️ Spread is getting lower
⭐️ 5th approach
⭐️ Had false breakout
⭐️ Had stoploss hunt
⭐️ Volume increases at top
⭐️ 50 ATR
⭐️ Over VWAP
Will enter when price slowly squeezes to the levelon 5m timeframe, the base will form and the tape will get faster.
Fix profit by parts:
1% - 1/3
2% - 1/3, stoploss to breakeven
What's left, hold to the maximum
What do you think of this idea? What is your opinion? Share it in the comments📄🖌
If you like the idea, please give it a like. This is the best "Thank you!" for the author 😊

ENJ Scalp - Very easy long😏ENj is awesome candidate for long since:
⭐️ BTC bullish
⭐️ Domination looks bearish
⭐️ We have 5 days of accumulation
⭐️ Spread is getting lower
⭐️ 4th approach
⭐️ Volume increases at top
⭐️ 50 ATR
⭐️ Over VWAP
Will enter when price slowly squeezes to the levelon 5m timeframe, the base will form and the tape will get faster.
Fix profit by parts:
1% - 1/3
2% - 1/3, stoploss to breakeven
What's left, hold to the maximum
What do you think of this idea? What is your opinion? Share it in the comments📄🖌
If you like the idea, please give it a like. This is the best "Thank you!" for the author 😊

BNB - Symetrical triangle longBNB is interesting since
⭐️ It had 2 false breakouts
⭐️ BTC looks bullish
⭐️ Domination looks bearish
⭐️ We have 2 days of accumulation
⭐️ Spread is getting lower
⭐️ 40 ATR
⭐️ Squeezing to VWAP
Will enter when price slowly squeezes to the trendline on 5m timeframe, the base will form and the tape will get faster.
Fix profit by parts:
1% - 1/3
2% - 1/3, stoploss to breakeven
What's left, hold to the maximum
What do you think of this idea? What is your opinion? Share it in the comments📄🖌
If you like the idea, please give it a like. This is the best "Thank you!" for the author 😊

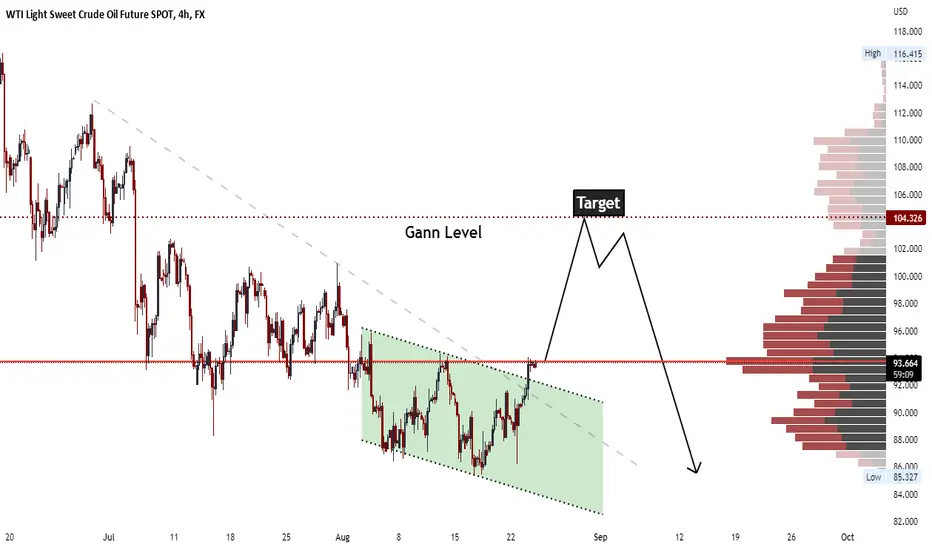
" USOIL " Buy Trade ( With 1000 Pips Target )Good Morning Trader's ,, How Are You Today ?
Let's Explain Together "USOIL" Chart And Reasons To BUY From This Area !
1- What Is The Trend For USOIL ? Now ,, It's In Down Trend ,, We Have Break Out Trend Line And Channel And Wait To Break Out Resistance Area To Enter Buy
2- Why We Will BUY From This Area ? Trend Line Break Out - Channel Break Out - Gann Direction
3- When We Close The Target As Stop Lose ? When USOIL Close Down 90.00 With Daily Candle
Any Questions Please Write me On Comments !
AR - Rocket ready to launch🚀Take a look at this beautiful setup!
⭐️ Market looks bullish
⭐️ Domination looks bearish
⭐️ Trendline is 13 days long
⭐️ We have volume at bottom, someone is holding the price
⭐️ Enter on 4th approach after trap
⭐️ Over VWAP
⭐️ 30 ATR
Will enter when price slowly squeezes to the trendline on 5m timeframe, the base will form and the tape will get faster.
Fix profit by parts:
1% - 1/3
2% - 1/3, stoploss to breakeven
What's left, hold to the maximum
What do you think of this idea? What is your opinion? Share it in the comments📄🖌
If you like the idea, please give it a like. This is the best "Thank you!" for the author 😊

Daily analysis & day trading setups - SPX500 SPX S&P500 20220823Happy Tuesday, Happy PMI Day,
If you fib 10 DMA & 100 DMA, SPX is standing right in the middle. This is the moment of making up the mind.
Bulls want to push it above 4175-200 and bears want to continue below 4135-100
Macro EU ECB Panetta Speech, Consumer Confidence, US PMI, Home Sales
Buy
Break: 4 145, 155, 170
Reversal: 4 140, 122, 100, 085, 070
Sell
Break: 4 145, 125, 110, 090
Reversal: 4 160, 172, 182, 208, 230
I regularly publish my daily analysis & trading plan for day trading setups. The links are here:
NASDAQ
DAX
SPX
Green Goblin levels are here >>>
Fibonacci Confluence levels are here >>>

short or longanother idea;)
PATIENT is the key for TRADERS
its clear market in the trading range and the price just playing with resistance zone and show the triangle, ever the patterns help me to trade better in TR(trading range).
after breakout the triangle its easy to understand the price breakout the resistance zone or we can ready for short by PULLBACK,PINBAR AND ENTRY BAR.
TIPS: the price show divergence on the RSI and high probability price can comeback to support zone


BTC Daily Update - Looks like we are going higherCurrently BTC is in range and getting closer to the end of formation.
If you look at the bottom, you can see global support and surprisingly how many times we did false breakdown of the support.
Currently we are approaching high's, and if we see a couple hours of accumulation with low spread candles, we may finally break out of this range. Alternatively we will just accumulate power in this range further.
What do you think of this idea? What is your opinion? Share it in the comments📄🖌
If you like the idea, please give it a like. This is the best "Thank you!" for the author 😊
P.S. Always do your own analysis before a trade. Put a stop loss. Fix profit in parts. Withdraw profits in fiat and reward yourself

FTM Scalp long - Time to rise babyTake a look at this beautiful setup!
⭐️ BTC looks bullish
⭐️ Accumulation 3 days
⭐️ Domination looks bearish
⭐️ We have volume at bottom, someone is holding the price
⭐️ 4th approach
⭐️ Over VWAP
Will enter when price makes a trap, then slowly squeezes to the trendline on 5m timeframe, the base will form and the tape will get faster.
Fix profit by parts:
1% - 1/3
2% - 1/3, stoploss to breakeven
What's left, hold to the maximum
What do you think of this idea? What is your opinion? Share it in the comments📄🖌
If you like the idea, please give it a like. This is the best "Thank you!" for the author 😊

CHZ - Coin is stronger than a market!📈Take a look at this beautiful setup!
⭐️ Coin rose when BTC fell
⭐️ BTC looks bullish
⭐️ Domination looks bearish
⭐️ We have volume at bottom, someone is holding the price
⭐️ Enter on 4th approach after trap
⭐️ Squeezing to VWAP
Will enter when price makes a trap, then slowly squeezes to the trendline on 5m timeframe, the base will form and the tape will get faster.
Fix profit by parts:
1% - 1/3
2% - 1/3, stoploss to breakeven
What's left, hold to the maximum
What do you think of this idea? What is your opinion? Share it in the comments📄🖌
If you like the idea, please give it a like. This is the best "Thank you!" for the author 😊
