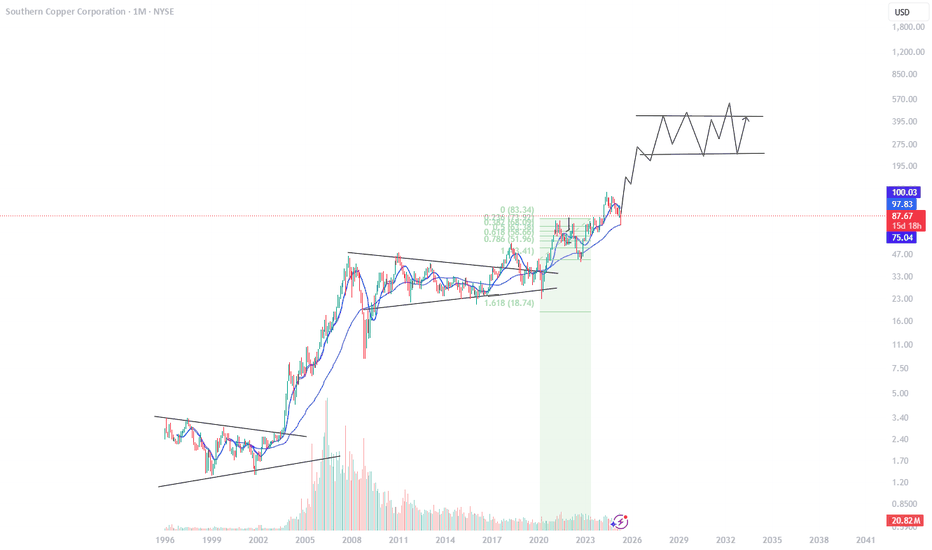
SCCO
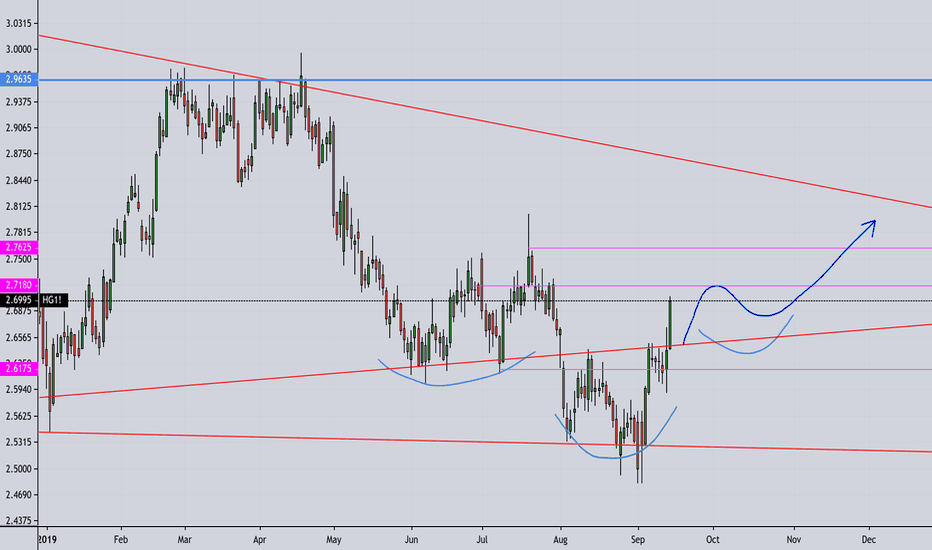
Copper & Oil : Are commodities about to surge? Copper is showing great pattern consolidation.
it appears to be putting in a daily bull flag pattern that looks poised to breakout.
If copper follows some of the other recent price action in the commodity space it makes it even more likely to surge.,
You're seeing #gold #uranium #oil and other all performing well.
Will this dampen and slow down the dis inflation expectations? Perhaps.
I am long SCCO with members and have already secured some profits today with members.
I do think there is more strength to come in copper.
Coppers and RobbersThe current copper setup is a steal.
Looking back we find copper price action is in a similar position to that of 2005. Overhead resistance above can give a rough estimate of a top should prices continue to break higher
The weekly MACD is almost too perfect. Suspicious maybe. Nonetheless, support is $4.00 and only a sustained break below would arrest this trend.
Target above.
The best play on Copper is SCCO - southern copper corp - nice dividend payer. For the last year SCCO looked like it could be forming a bull flag after tagging the 1.618 extension level
The 2.618 level is still the target and judging by this breakout, Copper's probationary period might be over
HG Copper Futures- Short to Long SetupHG is on the 30 minute chart with a set of EMAs ( 7- blue 20-red and 100-black) ascended
6 % in 7 days from the morning of 4/23 to the evening of 4/29. This is traded with a leverage
of 25. A short trade taken on the reversal is now impending closure. The short falls faster than
the long climbs and will yield about another 6% in 24 hours or so. The trade is setup to close
when price crosses the EMA7 and stays above it for three consecutive candles ( 90 minutes).
I long trade will then be contemplated to continue to take full advantage of the volatility.
The RSI indicator should show a rise toward the 50 level to validate a long trade and some
green buying volume candles should print. Rinse and repeat.
SCCO bulls struggle at current highs.SOUTHERN COPPER CORPORATION - 30d expiry - We look to Sell at 77.48 (stop at 81.21)
We are trading at overbought extremes.
Posted a Double Top formation.
Bespoke resistance is located at 78.70.
Resistance could prove difficult to breakdown.
Early optimism is likely to lead to gains although extended attempts higher are expected to fail.
We look for a temporary move higher.
Our profit targets will be 68.22 and 67.22
Resistance: 73.30 / 76.00 / 78.76
Support: 69.88 / 66.47 / 63.00
Please be advised that the information presented on TradingView is provided to Vantage (‘Vantage Global Limited’, ‘we’) by a third-party provider (‘Signal Centre’). Please be reminded that you are solely responsible for the trading decisions on your account. There is a very high degree of risk involved in trading. Any information and/or content is intended entirely for research, educational and informational purposes only and does not constitute investment or consultation advice or investment strategy. The information is not tailored to the investment needs of any specific person and therefore does not involve a consideration of any of the investment objectives, financial situation or needs of any viewer that may receive it. Kindly also note that past performance is not a reliable indicator of future results. Actual results may differ materially from those anticipated in forward-looking or past performance statements. We assume no liability as to the accuracy or completeness of any of the information and/or content provided herein and the Company cannot be held responsible for any omission, mistake nor for any loss or damage including without limitation to any loss of profit which may arise from reliance on any information supplied by Signal Centre.
SCCO:Correction or Reversal?SOUTHERN COPPER CORPORATION
Short Term - We look to Buy a break of 48.98 (stop at 45.51)
Price action produced another positive week, last week. Trading within the Wedge formation. The bias is to break to the upside. A higher correction is expected.
Our profit targets will be 58.22 and 60.00
Resistance: 48.90 / 60.00 / 80.00
Support: 46.80 / 42.00 / 34.00
Please be advised that the information presented on TradingView is provided to Vantage (‘Vantage Global Limited’, ‘we’) by a third-party provider (‘Signal Centre’). Please be reminded that you are solely responsible for the trading decisions on your account. There is a very high degree of risk involved in trading. Any information and/or content is intended entirely for research, educational and informational purposes only and does not constitute investment or consultation advice or investment strategy. The information is not tailored to the investment needs of any specific person and therefore does not involve a consideration of any of the investment objectives, financial situation or needs of any viewer that may receive it. Kindly also note that past performance is not a reliable indicator of future results. Actual results may differ materially from those anticipated in forward-looking or past performance statements. We assume no liability as to the accuracy or completeness of any of the information and/or content provided herein and the Company cannot be held responsible for any omission, mistake nor for any loss or damage including without limitation to any loss of profit which may arise from reliance on any information supplied by Signal Centre.
$SCCO Bullish Copper ChartSCCO is a nice setup in my opinion. After a nice +250% rally, SCCO has formed a solid VCP pattern with nice rounded base and appears to be ready for the next leg up.
Started a position here and will add on a break above 80.
For those looking for less, risk can alarm the breakout and go long there, as we may get one more dip to shake out weak hands before more upside.
I'm long the JUN 90 calls to give this trade time to work , with 2,300 OI
First price target $96
SCCO nearing breakout of falling wedge patternSince 52 week high in May, SCCO is in a downtrend and it's nearing a breakout of upper trendline in falling wedge pattern. Local lows and local highs trendlines have been converging on relatively declining volume. If it closes weekly above 61.6 (now it's hovering just over 61), a bullish reversal of the existing downtrend and return to to a previous uptrend is possible. Comments are welcome and appreciated!
My first practicing in Elliott theoryThis is my first attempt to follow Elliott wave pattern.
After wave A B C correction, seems we are now at the beginning of new wave 3, which should be the longest one with 1.6 fibo retracement of wave 1. Previous waves 1 to 5: W2 did not retrace more than W1, W3 was the longest, W4 didn't go beyond W3. New waves 1 to 5: W2 didn't retrace more than low of W1 so far. Should I follow 1.6 fibo retracement of W1 high, the goal is around 73. Comments are more than welcome and appreciated, if i am named an idiot of the day, it will be appreciated as well! :_)
SCCO —> the copper giantSCCO is one of the company dealing in copper and copper mining, it has kind of monopoly over copper. With recent EV demand , copper demand will also increase.
Right now it is offering a very god entry point near its stron support. Overall it has finished with cup and handle pattern . It should test 75 levels soon.
Idea is for entertainment , its not a trading advice
I hope you are enjoying my analysis, ideas here are for entertainment and education these are not trading advice. Dont forget to like , follow me and check my other ideas.
Copper futures at 9 year highs, FCX SCCO HBMCopper futures at 9 year highs and all time high is around $4.65, FCX is the world's largest publicly traded copper producer. It is following the price of commodity. Demand for copper from renewable sector is growing as new power generation capacity addition renewable energy (China/India).
Options - The March 19 $38 calls traded over 11000 times, over 34,000 in Open interest. The march put call ratio is .46.
April options put call ratio - .76, probably a pull back at some point after strong move friday.
copper cup for fcx.. setting up before earnings week.lets see how this goes. these patterns are so funny. seems they work out about 2% of the time... maybe this is it?
Can find a bunch of these cups as you look through your favorite names. Bet they all break the same way, at same time. Will be interesting to see what puts the next move in motion.
Good luck out there!
Short $COPPER We ended last week with a doji candle at the trendline from the 2011 highs and with RSI hovering around overbought levels.
Copper's weekly and monthly close will be foreshadowing for markets into US Presidential Elections on November 3, 2020.
Trade idea is a sell stop (or buy stop) above on a daily candle close below (or above) weekly doji candle.
For updates, follow me on Twitter @FomoFutures.
Probably the best copper mining stock out there !See chart for analysis.
Logic is quite simple - to reignite the economies worldwide, governments would have to spend a lot on infrastructure projects to create jobs. Copper, as one of the key commodities in many infrastructure projects would be in high demand.
And this chart is showing the price action being depressed for quite a while. It has now broken out of the bearish trend and is preparing its bullish move.
There is a high likelihood we see some consolidation here before it breaks out and soar higher.
You can put this in your watchlist !


