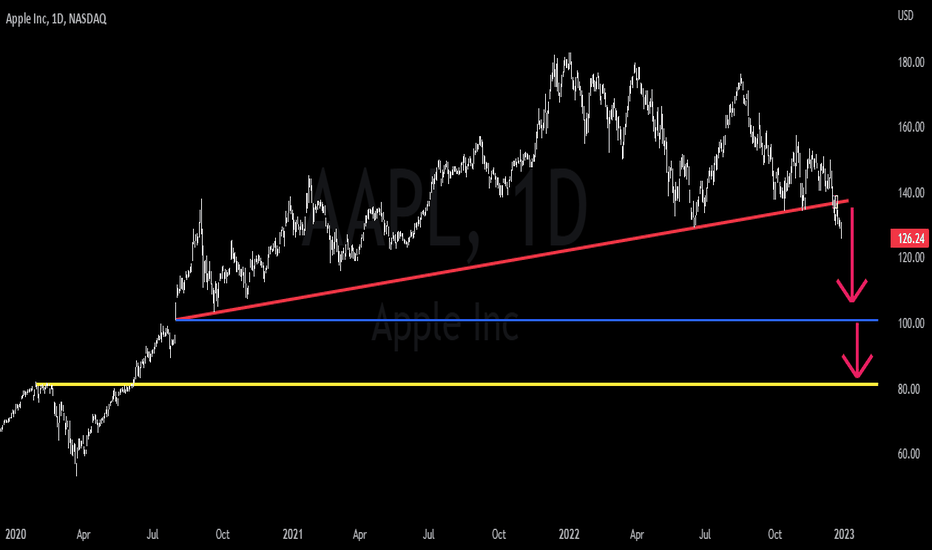
APPL to $80?Here we are looking at AAPL on the daily TF.
What we are looking at is a Yellow trend line going back to January 2020, right before Covid lock downs.
As you can see, this line served as major resistance until the breakout in June of 2020. I believe that this trend line will be tagged again in 2023.
The upsloping Red trend line was a major support line until it was tagged repeatedly and then broke. If you look at the tail of the First big red arrow you will see 2 boxes.
The purple box indicates that it had broken the support line and the yellow box is showing that line now as a resistance. Also note that there was a retrace to the scene of the crime before further downside action.
We are now watching for AAPL to fall to the $100 dollar level and ultimately down to $80 which is indicated by the blue line then the yellow line.
Notice that this is the first support level , it is an even number, and is right at double bottom where the stock should get a technical bounce and then push through to $80 sometime in 2023.
What do you think AAPL will do next? Let me know in the comments!
Cheers!
Sceneofcrime
EURUSD - Intention for a crime...and they often come back. ;-)So, here we have it again.
After the blue "Time Eater", price has to break out of this range.
You can identify the "killer break". It's made with intention, it will show up - like here, this huge bar (orange).
After the breakout, there is a small pause (yellow Sine Wave Center).
This Sine Wave Center will often get broken, because the week hands hide their stops behind such little structures.
And since we know that a villain often comes back to the scene of the crime, we just have to wait and observe this place, to catch him ice cold and "go long to jail". hehe...
Hide & observe...
P!

