#Altcoin pick 15: HyperGPT $HGPTTime to accumulate this AI and AI agents project developing advanced language models and intelligent agents for decentralized applications.
Seasonality

Alt season could already be here, only is winter seasonThe Crypto Market at a Crossroads: What’s Could Next for Bitcoin and Altcoins?
The cryptocurrency market is at a critical juncture, and the narratives being pushed by crypto influencers might not be telling the full story. Over the next weeks and months, the altcoin landscape could undergo significant changes, and there are signals emerging that few are discussing. In this post, I’ll analyze Bitcoin, altcoins, and Bitcoin dominance and what I expect in the coming months.
Bitcoin’s Current Position: Are We Near the Top?
When analyzing Bitcoin, it’s crucial to zoom out and assess the bigger picture. On a weekly chart, Bitcoin’s price action suggests that we might be nearing a top. While some argue that the peak has already occurred, the current structure indicates that Bitcoin could enter a sideways/ downward movement like we saw last year.
If Bitcoin continues to move sideways, altcoins are likely to follow suit. However, during these phases, some altcoins may experience brief runs, especially if Bitcoin dominance starts to decline.
But here’s the catch: Bitcoin dominance has been steadily rising since Bitcoin’s bottom, which is unusual. Typically, during the late stages of a cycle, Bitcoin dominance drops as altcoins surge. This time, however, the landscape seems different.
Altcoin Season: A Muted Rally?
The idea of a massive altcoin season, where all altcoins surge simultaneously, might be a thing of the past. While some coins like BINANCE:SOLUSDT have already seen significant runs (from nearly $80 to $300 top in one year), the broader altcoin market has not experienced the same explosive growth. Instead, only a select few altcoins made significant moves.
This doesn’t mean that altcoins are dead. There will still be opportunities, but they will likely be more selective. Coins that have already made substantial gains, like Solana, may have already topped out.
Going forward the key should be to focus on coins that show strong volume breakouts and price action, rather than holding onto underperforming assets.
Bitcoin Dominance and the Changing Landscape
Bitcoin dominance has been on an upward trajectory, which is unusual for this stage of the cycle. Historically, Bitcoin dominance falls as altcoins begin to rally.
However, this time, the dominance chart suggests that the market dynamics are shifting. While a drop in Bitcoin dominance is still possible, it may not be as pronounced as in previous cycles.
This changing landscape could be due to the sheer number of altcoins in the market. With thousands of coins vying for attention, there simply isn’t enough liquidity to pump all of them. This dilution effect means that only a handful of coins will likely see significant gains, while the majority will continue to underperform.
The Role of Meme Coins and Newer Projects
One of the standout trends in this cycle has been the rise of meme coins and newer projects. Coins like BINANCE:SUIUSDT , which launched during this cycle, have already broken their all-time highs. However, even these newer coins may be entering a bear market phase.
The market is saturated, and without a significant influx of liquidity, it’s unlikely that we’ll see another massive altcoin season.
Meme coins, in particular, have been a double-edged sword. While they’ve provided some of the most explosive gains, they’ve also drained liquidity from the broader market.
This extraction of value has made it harder for other altcoins to gain traction, further complicating the market dynamics.
The Bigger Picture: A Potential Bear Market
Looking at the broader market, there’s a growing possibility that we could be entering a bear market.
The sheer number of coins in the market, combined with the lack of liquidity, suggests that the crypto space is due for a significant shakeout.
Coins like BINANCE:DOTUSD , CAPITALCOM:FILUSD and even BINANCE:ADAUSDT , which have been in a bear market since 2021, are a prime example of this trend.
Many altcoins are already down 80-90% from their all-time highs, and the chances of them recovering are slim.
This is why it’s crucial to focus on coins that have already established a bull trend and are hovering around their support zones, as they have a higher probability of breaking out and continuing their upward trajectory.
Key Takeaways and What to Watch For
1. Bitcoin’s Sideways Movement: Bitcoin is likely to move sideways or slightly downward in the coming weeks, which could create opportunities for select altcoins.
2. Selective Altcoin Runs: Not all altcoins will rally. Focus on coins with strong volume breakouts and price action.
3. Bitcoin Dominance: Keep an eye on Bitcoin dominance. A drop could signal a brief altcoin rally, but it may not be as significant as in previous cycles.
4. Meme Coins and Newer Projects: While meme coins and newer projects have seen gains, they may be entering a bear market phase. Be cautious with these assets.
5. Long-Term Bear Market : The crypto market could be entering a bear market. Focus on preserving capital and avoid holding onto underperforming assets.
Final Thoughts:
The crypto market is at a crossroads, and the next few months could be pivotal. While there will still be opportunities, they will likely be more selective and harder to come by.
By focusing on strong projects with solid fundamentals and avoiding the hype, you can navigate this changing landscape more effectively.
Remember, the key to success in crypto is not just about making money—it’s also about avoiding losses.
Best of Luck!
Mihai Iacob

GPB/JPY - Weekly OutlookHi all,
This is my analysis for this pair.
This is a HTF breakdown, finishing the week off we have broken previous structure. This does insinuate we are going to continue Bearish momentum although we are currently trading within a Mitigation Block in the Weekly view so two things could happen here being we get a smaller TF reversal of which I will be waiting for confirmation before buying or I could even possibly see price breaking through this Extreme Demand zone to continue selling off.
We have claiming Sell side Liquidity and the Equal Highs does tell me we have a lot of reasons to push up higher to take Buy side Liquidity where we see Higher TF Imbalance and resting Liquidity.
Due to being uncertain with this trading plan if we do see a small reversal we could still take a trade towards the Mitigation Block to claim more sellers before selling off Higher.
This is a risky trading plan so if you do follow be sure to use risk management.

Altseason Ahead? Bullish Divergence Signals a ShiftThere are conflicting views on whether we are entering an altseason. However, when comparing altcoins to Bitcoin, we can see a bullish divergence forming, signaling an increased probability of an upcoming altseason.
Do you think this is the beginning, or is Bitcoin dominance still too strong?

Market in Consolidation, The Calm Before the Next Big MoveThe market is currently in a sideways consolidation phase, showing a lack of significant movement across altcoins. This is a natural occurrence following an impulsive move, where price action stabilizes before the next major breakout. Such phases often lead to a period of uncertainty as traders wait for a clear directional move.
After a strong price movement, it is common for the market to go into sideways consolidation before deciding its next direction. Right now, almost every altcoin is forming a symmetrical triangle pattern, which suggests that buying and selling pressures are balancing out. This pattern typically acts as a precursor to a major breakout, either upward or downward, depending on market sentiment and external factors.
During this phase, it is crucial to exercise patience and avoid making impulsive trades. The best strategy is to wait for confirmation of a breakout before entering the market. A decisive break above or below the current range will provide clarity on the next significant move. Traders should closely monitor key support and resistance levels to position themselves effectively.
Historically, prolonged periods of consolidation lead to strong moves in either direction. The longer the market remains in this phase, the more powerful the eventual breakout is likely to be. Being prepared and having a well-defined trading plan will be essential in capitalizing on the next market movement.

Bitcoin Dominance Pumping , Is the Altcoin Market in Trouble ?Bitcoin dominance has broken a significant resistance level, signaling a shift in market dynamics. The previous double top formation has completely failed, and dominance is now sustaining above the prior highs. This development has bearish implications for altcoins, as Bitcoin's growing market share typically leads to capital outflows from the altcoin sector.
Key Points on the Chart
Double Top Failure & Breakout Confirmation
The market was previously forming a double top pattern, a classic reversal setup that often signals a potential decline.
However, BTC dominance not only broke the double top resistance but has held above it for multiple days, confirming bullish continuation.
A failed double top often results in a strong move upward, as short-sellers covering their positions add to the momentum.
Ascending Channel Structure
The chart shows BTC dominance moving within a rising wedge/ascending channel formation.
The breakout above the mid-channel resistance suggests an acceleration in trend strength, increasing the likelihood of BTC dominance rising further. As long as dominance stays within this structure, Bitcoin will likely outperform the altcoin market.
Key Support & Resistance Levels
56.44% level was a major resistance in the past and is now a confirmed support zone.
61.91% (current level) marks the breakout region, now acting as new support.
If dominance continues its uptrend, the next potential resistance area could be 66%–68%, marking the upper boundary of the trend.
Impact on Altcoins
Altcoin Weakness Likely to Continue
Historically, when BTC dominance increases, altcoins tend to bleed as capital rotates toward Bitcoin. Many altcoins may struggle to gain momentum unless BTC dominance reverses from this region.
Conditions for Altcoin Recovery
For altcoins to regain strength, BTC dominance must decline from this breakout zone.
A rejection from the upper trendline (~64%–66%) could create a temporary relief rally in altcoins.
Altcoin Seasonal Trends
Typically, altcoins start recovering once BTC dominance peaks and shows weakness.
Until then, Bitcoin remains the safer bet, while altcoins carry higher risk.
Trading Considerations & Strategy
For BTC holders: The breakout suggests strong dominance continuation, meaning Bitcoin may remain the best-performing asset in the short term.
For altcoin traders: Monitor Bitcoin dominance closely a drop back below 60% would be the first sign of relief for altcoins.
For market timing: If BTC dominance approaches 64%–66%, a potential rejection could provide entry points for altcoins.
Bitcoin dominance has broken a crucial structure, signaling altcoin weakness and Bitcoin strength. Until BTC dominance reverses or consolidates, altcoins may struggle to gain momentum. Watch the 64%–66% zone for signs of exhaustion if BTC dominance starts rejecting from there, it could mark the beginning of an altcoin resurgence.

#Altcoin pick 14: Blendr Network $BLENDR Time to accumulate this integrating AI with decentralized physical infrastructure networks, Blendr Network optimizes decentralized infrastructures with artificial intelligence.

Long Idea on CC1! (Cocoa)1)Climate change is having a significant impact on cocoa production in West and Central Africa, according to a study by Wageningen University & Research (WUR). The region accounts for more than 70% of global cocoa production. Changes in temperature and rainfall are making some areas less suitable for cocoa cultivation.
2) Seasonality gives us a bullish pattern which is 98% correlated with the actual price
3)quantitative data shows 80% win rate with a good profit factor
4) The price rejected the 50 EMA forming a Pin Bar Candlestick pattern
5) The price also bounced on a demand zone
6) Price is undervalued against several benchmarks

Short idea on KC1! (Coffee)1) COT Data shows the commercials reaching the short extremes on weekly timeframe
2) Seasonality shows a bearish pattern
3)Quantitative analysis shows 80% win rate for shorts
4) Coffe is Overvalued against different benchmarks
5) High quality supply zone
6)88% correlation between the actual price and the 10y seasonality

Correlation between ZB1! and xxx/usd pairs The 30 Year treasury bonds (ZB1!) is an asset that is really negative correlated with DXY and positive correlated with the other G10 currencies (XXX/USD). Historically The ZB tends to be bearish during the first 2 weeks of february

HLT Hilton one short term trade for me...but maybe i let profits run after securing some 5% gain.
we ll see how things turn out until 14./15. of feburary.
Cheers!

ABOUT USDCADMy option about usdcad Is more bearish so that zone is good and strong restanice if the price comes to that zone it can pullback

BTC & ALTCOINSIn this chart we can see Bitcoin historical Highs , lows , halving years (green->green) and halvings ... we can see some patterns here , not price patterns but sessionality patterns .. for example .. strong probabilty next btc HIGH will be in November/December this year , or we can also see on chart of BTC.D .. we are close to date when BTC.D breaks and fall as much as alts shine .. But all of this was history what about today ? What if , in this one cycle is something different , for example players ... Old good BTC and Crypto OG players now have less power as manipulators , we have some guys from wallstreet also here , Trump and much more .. Macroeconomic was totaly changed ... so what do you think guys ?

Wave 1 as leading diagonal (better chart pic)
I think it's worth bearing in mind that we could see some significant downside during the lull at the end of Q1. Red for Valantines, Green for St Patrick's.
This shows how we may never have transitioned into wave 2, but may actually be about to finish wave 1 as a leading diagonal.
We could be looking at wave 2 as a running/ expanding flat, in which case we see a significant rally, but something is niggling at me about this.
Watch the break of the high at $3.39, I'll be looking at the 4hr RSI to see if there's divergence. A close above with that divergence will possibly spell more downside than just a subwave correction.

#Altcoin pick 13: AgentLayer $AGENTTime to accumulate this specialized in artificial intelligence, AgentLayer develops intelligent AI agents capable of autonomous operations within blockchain applications.

The Secret Chart To Unlocking ALTSEASONBTC.D + USDT.D + USDC.D
Once we overcome this cumulated hurdle, we head to VALHALLA .

GBP/USD - Long PositionHi all..
If you have been following my updates on this pair you may have been catching a few nice setups. I did in fact catch this previous impulse move which was predicted from that marked Demand zone..
What we have no though is a new trading range. This is quite an interesting range to try to breakdown as we don't really have many level to actually buy from.
All the potential levels found are all from very low TF which suggest they all possibly could be weak levels to buy from.
The only try level I currently see to buy from is the level right at the top where my first Demand zone is sitting, this is my safest Demand due to "true" market consolidation which occurs before the next impulse movement.
Its potential that the move we have seen actually isn't finished which is why i believe this range could be a good area to buy from.
for me personally its not enough confluence to set a trade idea as it doesn't meet my plan.
This is not financial advice.. Good luck to all the traders that decide to follow

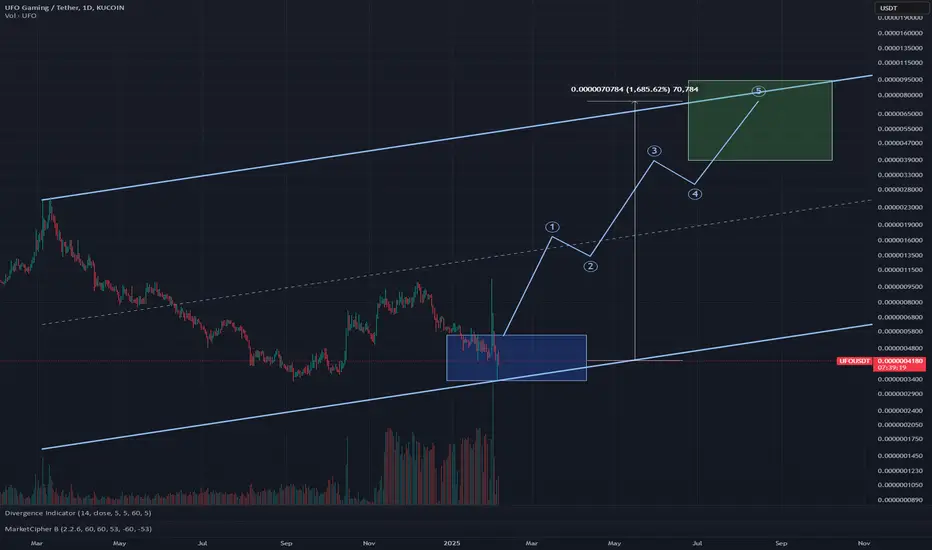
#Altcoin pick 12: UFO Gaming $UFO Time to accumulate this GameFi project merging gaming with DeFi, UFO Gaming creates a play-to-earn platform where players own in-game assets and earn rewards.
NSIT / Insight Enterprises BullishI see bullish momentum to the upside after a little correction.
Seasonality is on our side until early March as well.
Good luck!
Cheers!

Short Idea On ZC1! (Corn)1)On Cot data,we can see the commercials shorting at the extremes.
2)Seasonality gives us a short bias and quantitative data shows 80% win rate for shorts.
3) We overvalued on daily and weekly timeframe against several benchmarks
4) On weekly timeframe,the price rejected the EMA Forming a Pin bar reversal
5) I set the entry and stoploss on the supply structure as you can see in the picture

FCN trade coming upI got stopped in early already and price made one more down, but on the longer term (until mid of april) we should see some good gains.
This is not a trade call, but looking for a buy via a candle stick pattern or something you like and understand could be a provitable trade.
good luck!
cheers!

#Altcoin pick 11: Juno Network $JUNO Time to accumulate this smart contract platform within the Juno ecosystem, enabling developers to build and deploy decentralized applications with ease.

Buy Idea for STRIDE INC / LRN / K-12Seasonality should be on our side, so let'a find an entry into the stock.
Some minor trendline already broken.
Maybe you wanna buy after break of previous daily candle's high?
Good luck, leave a like or comment.
Let's chat!
Cheers!
