Sensitivity of Sunday Opening Price in ICT Concepts!!In the context of ICT (Inner Circle Trader) trading concepts, the "Sunday Open Price" refers to the price at which a currency pair opens on a Sunday evening, usually during the Asian market session, which is considered a key reference point for identifying potential market imbalances and trading opportunities throughout the week, as it often marks the start of a new trend or price movement.
Seasonality

Looks for buys On EUThe new quarter has resulted in EU changing it's direction from bearish to Bullish
I'm expecting the trend that started last week to continue this week as DXY has also changed character
Be on high alert as there are news events in the middle of the week

GBP/NZD - Weekly OutlookThis is an extremely strong Analysis for not just a Long Term Point of view but also a short term scale, let me explain.
Monthly/Weekly markets are both bullish. We can notice that price has reacted 3 times off a strong Weekly Imbalance. Price that makes 3 touches is considered a strong zone so now I would suggest we would have a final pullback off this zone before creating a new MSS in smaller time frames. We have market out the 50% level on the Fib to show our Discount zones before looking for any entry models.
So far on the Daily/4H we can see a large Bullish move but.. we are not sure whether this Bullish leg has actually just finished nor just started so we will have to wait and assess this Bullish Price action and adjust our Fib as the market move to work out our pull back points.
I have set up a strong Demand zone which does happen to be at our OTE right now but again this may change due to the Bullish movement not currently showing any sights of a pullback.
We only enter trade will the highest possibility's and currently this market is showing extremely strong signs of possible trade entry's but we still need to work out what those entries are.
Good luck to the traders that want to follow this market and would be interested in my entry model in this Market

Bitcoin’s Next Phase: Thrill, Euphoria and AltseasonSo, it seems that we are on track with the 4-year cycle, with our target to at least 150k, and entering the next phase: thrill, euphoria and altseason.
Of course, it’s not “up only” from here, and we do have specific market conditions that must align for this scenario to play out:
Bitcoin follows the 4-year cycle : Maintaining historical trends of market phases.
We remain in a crypto bull market : A rising tide lifts all boats.
Altseason begins : A period of intense growth and volatility for altcoins.
Retail money floods in : Increasing mainstream interest and participation.
Global markets are "healthy-ish" : No major economic black swans.
Monetary policy shifts to QE (quantitative easing) : A return to liquidity-friendly environments.
🌊 Our high risk altcoin picks for this altseason
#1 Glacier Network - best characterized as a Infrastructure, Smart Contract Platform and Layer 2 project.
#2 Karlsen Network - best characterized as a Smart Contract Platform, Layer 1 and Proof of Work project.
#3 Guacamole - best characterized as a Meme and DeFi project.
#4 Picasso Network - best characterized as a Smart Contract Platform, Layer 1 and Bridge Governance Token project.
#5 Three protocol - best characterized as a Smart Contract Platform and Payment Solution project.
#6 Octavia - best characterized as a Artificial Intelligence and AI Agent project.
#7 ZeroLend - best characterized as a DeFi, Governance and Lending/Borrowing Protocols project.
#8 LightLink - best characterized as a Infrastructure, Smart Contract Platform and Layer 2 project.
#9 enqAI - best characterized as an Artificial Intelligence project.
#10 AIT Protocol - best characterized as a Artificial Intelligence project.
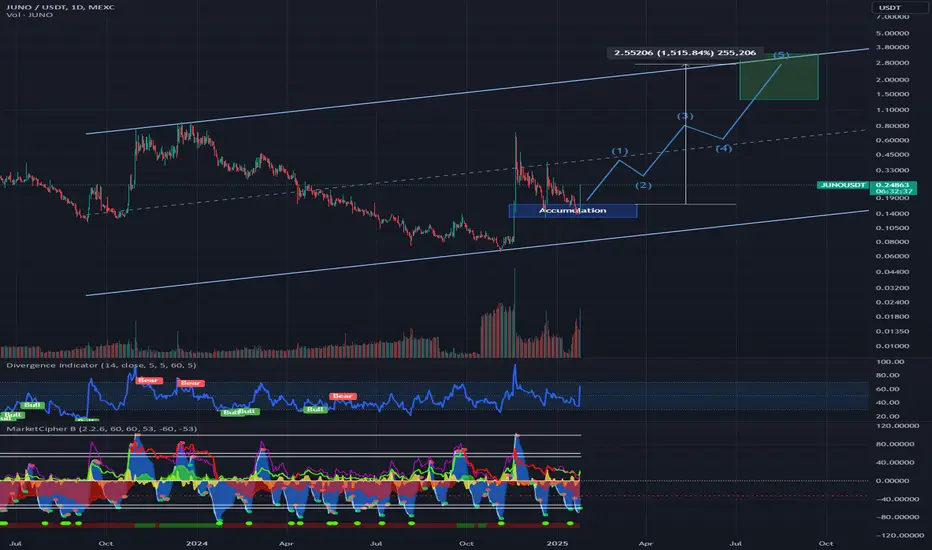
#11 Juno Network - best characterized as a Smart Contract Platform and Juno Ecosystem project.
… to be continued so remember to follow!
💬 What is your top picks for this altseason?
This is not financial advice. Always do your own research before investing.

AgentLayer - Low Cap Gem #13Altseason is upon us, and now is the time to start dollar-cost averaging into your favorite crypto gems. One of our picks for this altseason is AgentLayer - best characterized as an Artificial Intelligence and AI Agents project.
🚀 Why?
Our altcoin picks are based on the following criteria:
High growth potential : Projects with room for exponential gains.
Undervalued : Market cap still flying under the radar.
Limited CEX listings (for now) : Undiscovered gems poised for exposure.
Community-driven momentum : A strong, dedicated community pushing adoption.
High risk, high reward : A speculative but calculated play.
Partnerships and roadmap promises : Indicators of future expansion and relevance.
Potential for major exchange listings : A game-changer that could drive price action.
Circulating Supply Ratio : A circulating supply close to 100%, indicating robust tokenomics and minimizing dilution risk.
🌊 Prerequisites for Thrill and Euphoria
For low-cap altcoins to thrive, specific market conditions need to align. Here's what we're assuming:
Bitcoin follows the 4-year cycle: Maintaining historical trends of market phases.
We remain in a crypto bull market: A rising tide lifts all boats.
Altseason begins: A period of intense growth and volatility for altcoins.
Retail money floods in: Increasing mainstream interest and participation.
Global markets are "healthy-ish": No major economic black swans.
Monetary policy shifts to QE (quantitative easing): A return to liquidity-friendly environments.
💬 What is your top picks for this altseason?
This is not financial advice. Always do your own research before investing.

UFO Gaming - Low Cap Gem #12Altseason is upon us, and now is the time to start dollar-cost averaging into your favorite crypto gems. One of our picks for this altseason is UFO Gaming - best characterized as a GameFi project.
🚀 Why?
Our altcoin picks are based on the following criteria:
High growth potential : Projects with room for exponential gains.
Undervalued : Market cap still flying under the radar.
Limited CEX listings (for now) : Undiscovered gems poised for exposure.
Community-driven momentum : A strong, dedicated community pushing adoption.
High risk, high reward : A speculative but calculated play.
Partnerships and roadmap promises : Indicators of future expansion and relevance.
Potential for major exchange listings : A game-changer that could drive price action.
Circulating Supply Ratio : A circulating supply close to 100%, indicating robust tokenomics and minimizing dilution risk.
🌊 Prerequisites for Thrill and Euphoria
For low-cap altcoins to thrive, specific market conditions need to align. Here's what we're assuming:
Bitcoin follows the 4-year cycle: Maintaining historical trends of market phases.
We remain in a crypto bull market: A rising tide lifts all boats.
Altseason begins: A period of intense growth and volatility for altcoins.
Retail money floods in: Increasing mainstream interest and participation.
Global markets are "healthy-ish": No major economic black swans.
Monetary policy shifts to QE (quantitative easing): A return to liquidity-friendly environments.
💬 What is your top picks for this altseason?
This is not financial advice. Always do your own research before investing.

Ethereum Dominance and the Case for a Massive RallyEthereum’s market dominance chart has a fascinating story to tell – one that echoes the past and gives us reasons to anticipate a bright future.
Historical Context
In 2021, Ethereum found itself in a similar position as it does today. The dominance reached this exact support zone, a level that historically marks the beginning of significant movements. From this area, Ethereum’s price surged by over 250%, initiating one of the most remarkable rallies in its history.
Fast forward to 2025 – Ethereum dominance is now revisiting this same critical support level, a zone between 11.09% and 11.39%. Historically, this area has acted as a springboard, pushing ETH dominance and price into substantial uptrends.
Why This Matters
Historical Patterns: The same setup led to a massive price rally in 2021. While history doesn’t always repeat, it often rhymes.
Market Momentum: Ethereum’s dominance reflects its share of the crypto market. A bounce here could indicate capital rotation into ETH, setting the stage for an ETH-led altcoin rally.
Strong Fundamentals: Ethereum’s continued development and adoption create a solid foundation for future growth, which could amplify any technical bounce.
Key Questions
Will Ethereum dominance bounce from this critical level, as it has before?
Could this signal a broader ETH bull run, mirroring the 2021 rally?
Watch the Chart
Keep a close eye on this Ethereum Dominance chart. Dominance represents the percentage of the total crypto market cap held by Ethereum, and this level has historically been a reliable indicator of major moves.
Conclusion
The stars seem to be aligning for Ethereum. If dominance bounces here, we could see a replay of the explosive growth of 2021. Are you prepared for what might come next?

GBP/JPY - WEEKLY OULOOKThis chart into super easy to breakdown so it'll require higher understanding of Liquidity and unmitigated areas.
Starting in high TF Price is Bullish, many people will disagree with that statement but we didn't break the recent swing low there for we are still Bullish. On the Higher TF we are also just pushing out of the Daily TF as of previous candle before market closure. This Higher TF consolidation phase we are currently in has been pushed of the previous HTF Mitigation Block followed by a slightly smaller Mitigation Block which then had a Bullish move. Above this Consolidation we can notice there is a Higher TF Imbalance which is acting currently as resistance. As we know is Resistance levels the more those levels are touched the more chances we have of a possible break through towards a BOS. Finally we can notice on the Higher TF that we have had a valid liquidity grab suggesting the Bearish Pullback has finished.
On the smaller TF we can now notice that price is infact Bullish once again. We have a market out level for the smaller TF Fib for discount zones. Aiming to fill that previous sell side Imbalance we have our Entry at the beginning wick of the Mitigation Block.
Good Luck to all the traders that follow

Juno Network - Low Cap Gem #11Altseason is upon us, and now is the time to start dollar-cost averaging into your favorite crypto gems. One of our picks for this altseason is Juno Network - best characterized as a Smart Contract Platform and Juno Ecosystem project.
🚀 Why?
Our altcoin picks are based on the following criteria:
High growth potential : Projects with room for exponential gains.
Undervalued : Market cap still flying under the radar.
Limited CEX listings (for now) : Undiscovered gems poised for exposure.
Community-driven momentum : A strong, dedicated community pushing adoption.
High risk, high reward : A speculative but calculated play.
Partnerships and roadmap promises : Indicators of future expansion and relevance.
Potential for major exchange listings : A game-changer that could drive price action.
Circulating Supply Ratio : A circulating supply close to 100%, indicating robust tokenomics and minimizing dilution risk.
🌊 Prerequisites for Thrill and Euphoria
For low-cap altcoins to thrive, specific market conditions need to align. Here's what we're assuming:
Bitcoin follows the 4-year cycle: Maintaining historical trends of market phases.
We remain in a crypto bull market: A rising tide lifts all boats.
Altseason begins: A period of intense growth and volatility for altcoins.
Retail money floods in: Increasing mainstream interest and participation.
Global markets are "healthy-ish": No major economic black swans.
Monetary policy shifts to QE (quantitative easing): A return to liquidity-friendly environments.
💬 What is your top picks for this altseason?
This is not financial advice. Always do your own research before investing.
AIT Protocol - Low Cap Gem #10Altseason is upon us, and now is the time to start dollar-cost averaging into your favorite crypto gems. One of our picks for this altseason is AIT Protocol - best characterized as a Artificial Intelligence project.
🚀 Why?
Our altcoin picks are based on the following criteria:
High growth potential : Projects with room for exponential gains.
Undervalued : Market cap still flying under the radar.
Limited CEX listings (for now) : Undiscovered gems poised for exposure.
Community-driven momentum : A strong, dedicated community pushing adoption.
High risk, high reward : A speculative but calculated play.
Partnerships and roadmap promises : Indicators of future expansion and relevance.
Potential for major exchange listings : A game-changer that could drive price action.
Circulating Supply Ratio : A circulating supply close to 100%, indicating robust tokenomics and minimizing dilution risk.
🌊 Prerequisites for Thrill and Euphoria
For low-cap altcoins to thrive, specific market conditions need to align. Here's what we're assuming:
Bitcoin follows the 4-year cycle: Maintaining historical trends of market phases.
We remain in a crypto bull market: A rising tide lifts all boats.
Altseason begins: A period of intense growth and volatility for altcoins.
Retail money floods in: Increasing mainstream interest and participation.
Global markets are "healthy-ish": No major economic black swans.
Monetary policy shifts to QE (quantitative easing): A return to liquidity-friendly environments.
💬 What is your top picks for this altseason?
This is not financial advice. Always do your own research before investing.

Hannover Rück / HNR1 / Symmetry and SeasonalityI am looking at that Chart again because i bought this stock on 14.10.2024.
Not the best trade so far, - but since this company give good dividents and can in my View seen as a value investment I dont give too much about the short term result and I am not worried.
On the chart I drew an arrow for the first strong move and copied tat arrow to start again from the low of the correction we are in right now. A 2nd dotted arrow I drew from the same starting point of observation to the highest point in the correction and again copied that arrow to project a price target for a potential next upmove.
Together with some fibonacci / percentages I marked a target area....
Seasonality analysis suggests that this move should come soon and then could (like the first strong upmove) reach a somewhat 10% gain for me (entered at 260 euro per share).
Maybe this makes sense for you ? Leave a comment and/or like.
Hope it helps to find a profitable entry in a good trade...
Cheers!

enqAI - Low Cap Gem #9Altseason is upon us, and now is the time to start dollar-cost averaging into your favorite crypto gems. One of our picks for this altseason is enqAI - best characterized as an Artificial Intelligence project.
🚀 Why?
Our altcoin picks are based on the following criteria:
High growth potential : Projects with room for exponential gains.
Undervalued : Market cap still flying under the radar.
Limited CEX listings (for now) : Undiscovered gems poised for exposure.
Community-driven momentum : A strong, dedicated community pushing adoption.
High risk, high reward : A speculative but calculated play.
Partnerships and roadmap promises : Indicators of future expansion and relevance.
Potential for major exchange listings : A game-changer that could drive price action.
Circulating Supply Ratio : A circulating supply close to 100%, indicating robust tokenomics and minimizing dilution risk.
🌊 Prerequisites for Thrill and Euphoria
For low-cap altcoins to thrive, specific market conditions need to align. Here's what we're assuming:
Bitcoin follows the 4-year cycle: Maintaining historical trends of market phases.
We remain in a crypto bull market: A rising tide lifts all boats.
Altseason begins: A period of intense growth and volatility for altcoins.
Retail money floods in: Increasing mainstream interest and participation.
Global markets are "healthy-ish": No major economic black swans.
Monetary policy shifts to QE (quantitative easing): A return to liquidity-friendly environments.
💬 What is your top picks for this altseason?
This is not financial advice. Always do your own research before investing.

LightLink - Low Cap Gem #8Altseason is upon us, and now is the time to start dollar-cost averaging into your favorite crypto gems. One of our picks for this altseason is LightLink - best characterized as a Infrastructure, Smart Contract Platform and Layer 2 project.
🚀 Why?
Our altcoin picks are based on the following criteria:
High growth potential : Projects with room for exponential gains.
Undervalued : Market cap still flying under the radar.
Limited CEX listings (for now) : Undiscovered gems poised for exposure.
Community-driven momentum : A strong, dedicated community pushing adoption.
High risk, high reward : A speculative but calculated play.
Partnerships and roadmap promises : Indicators of future expansion and relevance.
Potential for major exchange listings : A game-changer that could drive price action.
Circulating Supply Ratio : A circulating supply close to 100%, indicating robust tokenomics and minimizing dilution risk.
🌊 Prerequisites for Thrill and Euphoria
For low-cap altcoins to thrive, specific market conditions need to align. Here's what we're assuming:
Bitcoin follows the 4-year cycle: Maintaining historical trends of market phases.
We remain in a crypto bull market: A rising tide lifts all boats.
Altseason begins: A period of intense growth and volatility for altcoins.
Retail money floods in: Increasing mainstream interest and participation.
Global markets are "healthy-ish": No major economic black swans.
Monetary policy shifts to QE (quantitative easing): A return to liquidity-friendly environments.
💬 What is your top picks for this altseason?
This is not financial advice. Always do your own research before investing.

Speed Breakers on the Road to WealthInvesting in equity markets can often feel like navigating a road trip with speed bumps—periods of market correction or consolidation that test investors' patience.
The journey of the Nifty 50 from 2011 to 2025 provides a clear narrative:
2011-2013: After a downturn, the Nifty 50 consolidated, hovering around 4,500. This period was marked by resilience in sectors like IT and Pharma, which contributed to market stability.
2014-2016: Global economic uncertainties led to another correction. However, recovery in sectors like Banking and Finance helped push the index upward once more.
2019-2020: This period was volatile, with a significant drop due to the global health crisis. Yet, sectors like Healthcare and Technology not only recovered but thrived, pushing the Nifty 50 towards recovery.
2024-2025: The current correction might seem sharp, but with the Nifty 50 having reached a peak of about 26,200 in 2024, it reflects the market's cyclical nature. Sectors like IT , Renewable Energy and Consumer Goods , Defence, Railway, Consumer Discretionary have been key in maintaining market buoyancy.
From 4,500 in 2011 to 26,200 in 2024.... the Nifty 50 has shown significant growth, demonstrating wealth creation for long-term investors.
Key Insights:
Volatility as Opportunity: Corrections often precede growth phases, offering buying opportunities at lower valuations.
Patience Pays Off: Long-term investment through market downturns has historically led to substantial returns.
Equities for Wealth: Over time, equities have proven to be a superior asset class for wealth accumulation.
Sectoral Influence: Each market phase has been influenced by different sectors, showcasing the dynamic nature of market recovery and growth.
The current market situation is a reminder that these 'speed bumps' are integral to the journey towards wealth creation, not roadblocks.

Gold and Silver Are Gearing Up For Higher PricesKicking off my 2025 posts with a positive outlook on Silver and Gold prices! 😊
Over the past three months, I’ve highlighted the "Nice areas" that have held prices well for both gold and silver. Hopefully, you’ve found those levels useful so far.
So, what’s next? 🤷🏻
In this post, I’ll focus more on technical analysis.
If gold closes above $2,740 this week, I’d expect its movement to follow the orange line I’ve drawn on the chart. My target is $2,850 to $2,900, which I hope to see reached within the next three months. However, I’d also like to see a brief revisit to the area below $2,700 before that move.
For silver, I’m looking for a strong close above $32.30. Only if that happens, I’d view any corrections as a great opportunity to add to my position, targeting $36. Ideally, I’d love to see this happen by the first week of March.
Note: Never try to time the market. The timeframes I mention are based on the seasonality patterns of Gold and Silver and don’t hold significant weight in my analysis.

Weakening USD $DXY after the Trump Inauguration? In the last Trump administration, the USD TVC:DXY declined in 2017 post-inauguration
I believe history could repeat itself, potentially boosting risk assets in 2025 like crypto and AMEX:IWM
Between the 2024 election and the 2025 inauguration, the USD strengthened, mirroring the 2016/2017 period, supporting this thesis

target reached I analyzed this trade during the weekend following how price moved previous week intermarket analysis gives broad idea of the pair you trading , its easy to show fter effect but it is always nice to see it beforehand now how do you take advantage ? wait wait wait patience and risk management is next your bias is correct now the real part begins patience and proper risk management mondays are not my trading days but now target reached it has given me a hint of what it can possibly do #remember it is a industry of probabilities

Buy When Others Sell, Sell When Others Buy – Time to Reflect.The current market sentiment is overwhelmingly bullish. The anticipation surrounding Trump’s inauguration and the potential for pro-crypto regulations has created massive optimism for continued upside. But isn’t this the perfect time to ask – is now a good moment to lock in some profits?
On the chart, I’m showcasing two of my custom indicators: PrimeMomentum Long Term Signal BTC and Weekly Peak Finder. Both indicators are based on long-term analysis and have historically been extremely reliable at identifying key market turning points.
Current Situation
🔸 Both indicators have flashed simultaneously. Historically, such occurrences are rare and have consistently signaled significant downward movements.
🔸 Historical correction analysis:
For Weekly Peak Finder, after a bearish signal:
- The first correction resulted in a 25% drop.
- The second correction saw a 65% drop.
- Now, with both indicators flashing together, the market has only dropped by around 5%. This is the smallest correction in history following such combined signals. Is this really it, or is the market preparing for a larger move downward?
Can we assume this time is different and the correction is over? Or is the current euphoria and optimism masking a potential larger drop?
My Decision
Considering the historical reliability of these indicators and the fact that both are flashing simultaneously, I’ve decided to lock in 50% of my BTC position. This approach allows me to secure profits while still leaving room for potential further upside.
Is the market gearing up for a historic rally, or is this the perfect setup for a deeper correction? I’d love to hear your thoughts – what’s your take on this setup?


Dollar for the Week of 13 JanuaryBearish Dollar because it hit already the W OB and it's inside the W SIBI, so it take also a liquidity from second January's high.
We can wait a retracement lower for Dollar, it means all major pairs can be higher.

NzdUsd could rise to 0.58 (swing trade)The final quarter of 2024 was particularly challenging for the NZD, with the currency declining by 800 pips from its peak to its lowest point. More significantly, this drop represents a devaluation of over 12%, which is substantial for a major currency pair.
As 2025 begins, however, OANDA:NZDUSD has entered a consolidation phase, holding above the critical support zone near 0.5550. This level is noteworthy and deserves attention as a potential turning point.
While the overall trend remains bearish, a rebound from this key support area is likely. If this occurs, the pair could move higher toward the 0.58 resistance level.
In summary, dips near the support zone present buying opportunities with a favorable risk-to-reward ratio, targeting a return of at least 1:2.

EUR USD - the battle of parityG'day traders,
Welcome back to a new trading year.
First up, i'll be taking a look at the EURO/USD as it is still in a strong downward to the right pattern respecting the strong curve of the weekly trendline.
Please see below the Daily and weekly charts marked up.
Follow along the video and hope it assists with your trading.
I'll be looking for sells upon daily closes, weekly set and forget supply limits. Demand limits.
Master Key for zones
Red = Three Month
Blue = Monthly
Purple = weekly
Pink = Consolidative box example (Daily)
Orange = Daily
Risk Warning
Trading leveraged products such as Forex, commodities and CFDs, carries with it a high level of risk and so may not be suitable for every investor. Prior to trading the foreign exchange, commodity or CFD market, consider your investment objectives, level of experience and risk appetite. You should never risk more than you can afford to lose. If you fail to understand or are uncertain of the risks involved, please seek independent advice and remember to conduct due diligence as criteria varies to suit the individual.
Below are some of the take aways from the video - please listen again incase any detail is missed.
Previous charts
Daily Chart
Weekly Chart
Updated in line with the video:
Daily
Weekly
Do you enjoy the setups?
Professional analyst with 8+ years experience in the capital markets
Focus on technical output not fundamentals
Focus on investing for long term positional moves
Provide updates where necessary - with new updated ideas tracking the progress.
If you like the idea, please leave a like or comment.
To all the followers, thank you for your continued support.
LVPA
MMXXV

2025 Bull Market TargetWe've still got plenty of room to run in this cycle's bull market. From this indicator we see room for a potential 180-200k peak this cycle.
