Short Idea on DXYBased on :
- Investors surprised by the cpi new and seeking safety in bonds (ZB1!) making dollar go down
- break out of an important support level
- 2 supply zones
Seasonality

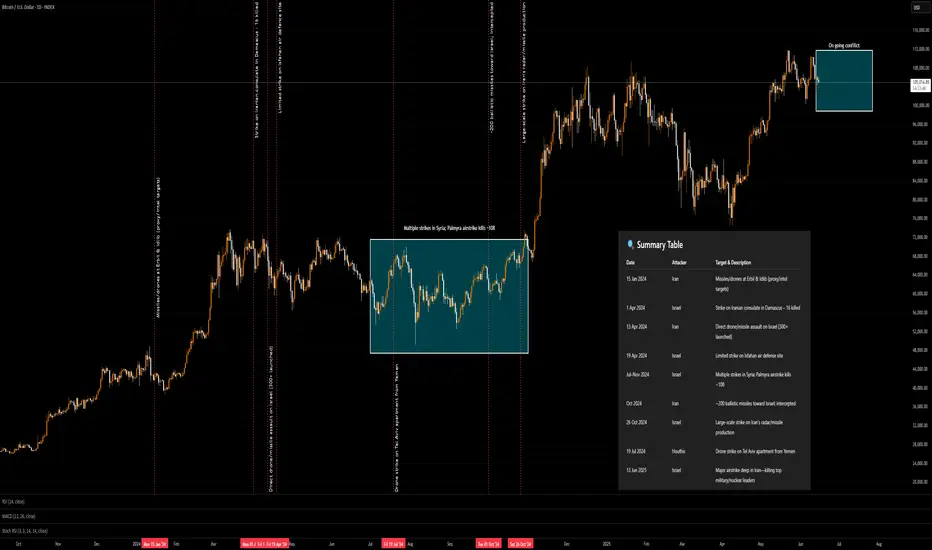
BTC Weekly ChartJust consolidating around ATHs at this point.
Its bound to see a huge move either way eventually.

Long trade
15min ~ TF
🟢 ETHUSDT – Buyside Trade
Date: Saturday, 14th June 2025
Session: Asia Session AM
Time: 8:30 AM
Entry Timeframe: Intraday (short-term confirmation)
Trade Parameters
Entry: 2518.88
Take Profit: 2554.89 (+1.43%)
Stop Loss: 2515.56 (−0.13%)
Risk-Reward Ratio (RR): 10.85
🧠 Trade Reasoning
This entry was taken after ETHUSDT displayed strong bullish intent early in the Asia session, with price forming a liquidity sweep below local lows, quickly followed by a reversal candle and bullish order block on the lower timeframes.

Major Conflict (Isreal - Middleeast and Iran) on CryptoAs you can see crypto is doing its own and what general markets are doing in general. I applied the dates thanks to ChatGPT to make a summary table. you can see these issues over the past two years did not make a huge impact.
The only problem is Iran's response might not be as short as the last time. therefore I am guessing a range of timeframe rather than a vertical line.
Remember any higher escalation will lead the risky assets to dump and off-risk assets rise, such as Oil and Gold.
Usually Summer time is not very profitable for crypto and as I stated in my last Youtube video I am expecting boring price action in June 2025.
This chart can clearly shows, as long as it not become a major international issue and world wide panic, such as 2019 and 2008 it would be scary moments for few weeks at top
Safe-Haven Demand Boosts Gold as Middle East Tensions EscalateHey Traders,
In today’s trading session, we are monitoring XAUUSD for a buying opportunity around the 3,380 zone. Gold is currently trading in an uptrend and is experiencing a correction phase as it pulls back toward this key support and resistance area.
On the fundamental side, reports indicate that Israel struck Iran overnight — fueling a classic geopolitical risk-off sentiment. This escalation is driving strength in safe-haven assets while putting pressure on riskier markets. Gold typically benefits from this kind of uncertainty, adding further weight to the technical setup we’re seeing today.
Trade safe,
Joe

BTCETH parabolic run pointing towards 100:1Historically, during bull markets, Ethereum frequently surpassed Bitcoin at various moments.
However, this time around, that trend has not materialised, leading to a decline in investor confidence.
With capital exiting the ETH market, sentiment has soured, and critical indicators are revealing significant losses.
Unless a robust bullish turnaround occurs, Ethereum's struggle may persist, as the market currently favors Bitcoin as the more secure option.
However once this parabola breaks, we could see a strong snap back reaction in favour of the more riskier #ALTS, #DEFI and #MEMES as #ETH is still the home for stablecoin issuance and still the most trusted secure smart contract blockchain available.

Global M2 Money SupplyWith more money than ever before in circulation available. Asset prices should go up..
Do you agree or disagree?


$BTC Extremely Bullish Daily Close - Parabola Underway?Hawt diggity dayumm 🥵
CRYPTOCAP:BTC really going for it following my original idea behind the parabola formation 🤯
Reclaiming ATH high at $112k will confirm the move 🤞


SPX - way to ATH in June SPX with a gap just below last season, having all its SMAs aligned and head funds heavily short, I am sure we are on our way to new ATHs. A little shake out to find support on sma50 could be expected, but for now the strategy would be BTD! - no financial advice.

SUPER Showing Same Cycle Structure as Last 2 RalliesSuperVerse is forming the exact same base structure that preceded its last two explosive rallies — both of which yielded 400%+ and 1800%+ moves within a few months.
We’re currently trading in the $0.61–$0.67 range — right where historical expansion phases have begun. Volume is drying up, EMA ribbons are compressing, and the chart is coiling just above proven structural support. This is typically the point where patient entries see the most asymmetric upside.
Stop placement is clear ($0.55 or $0.49 depending on risk appetite), and the first leg up targets $0.90. Beyond that, $1.30 and $2.00 line up with past cycle symmetry.
If $0.75 breaks clean, this setup activates fully. I’ll be watching volume closely for confirmation. Until then, I’m accumulating with tight risk and clear conviction.
Drop your thoughts below — do you see the same pattern repeating?

USDJPY Potential DownsidesHey Traders, in today's trading session we are monitoring USDJPY for a selling opportunity around 143.200 zone, USDJPY is trading in a downtrend and currently is in a correction phase in which it is approaching the trend at 143.200 support and resistance area.
Trade safe, Joe.

Can JTO pull a BNB All-Time-High Move??BNB made a similar pattern that led to it's previous ATH.
Since we are still waiting on the new ETH a time highs, followed by altseason, we can expect to see altcoins beginning to increase when ETH trades sideways. More on that here :
We can also expect to see rallies across other altcoins:
and
But before we see a glorious altseason, ETH needs to start moving to the upside as a starting point.
_______________
BINANCE:JTOUSDT
BINANCE:BNBUSDT

AMSC | Bullish Momentum Building Breakout in Progress?📈 NASDAQ:AMSC 🚀
American Superconductor (AMSC) is quietly showing strength, and it's time to pay attention. After bouncing off the support zone near $18.80–$19.30, the stock has reclaimed the $20.50–$21.10 entry range, with volume picking up as it challenges key resistance.
🧠 Why it's interesting now:
✅ 56% YoY revenue growth last quarter 📊
✅ LSE:80M in cash, no urgent need for dilution
✅ Clean energy + grid modernization = tailwind
🧩 Technical Setup:
✅ Entry Zone:
$Market price
$19.5-20.5
$18.5
✅ Breakout Trigger: $22.38
🎯 Target 1: $23.50
🎯 Target 2: $25.70
🎯 Stretch Target: $28.00 +
This is a high-beta, high-volatility name — perfect for swing traders who can manage risk. Watch that breakout above $22.38; it could open the door to a fast move toward mid-$20s.
📌 Disclaimer: This is not financial advice. Do your own research before making any trading decisions. I'm not a financial advisor.

ETH/BTC Breakout Alert – Are Altcoins About to Explode?Ethereum just bounced from a multi-year support zone and is testing a critical resistance after breaking out of a falling wedge on the weekly chart!
If ETH/BTC breaks above 0.029, altcoins may finally outperform Bitcoin and start the long-awaited altseason.
📊 Key levels to watch:
Resistance 1: 0.02979
Resistance 2: 0.03740
Strong Pivot: 0.05165
Macro Resistance: 0.07797
🧠 TradeWithMky says:
"When ETH flips BTC, altcoins roar louder!"
🔥 Stay ready for the altcoin wave!
#Ethereum #Altseason #CryptoTrading #ETHBTC #TradeWithMky #Altcoins #Bitcoin #CryptoAnalysis

ETH/BTC – The Calm Before the Altseason Storm? 🟢 ETH/BTC is knocking on the door of a major resistance after a brutal year-long downtrend. This chart isn't about hopium — it's about momentum shifting.
🧱 If the 0.025 resistance is broken and flipped into support, it could mark the **official beginning of Altseason 2025**.
🔎 Zoom out and see the context: every time ETH/BTC breaks out of a downtrend like this, **capital rotates massively into altcoins**.
📣 Question to the community:
🔥 Do you believe this is THE breakout that starts the flood?
💭 Which alts are you stacking before the rotation?
🧵 Drop your top 3 altcoin picks in the comments – let’s build a serious alpha thread below!
#Altseason #ETHBTC #CryptoRotation #Ethereum #Bitcoin #CryptoAnalysis #Altcoins #ChartBreakout #TradeWithMky
🧠 Chart Context:
Ethereum has been bleeding against Bitcoin for over a year, forming a steep downtrend channel. But something’s changed — for the first time in months, ETH/BTC has shown signs of reversal with a strong breakout attempt near a key resistance zone.
📈 Key Levels:
🔺 Resistance #1 – 0.02979: Minor resistance, but historical importance.
🔺 Resistance #2 – 0.03740: Major pivot during past altseasons.
🔺 Resistance #3 – 0.05970: Classic ETH outperformance territory.
🧱 Current resistance ~0.025: THIS is the line in the sand — Altseason won't truly start until we flip this level to support.
📊 Insights:
Price has bounced off the bottom of a well-defined descending channel.
We're testing the midline resistance — a breakout here could signal a major rotation from BTC to ALTs.
Volume surge + daily momentum is turning up for the first time in months.
🚀 Narrative:
"Altseason starts not when ETH pumps in USD, but when ETH outperforms BTC. And that's exactly what this chart is whispering…"

BTC.D top is inIt’s the phenomena of the so called alt season.
Alt coin make massive rallies, extending their waves beyond any rules, all thanks to the btc.d collapse. This will be 3 to 6 months long and the effect will be stronger below 50%.

HUGE INCREASES Possible on PYT | Here's WhyPython is a fairly new altcoin with big upside.
From the earlier two charts on the left, we see that initial downturns shouldn't be feared. Historically, SOL and SUI started with downtrends and transitioned into massive upside alts.
Python might especially see parabolic increases, once ETH starts to move towards a new ATH. This will be due to the rotation of liquidity between altcoins in terms of larger and smaller market caps.
Don't miss yesterdays update on ETH!
____________________________
BINANCE:SOLUSDT
COINBASE:SUIUSD
BINANCE:PYTHUSDT

DOT has HUGE UPSIDE Potential | PolkadotPolkadot could be a late bloomer this season, but there's still much room for growth on this altcoin.
Taking a look at DOT from a macro timeframe, we clearly see the bearish cycle after the ATH, and then a bottom out when we start to see the price making higher lows.
This undoubtedly shows us that Polkadot IS CURRENTLY bullish - even though we're not seeing the big increases just yet. After a retest here in the pointed out area, it's likely DOT can run. DOT and other alts will likely retrace as ETH gears up and starts increasing, before they get their turn to run:
It should be noted that DOT is trading over 1000% away from its previous ATH. And even though that may be a stretch, I'd be happy with a 100%!
Don't miss the SOLANA update with a trade setup 🎁 :
____________________
BINANCE:DOTUSDT

Total3 Crypto Market CapWe know very well that Trump, at the moment, is able to move markets overnight. We also know well that such a market is difficult to navigate.
Nevertheless, we do have chart indications, as in this case:
- volatility, money inflow and others are in the middle.
- on the weekly, Total3 has bounced from the underlying structure, which may signify strength.
- the candle resting on the weekly FVG will be closed later.
- the indicators look good but not too good. Based on some altcoins (weekly), I see hope there.
- gray and delicate situation.
- best strategy: scalp, small profits, buy the dip and hold. Little or no leverage. Don't get hurt.
I will update to keep you posted on developments.

BTC Similar move?BINANCE:BTCUSDT
In weekly timeframe i see the similar move?
What you say?
Big short or ...

Bitcoin (BTC/USD) – 1D Outlook🚀 New All-Time High
BTC just printed a fresh ATH, breaking above the previous 109-110K resistance. Price discovery is now fully active support/resistance levels are harder to define clearly in this zone.
📏 Fibonacci Extension Zone
Using the Fibonacci extension of the previous major leg, we get a first realistic target around 130K, slightly front-running the 1.618 level a common zone for major profit-taking.
📌 Things to Monitor
While momentum remains strong, macro risks still hover :
Global recession fears
Geopolitical tensions
CPI / FOMC surprises
Any of those could trigger a risk-off environment, stalling the BTC rally or triggering a sharper correction.
🎯 What’s next?
As long as the trend holds above 103-105K (former structure highs), bulls remain firmly in control. A move to 130K isn’t out of reach but stay reactive to macro shocks that could cool down the rally.
