Ethereum’s Hidden Bullish Trap: A Technical Breakout to $15K Hello Traders 🐺
ETH — the biggest crypto out there after BTC itself...
You already know my personal opinion on it. However, I really need to talk about it once again to update you, my dear audience, and share the facts that are sleeping on the chart.
As you can clearly see, we had a massive shakeout during the Black Monday, which now seems to be turning into one of the rarest patterns — and one of the most powerful bear traps — I’ve ever seen for ETH.
You know why? Let me break it down for you:
Usually, after Phase 1 during a bull market, ETH starts to show strength against BTC — which is quite normal, as it marks the beginning of the Altcoin Season. ETH, being the leader, attracts most of the capital.
But before Phase 2 (ETH Season) kicks off, ETH often consolidates and starts to accumulate in a bullish pattern. In this case, we have a bullish triangle pattern with a wick below the support line — a classic bear trap — which makes it even more bullish to me.
If ETH can break above the current ATH (~$4700) and push through the key resistance line, we could witness a massive run-up to new highs, in my opinion somewhere between FWB:12K to $15K 🚀
I hope you enjoyed this idea — and as always, don’t forget our golden rule:
🐺 Discipline is rarely enjoyable, but almost always profitable. 🐺
🐺 KIU_COIN 🐺
Seasonality

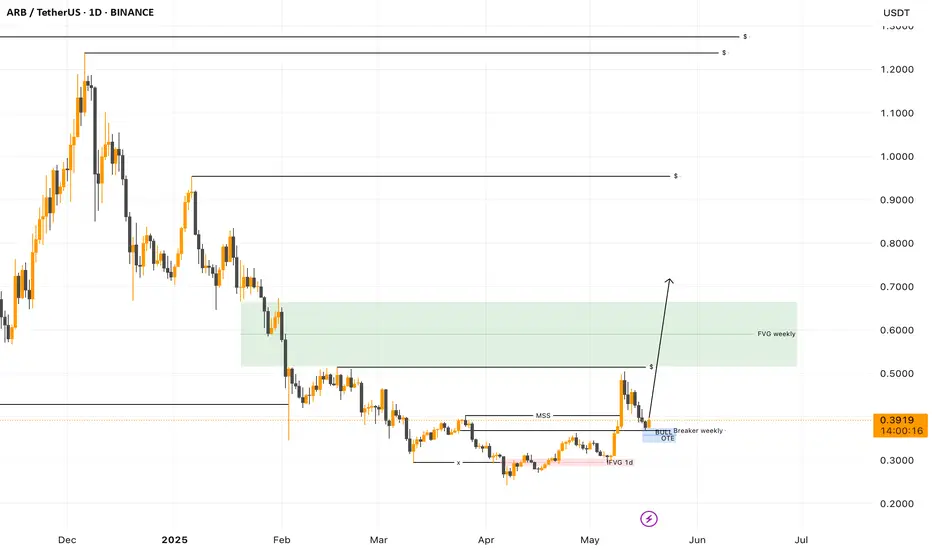
Technical analysis of ARB (1D)1. Market Structure
Since December 2024, ARB has been in a clear downtrend with a series of lower highs and lower lows.
However, a Market Structure Shift (MSS) recently occurred, signaling a potential shift in momentum. This structural break is an early sign of a possible reversal.
The price formed a small accumulation range between March and late April, followed by a strong breakout to the upside, confirming bullish intent.
🧲 2. Key Zone: BULL OTE + Weekly Breaker Confluence
The price has pulled back to a high-confluence zone around $0.35–$0.37, combining :
A Weekly Breaker Block, former resistance turned support
The bullish OTE zone (Optimal Trade Entry)
A small daily Fair Value Gap (FVG 1D) in discount area that has been filled
This triple confluence strongly supports the idea of a clean retest after breakout and before further continuation.
🎯 3. Price Targets & Scenario
🟩 If the bullish continuation holds, the next key upside targets are :
- $0.50–$0.65 : Weekly FVG zone to be filled + first major inefficiency area
- $1.10–$1.20 : Key structural resistance + previous range high
A breakout beyond those levels could eventually pave the way toward $1.70, although that remains a longer-term scenario.
🧠 4. Behavioral Insight
This type of setup ; accumulation + MSS + OTE/Breaker retest, is classic for the early stages of bullish trends.
The fact that price is holding cleanly above the breaker shows buyers are stepping in with strength. Sellers are being absorbed.
✅ Conclusion
ARB appears to have confirmed a trend reversal, backed by :
✅ A strong bullish impulse and structural shift (MSS)
✅ Clean rejection off a high-confluence reaccumulation zone
✅ Clear structural upside target near $0.65
📌 As long as $0.35 holds, the bullish momentum remains intact, and every pullback could be considered a reloading opportunity.
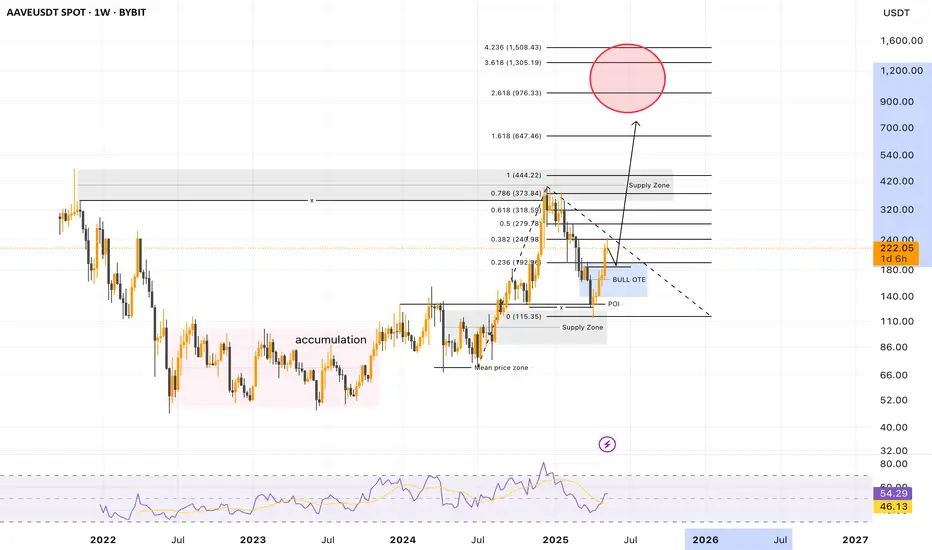
AAVE Technical Analysis (1W)
🧱 1. Market Structure
Between mid‑2022 and late-2023, AAVE moved within a prolonged accumulation phase, typical of a cycle bottom with extended compression.
This phase allowed the price to build a solid base before launching a first bullish leg, which topped out at the range high in early 2024.
At that point, the price compressed again near the equilibrium (mean price zone) of the previous range before initiating a clear distribution phase (April → December 2024).
At the top, AAVE met strong resistance within a major supply zone, without printing a new ATH a healthy sign for mid-term market structure.
Price then started a controlled correction, retracing 100% of the OTE zone from the distribution move (from equilibrium to supply).
The bounce occurred right on a key breaker block, which had already reacted to the equilibrium level prior to the first impulse.
From that local bottom, momentum has resumed, suggesting that the second phase of the distribution cycle may be underway.
🧲 2. Key Reload Zone
AAVE has recently revisited its BULL OTE zone, aligning perfectly with :
- A precise POI (Point of Interest)
- The breaker block
🟢 This kind of clean reaction from a high-confluence reaccumulation zone supports the idea of a structurally sound bounce and the beginning of a new bullish push.
🎯 3. Technical Targets & Scenario
If this bounce holds, here are the next technical targets :
🔁 Reclaim the supply zone between $340–$460
🚀 If this area breaks with volume, the market could aim for new highs around $700–$1,100
Such a move would confirm a second bullish leg of the macro cycle, with higher breakout potential.
🧠 4. Behavioral Insight
The weekly RSI shows signs of recovery after a long compression, momentum is awakening.
The Accumulation → Expansion → OTE Retest → Continuation structure is textbook for the early stages of a major bull cycle.
👉 Price action around the $340–$460 supply zone will set the tone for what comes next.
✅ Conclusion
AAVE is currently displaying a clean, cyclical structure, ideal for swing traders and mid-term investors :
🔁 Accumulation → Expansion → Retest → Reaccumulation → 🚀
🧨 AAVE may be on the verge of kicking off a new explosive bull cycle.
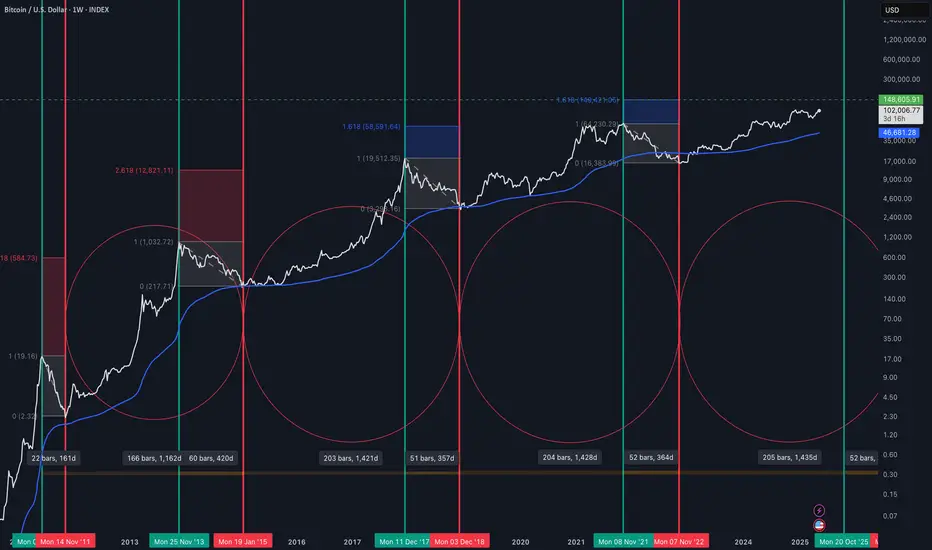
Bitcoin SeasonalitySince 2013, the distance between each Bitcoin bottom and peak is approximately 205 weeks. Similarly, the distance between the peak and the bottom is approximately 52 weeks. In addition, when the Fibonacci correction is applied to each bear season, the new target appears to be the 1.618 region, so Bitcoin currently has the potential to run to 148k. As long as seasonality continues, the peak will come at the end of 2025.
BTC pattern this cycle SUPEERCLEEANSudden spikes in prices whenall crow bored and then a large and long bleeding with colateral corrections, looks that the pattern this cycle will be in that format, with the resistance in 150k,200k,240k, with the maximum top at 256k, the sell zone would be at 230k and shorting after 250k

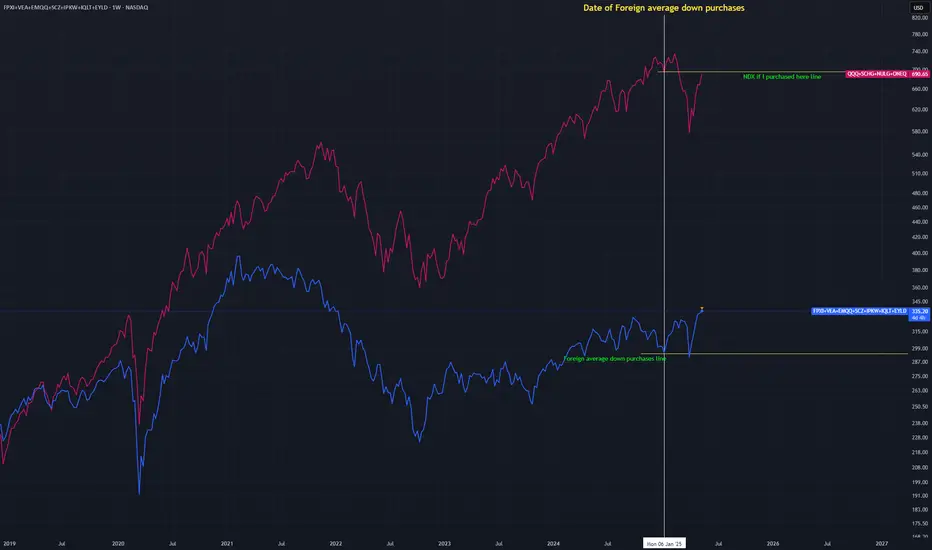
NDX Index Funds Vs Foreign NDX funds performance post rotationThis nothing but an idea I am publishing to track my performance for rotating profits in NDX funds into averaging down foreign funds in a retirement portfolio. I want to point out had taken profits previously and was trading bitcoin and GME with them until i found a candidate for rotation at a price point i liked.
I am neither bullish or bearish. The publication is for me others to learn how well rotation performs over time versus setting and forgetting.
ETH is backETH says: Hey you there! I am still alive.
ETH.D bounced off a multi-year top. The altseason is inevitable. Fasten your seat belts ...

Hook USDT SWING and Scalp TradeFor spot, try to accumulate hook from here 0.1680 and 0.12, scalp trade tp 0.19 Swing TP 0.22$. If you are taking it in future then book some on 0.19 and rest on 0.22$.

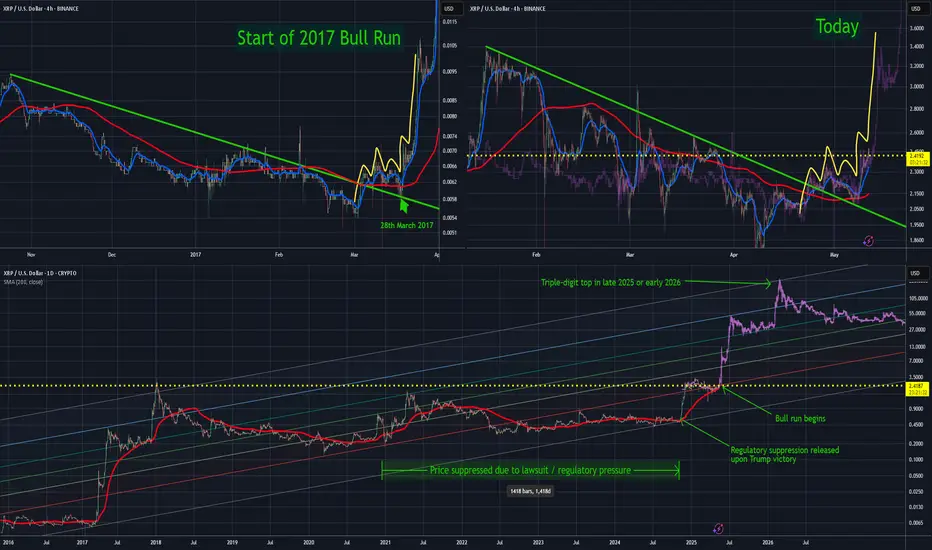
Thesis — How XRP Could Reach Triple Digits Within 12 MonthsAbout a month ago, I pointed out a pattern that preceded XRP’s explosive bull run in 2017. That same pattern is now playing out almost identically — and if the fractal continues to hold, XRP could be gearing up for another major move.
Frankly, the 4-hour chart is a near-mirror image of 2017’s setup. I’ve overlaid the original bar pattern onto today’s price action — the resemblance is hard to ignore.
If this plays out:
We could see a test of all-time highs within a week
Double-digit XRP by mid-year
Triple-digit XRP by late 2025 or early 2026
No guarantees, of course — but the structure is clear, and the setup is there.
For context, I view the November rally as XRP simply reverting to where it would have been had regulatory pressure not artificially suppressed the price. That move wasn’t the bull run — it was a reset.
Importantly, alt season still hasn’t kicked off (just look at BTC dominance), and XRP’s fundamentals are stronger than ever:
Lawsuit behind us
ETFs likely coming
Ongoing partnerships
Pro-crypto regulatory tone globally
Technically and fundamentally, XRP has never looked better.
Is It "GO" Time for $DOGE Dominance to Flippen BTC?Been talking about this for a while.
Early, but not wrong.
Remember: nothing ever moves in a straight line except c0caine- and even then, only if you're a degenerate.
But enough about my theory- this market is breaking a lot of old "ObViOuS" patterns, because they never repeat perfectly.
What do YOU think is going on here?
Is it actually GO time?

Nasdaq US100 Wave 3 Expansion Toward 31,606 in PlayNasdaq US100 has completed a significant wave cycle with a confirmed wave 1 in the broader Elliott Wave structure. Following this, price underwent a corrective wave 2 that extended from the $22,237 supply zone down to $16,334, marking the conclusion of the previous cycle’s correction. This structure now signals the initiation of a fresh upward impulse, setting the stage for a powerful wave 3 advance.
The emergence of wave 3 will gain full confirmation once price successfully breaks above the external supply zone, reclaiming $22,237. If this breakout occurs with sustained momentum, the wave 3 projection targets an expansion toward $31,606, which aligns with the 161.8% Fibonacci extension from the prior cycle. This forthcoming rally is anticipated to unfold in a five-subwave format, indicative of a high-momentum bullish leg.
As long as price action remains above the key support at $16,334, the bullish cycle remains valid. All eyes should now be on the breakout structure and volume profile around $22,237, as it represents the gateway to a much broader impulsive move.

BTC to create a low and then a new ATH!BTC may go low around 95k before pushing for a new ATH. This analysis is based on past price action as seen in red lines and previous circles. It confirms to the basic market structure analysis of HH, HL and HH.
However, do note that past price actions do not indicate certainty of future price. DYOR

Binance Coin AKA BNBAs the Crypto market looks to turn Bullish and create new ATHs
BNB also looks to set itself for a bullish run
With this one not as expensive as BTC, we might see it going up without proper market structure
As we saw with Monero

Next high will be lastAccording to parabolic move next high will be last high and end of bull season. Crypto market will be stable be and bear will start after stability.

EURGBP, Bullish Trend, 68% fib Retracement, seasonalityBullish DIvergence
68% fib retracement completed
Sideways consolidation breakout and retest completed
EUR is fundamentally bullish whle rate cut is expected in GBP
Seasonality of GBP is bearish indicating bullish momentum in EURGBP

2022 WinnersIn trying to figure out what would have done well in 2022, a time when most investments and funds lost money, I found these.

Short Idea on EURUSDBased on :
- Periodic volume profile
- Seasonality
- Currency strength of usd and eur are weakest vs strongest
- small divergence on Poiv but on weekly timeframe is more evident
- Cot data

Bitcoin dominance and the altseasonIn this chart, you can see the Bitcoin dominance from 2017 till now.
The depth of the altseason was 35.14% and for the bear market we went up, up to 73.02.
If we take a Fibonacci retrace level, we can see during 2021 altseason we were only retraced 0.893 or 89.3% what we lost during bear market.
It was something new and for the first time, Bitcoin Dominance didn't make the new all time low.
Following the same fact, I decided to find the possible levels for bitcoin dominance to top. we are getting closing the the 0.786, this level usually the last level that we could be bearish in any chart, however remember that last altseason we passed 0.786 but rejected at 0.893.
My opinion would be we are reaching to the top of Bitcoin dominance sooner than later, I can easily see Alts are reversing from bearish in short term and BTC Dominace Maxing in stoch RSI.
When you stay longer than usual in max excitation in stoch RSI you will be doing longer in opposite direction as well
Max BTC dominance can reach 66.2%
However, worse case scenario I am expecting at least BTC Dominace during altseason drop to 49.14% which is a historical support and also resistance during BTC season and Alt Season.
Ideally, we should go down up to 45.30% as it would be the 0.786 of the range from 39.9% to 66.2%
However, if we are able to make a new All time low in BTC dominance first idea place to see rejection or reaction would be 32.38%

NFLX Institutional Momentum Anchored in Multi-Decade ChannelNetflix (NFLX) has maintained a structurally intact long-term bullish momentum, consistently trading within a well-defined ascending channel dating back to the early 2000s. Price action has respected dynamic support and resistance levels within the channel, establishing a sequence of higher highs and higher lows that validate the primary uptrend.
Following a breakout from a major resistance zone around 2023, the stock exhibited accelerated bullish momentum, aligning with internal demand structures and confirming institutional accumulation. Price is currently advancing toward the upper boundary of the long-term channel, with the projected target around 4,935, coinciding with channel confluence and historical extension levels.
As long as the price action maintains structural integrity above the key anchored support near 1,154, the prevailing trend remains decisively bullish. A clean break and close above the upper bound of the channel may trigger an extended rally, while any rejection at this level would likely result in a cyclical mean reversion toward mid-channel equilibrium.

Alt season won't be too far!Based on common indicators, "Others" chart shows an obvious trend and pattern which, overall, confirms the high possibility of a new Alt season.

Rocket Booster + MACD System 20 .Min-DemoOne thing that i am good at is buying bitcoin.
It took me a year to master how to buy Bitcoin,
thanks to a trading competition.
This trading competition was on
Tradingview in 2024, and i ended up being
in the top 10% of traders worldwide
on tradingview.
The profits where calculated using
a simulation trading account.
The competition lasted for about
3 months. This means
you had to build your simulation
trading profit within 3 months.
The highest profitable trader won a prize.
Even though i did not win a prize i had profit
in that competition. This profit was
enough to put me in the top 10% of traders
worldwide, that use the tradigview platform.
It was from this simulation trading
competition that happened
in 2024 thats how i mastered
how to trade Bitcoin.
In this video i show you a system
called "Rocket Booster + MACD Strategy On 3 Time Frames"
In order to use this system effectively
or properly
you will need to subscribe to a
trading view monthly offer
that allows you to use time-frames
for quick and easy
screening of your favourite assets.
In this one we manually dive into.
SO to learn more just watch
this video demo for 20.Min.
Rocket boost this content to learn more.
Disclaimer:Trading is risky please
learn risk management
and profit taking strategies.
Also feel free to use a simulation trading
account before you trade with real money.

Privacy matters, and it will cost you in the futureGood day Investor and traders,
When the criminals run show, they definitely don't want you to know it.
Privacy is a double edged sword. However, just because criminals use it doesn't mean it should shunned upon. Criminals also wear clothes and use curtains. Both are fashion statement second, but serve as privacy first. Enough of my opinion, the chart speaks for its self.
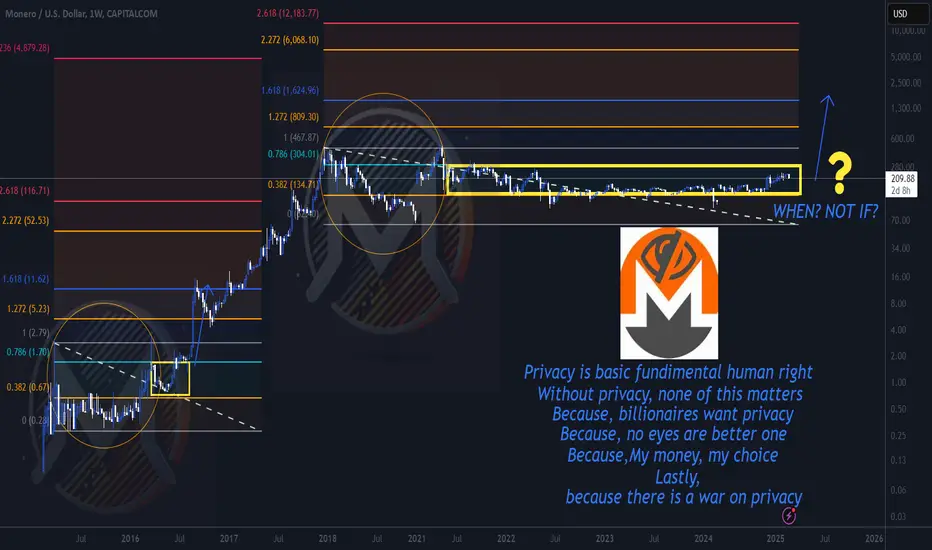
Other than my additions, this is a naked chart of XRM on the weekly. It shows a very distinct patterns of how it moves.
XMR is another coin that was in my thesis from a couple years back in the bear market of 2022 that was the "lengthening or alternating" altcoin cycles. Another cycle that looks like it want to repeat, just much more drawn out. I do believe it will repeat, it might take 10-20 years or so to do so. The next big phase of privacy might have to have people getting a taste of CBDC or UBI, before they realize how much it will, or most likely could infringe upon their privacy. The chart shows early investors already knew this. Look at that move from 2016 to 2017 25 cents to $480 dollars. WOW, that rivaled XRP's big move!!! The key pattern here is the initial move then the big correction, the retest (double top) and how it moves with the fib levels. I have highlighted this in the chart with the Monero XMR logo and and a circle then with the yellow rectangle. Its the same pattern just waaaay drawn out. So, after this double top M then correction, marks the key before price explosion. IMO, I don't think it's and "IF" it happens, but "WHEN" it happens. These types patterns are what sparked my original thesis on these coins. IMO there is a reason other than just profits, early investor recognized the eventual use case, just like in Bitcoin.
Let me know what you think in the comments.
Kind regards,
WeAreSat0shi
Price Action + Fundamentals Point to Dollar StrengthThe current market environment presents compelling evidence for a bullish move in the US Dollar Index (DXY). While some patience is required, the setup is increasingly favorable for the dollar to appreciate in the coming weeks and months.
Key Factors Supporting a Bullish Move:
Monthly Close Above 100.160:
A critical technical level to monitor is the monthly close above 100.160. If achieved, it would signal a strong bullish breakout, setting the stage for a continuation higher. Given current price action and market dynamics, this scenario looks highly probable. However, if the price fails to close above 100.160 and instead breaks below it, we could potentially start looking for short opportunities.
Bond Market Strength (30Y, 10Y, 5Y):
This past week, we witnessed notable strength across the US bond market. Yields declined as prices rose, typically a positive signal for the dollar as it reflects capital inflows into US assets.
COT Report Insights:
The Commitment of Traders (COT) report reveals a critical shift: commercial traders, often considered the "smart money," are beginning to accumulate long positions in the dollar. This change in positioning historically precedes significant bullish moves.
Seasonal Patterns:
Seasonality also favors the dollar during this period. Historically, the dollar tends to strengthen in the mid-year months, aligning perfectly with the current technical and fundamental landscape.
Targets:
Initial Target: 106.120
Given the accumulation signs and supportive macro backdrop, a move towards 106.120 seems very realistic.
