Bitcoin Short-term (Update)📈Hidden bearish divergence and strong BMS resistance led to the fall.
It seems that we are in for events somewhat similar to the previous cycle, a decline and a retest of resistance in about a month.
💡Also, if there is a consolidation near the local minimum, most likely we will take away liquidity from traders, but I would not expect a drop below 24k, I also think that the situation will improve closer to the middle of October.
Seasonality

CADJPY BUYS in play.CADJPY BUYS in play.
1. Potential Bullish Trend.
2. CAD is strong meanwhile JPY is weak.
3. Short term sellers pressure.
We are looking to go Long on this pair, As the price is heading towards the support and resistance zone. We will look for confirmations on the lower time frames.

DXY new analyzereaching old high in dxy
something happen in market look closely in monthly and weekly chart
maybe we are shifting because ending year
and other pairs have potential move because there are not symmetrical with dollar
check
CAD
XAU
S&P
AUD

Solana (SOL) -> New Altcoin SeasonMy name is Philip, I am a German swing-trader with 4+ years of trading experience and I only trade stocks , crypto , options and indices 🖥️
I only focus on the higher timeframes because this allows me to massively capitalize on the major market swings and cycles without getting caught up in the short term noise.
This is how you build real long term wealth!
In today's anaylsis I want to take a look at the bigger picture on Solana.
During the year 2021 we saw a crazy rally of more than 25.000% on Solana and since the beginning of 2022 Solana perfectly dropped more than 90% towards the downside.
Following this overall long term pump and dump trend I do expect another crazy pump after Solana broke out of the current triangle formation.
- - - - - - - - - - - - - - - - - - - -
I know that this is a quite simple trading approach but over the past 4 years I've realized that simplicity and consistency are much more important than any trading strategy.
Keep the long term vision🫡

BTC: Counting down the daysBoom4 is on deck! Looks like a fresh BITSTAMP:BTCUSD all time high Dec '24 and we top out Nov '25.
Top to bottom:
2013: 410 days
2017: 363 days
2021: 376 days
Bottom to new high:
2013: 771 days
2017: 732 days
2021: ~750 days (Dec 2024)
New high to Top:
2013: 297 days
2017: 329 days
2021: ~345 days (Nov 2025)

Reversal here we comePrice now is in the golden zone so. Buying here will be worth it. As ber seasons come.
Historical price floor here we come.
Buy and hold or cost average from here isn't a bad choice as fmetf is undervalued

BTC Long, bottom or another bear trap?28.5k is the invalidation line for continued bull momo. Close below it on the dailv and I think BTC either sees another bear trap/ deviation to 26k followed by a bull reversal to 37k. If the bear trap is set it is extremely risky to play. If it fails, BTC could hit at least 23k for AUG and 20k to 18.8k for SEP because both are statistically red months during the recovery phase of previous bull runs.
However, there is a minor bull case for the bulls considering we are at the bottom end of a linear regression trend from the bottom at 16k to the current price.
Nonetheless, I do expect volatility soon.
Trades:
Trade 1
Long 28650, sl 28000, tp 30500, 32000, 36500, 40000
Conviction moderate. High chance of getting stopped out if 28.5k keeps getting tested and removing liquidity from that region.
Trade 2
Long 26300, sl 24000, tp 30500, 32000, 36500, 40000
Conviction high. Lowered chance of getting stopped out and if a bear trap were to occur, this is the ideal entry.
Trade 3
Short 30500, sl 32000, tp 28500, 26500 (close here if there's bull volume), 24500, 21000, 19500
Conviction moderate. Might get front runned ~29.5k. but use this trade as a hedge against another false rally that leads into a bear trap ~26k, or even worse at 20k if theres no bullish volume for the expected trap.

Oil price cycles and rulesWhere will oil prices go in the future? Oil prices are often affected by the moves of OPEC, Russia, and wars involving countries in the oil exporting alliance.
When looking at the large frame, we can easily see that oil prices usually bottom in January at the beginning of the year, and the cycle is every 7 years.
Temporarily take the recovery zone between Fibo 0.618 and 0.788 as the entry and profit taking zone.
In my personal opinion, in the next 10 years, oil energy will no longer be attractive or a popular energy source for humanity. Maybe factories and transportation will gradually change. from oil energy to cleaner energy for emissions into the environment.

☕ Get a coffee and watch the charts- Price confirms 200 MA (red)
- Seasonality in Starbucks is starting now
- Retraced already over 38 % from the last high in April
So if the FED doesn't send the markets in the basement with their decision I stay bullish in Starbucks....

NVDA #nvda NVDA heading lower? If it does here are some levels it might hit if it doesn't regain the 50 day quicky

DXY ShortWe Might See USD Reach Out To This FVG Then Reversing To The Downside
Expecting that will be built on :
#Commercials shorting
#Open Interest (Needs More Research)
#Seasonal Tendencies

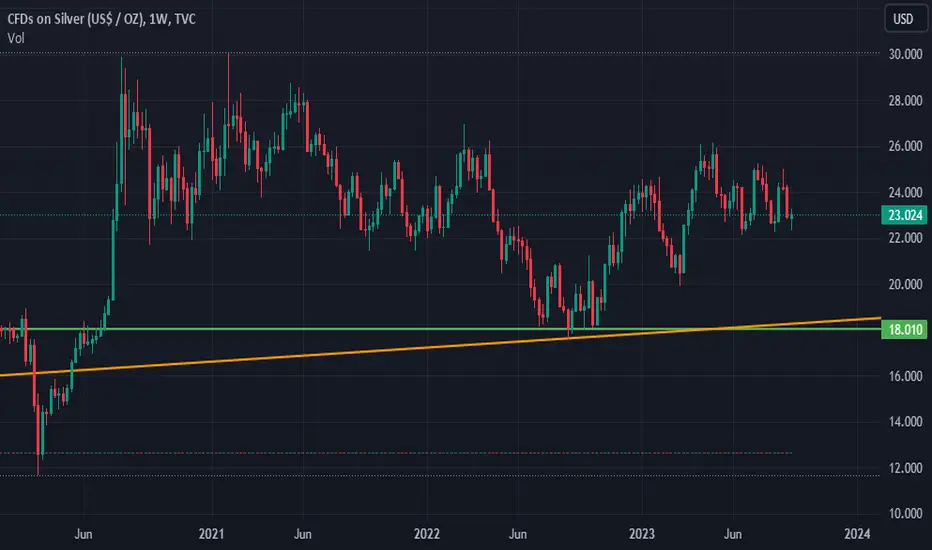
SILVER 9/16/23 ($18)SILVER will fall around $18 around the end of the year 2023!
Great opportunity to whale in!
Get dry powder! Get ready to strike!
GOLD 9/16/23 ($1,640)GOLD will fall around $1,640 around the end of the year 2023!
Great opportunity to whale in!
Get dry powder! Get ready to strike!

SILVER 9/16/2023 ($18)SILVER will fall around $18 around the end of the year 2023!
Great opportunity to whale in!
Get dry powder! Get ready to strike!

GOLD 9/16/2023 ($1,640)GOLD will fall around $1,640 around the end of the year 2023!
Great opportunity to whale in!
Get dry powder! Get ready to strike!

LTC 9/16/2023 ($57.67)LTC will fall around $57.67 around the end of the year 2023!
Great opportunity to whale in!
Get dry powder! Get ready to strike!

XLM 9/16/2023 ($0.082420)XLM will fall around $0.082420 around the end of the year 2023!
Great opportunity to whale in!
Get dry powder! Get ready to strike!

BTC 9/16/2023 ($19,600)BTC will fall around $19,600 around the end of the year 2023!
Great opportunity to whale in!
Get dry powder! Get ready to strike!

LTC 9/16/23 ($57.67)LTC will fall around $57.67 around the end of the year 2023!
Great opportunity to whale in!
Get dry powder! Get ready to strike!

XLM 9/16/23 ($0.082420)XLM will fall around $0.082420 around the end of the year 2023!
Great opportunity to whale in!
Get dry powder! Get ready to strike!

BTC 9/16/23 ($19,600)BTC will fall around $19,600 around the end of the year 2023!
Great opportunity to whale in!
Get dry powder! Get ready to strike!

Update Tesla 16/9Update Tesla 16/9
Exactly 2 months ago, I and Elon Musk controlled Tesla stock price.
And now! Do you see point 251? Come with me to go there and get the suitcase of money, it is the luggage for us to go higher.
Good lucky!

bearish if you notice price we have competed the Market maker buy model
now we are on a sell model meaning we will be aiming for those lows in the shaded area
study :)
