GBPNZD, Bullish Trend, Trendline, Consolidation, Seasonalityfundamental Analysis
1. Overall fundamentals shows bullishness in GBP while NZD is somewhat on weaker side
2. Seasonality shows Bullish trend in GBPNZD from start of May till Mid
Technical Analysis
1. Bullish Trend with trendline retest
2. Bullish divergence on 4h
3. consolidation at bottom
4. Buy on breakout above consolidation rectangle
5. SL below rectangle
Seasonality

EURUSD Shortprice at supply weekly zone
overvalued against dollar both on daily and weekly
retailers in green line are buying heavily - which we should be against
divergence between price and non commercials in red line
commercials selling
also seasonality would give a short term weakness

Meta Long price tapped weekly demand
sesoanlity is coming to pisitive in near future
underlavalued against bonds
price should break trendline on daily retest demand and off to go
Trade Safe

[ TimeLine ] Gold 21-22 April 2025Hello everyone,
📅 Today is Monday, April 21, 2025
I will be using the High-Low price levels formed on the following dates as reference points for potential trade entries:
📌 April 21, 2025 (Monday)
📌 April 22, 2025 (Tuesday)
🧠 Trading Plan & Notes:
✅ Gold has broken its ATH multiple times over the past two weeks —volatility remains high
✅ The range formed on April 21 is approximately 3331 to 3430 — a massive 1000-pip zone
⚠️ Due to the large range, reversal entries or trades based on Fibonacci levels may be more appropriate
✅ I will personally trade both signals as part of my ongoing research and strategy
⚠️ If you're unsure or risk-averse , consider skipping April 21's signal
📋 Execution Plan:
🔹 Wait for the price range from the candles above to fully form ( marked with green lines )
🔹 Entry will be triggered upon breakout, with a 60-pip buffer
🔹 If the trade hits Stop Loss (SL), switch direction and double the position size on the next valid entry for potential recovery
📉📈 Chart Reference:
x/lgXVOC2u/

Solana – Bear Market Rally or Reversal?Like the rest of the crypto market, Solana started rebounding on April 8th, pushing more than 50% up from the recent lows. But just like with many altcoins, I'm not convinced this is a true trend reversal. Instead, it looks more like a classic bear market rally.
Let’s not forget: SOL is coming down from nearly $300. A bounce from $95 to $150 is strong, yes—but in the bigger picture, it’s still just a correction.
📍 Key resistance zone: $160–$170
As long as price remains under this zone, the probability of another leg down remains high.
🧠 My plan:
If Solana creates a new local high around $160, I’ll be looking to sell into the rally.
🎯 Target:
$100 at least, depending on how the market reacts.

BTC.D Needs to Hit 71% For Alt Season To HappenI hate to be the bearer of bad news, but the face-melting Alt Season we are all patiently awaiting is not arriving until BTC.D reaches 71%
Having said that, there WILL be an outlier of Alts that outperform CRYPTOCAP:BTC , such as CRYPTOCAP:SOL 💯

shortLets go down. I feel you bitch. I feel this is the exact turning point and smackdown for profit. winning. Lets go for that lifestyle

Front-loaded Exports has fuelled rally in Corn. Can it last?After President Trump instituted broad new tariffs on 2nd April 2025, corn futures initially wavered but then rallied sharply. While this may seem counterintuitive given tariffs' disruptive impact on trade, near-term support for corn comes from front-loaded U.S. exports, a weaker dollar, and lower-than-expected domestic supply.
However, prices are likely to face downward pressure as the U.S. harvest season approaches. This paper examines the short-term bullish factors, outlines the potential risks ahead, and presents a hypothetical trade setup involving a calendar spread on CME Micro Corn futures.
CME Corn futures gapped lower on 3rd April but quickly recovered, jumping 4.5% over the next three trading days to six-week highs by 9th April. This move aligns with the typical spring seasonal trend, as corn often firms in late spring during planting & strong demand season.
Surging Export Commitments Amid Tariffs
Export commitments have surged post-tariff announcement. USDA reports that U.S. exporters had already booked about 85% of the 2024/25 season target by early April, according to Reuters , well above the 5‐year average.
In the week ending 3rd April, net U.S. corn sales hit ~40.2 million bushels, reflecting heavy front-loading. Large private sales continue: for example, in early April exporters announced a 9.4-million-bushel sale of 2024/25 corn to Spain.
These front-loaded sales (especially to Mexico & Europe) suggest buyers are rushing to secure supply before possible trade disruptions. Overall, extraordinarily strong export pace and large “flash” sales are underpinning the market.
Supply is Weaker than Initially Thought
USDA’s April WASDE cut U.S. 2024/25 ending stocks to just 1.465 billion bushels – a 75 million bushels reduction – implying a stocks/use ratio around 9.6%. For context, that ratio is near multi-decade lows for corn. The USDA simultaneously raised exports to 2.55 billion bushels, a full 100 million bushels above the previous estimate.
On the supply side, USDA’s Prospective Plantings (March 2025) projected 95.3 million corn acres for 2025, roughly 5% higher than 2024, above expectations (highlighted by Mint Finance in a previous paper ). This suggests that while near-term stocks remain stressed the situation is likely to improve drastically following the harvest.
Weaker Dollar Supports Increased Corn Exports
A key bullish factor for U.S. corn exports is the recent weakness of the U.S. dollar. After the tariff announcement, the trade-weighted dollar tumbled – hitting fresh lows (e.g. a 10-year low versus the Swiss franc). Through April 10, the dollar was down ~2–3% on the week. A weaker dollar makes U.S. corn cheaper for overseas buyers, supporting export competitiveness. With dollar at multi-year lows, U.S. corn is more attractive globally, partly offsetting any Chinese retaliatory tariffs.
COT and Options Data
Managed-money funds have dramatically pared back their long corn bets since the beginning of March. CFTC COT data show net long positions peaking around 364,000 contracts in early February, then plunging to ~54,000 by the 8th April report. However, the pace of decline has slowed dramatically over the past few weeks and seems to be signalling an end of the cutback by asset managers.
Interestingly, despite the tariff introduction (2/April) and the WASDE release (10/April), implied volatility (IV) moderated. IV has since normalized from the spike observed in March. During this period, skew also declined, reaching a negative value on 8th April - indicating that put options briefly became more expensive than calls.
Although this trend has since reversed, skew remains near its lowest levels in 2025, suggesting sustained interest in put options among market participants.
Source: CME CVOL
OI shift over the past week also signals a cautious tone despite the rally. Near term options have seen an increase in put OI, suggesting participants remain cautious despite the rally.
Source: CME QuikStrike
Hypothetical Trade Setup
While bullish factors have driven a sharp rally in corn prices over the past two weeks, there are dark clouds on the horizon. Tariffs risk disrupting trade and as most importers have already loaded up on US corn, they could slow the pace of future purchases.
Additionally, a downbeat seasonal trend along with an expected bumper harvest signal that prices could reverse sharply from here. On the technical front, momentum remains solidly bullish but approaching a potential overbought level amid a slowing bullish trend.
Corn prices remain pressured from a bumper harvest expected in September. Along with expected trade disruptions and a slowdown in the pace of US exports, prices are likely to decline during the summer. Regardless, prices remain bullish in the near term from a weakening dollar and near-term front loading.
To express views on these converging trends, investors can deploy a calendar spread on CME Micro Corn futures consisting of a long position on the near-term May contract (MZCK2025) and a short position on the September contract (MZCU2025). A hypothetical trade setup providing a reward to risk ratio of 1.8x is mentioned below:
A calendar spread on CME Micro Corn Futures is highly capital efficient with the above trade requiring maintenance margin of just USD 23 as of 15/April. The position remains protected from near-term price increase but benefits from the eventual price decline in September during harvest season.
MARKET DATA
CME Real-time Market Data helps identify trading set-ups and express market views better. If you have futures in your trading portfolio, you can check out on CME Group data plans available that suit your trading needs tradingview.com/cme .
DISCLAIMER
This case study is for educational purposes only and does not constitute investment recommendations or advice. Nor are they used to promote any specific products, or services.
Trading or investment ideas cited here are for illustration only, as an integral part of a case study to demonstrate the fundamental concepts in risk management or trading under the market scenarios being discussed. Please read the FULL DISCLAIMER the link to which is provided in our profile description.

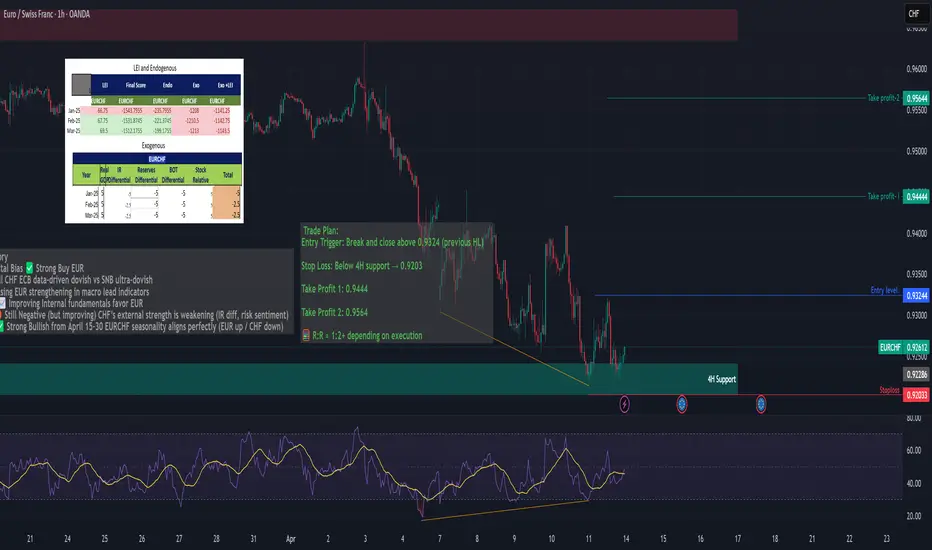
EURCHF – Bullish Reversal Setup + Fundamentals Trade Idea Summary: EUR/CHF showing strong bullish confluence:
✅ Bullish RSI Divergence on both 1H & 4H
📉 Price testing a key 4H support zone
📊 Seasonality favors EURCHF upside (bullish from April 15–30)
🧠 Fundamentals, COT, LEI + Endogenous indicators support long EUR / short CHF
ECB: Dovish but stable, EUR fundamentals improving (LEI ↑, Endo ↑)
SNB: Aggressively dovish, low inflation, weak CHF outlook
0x Idea speaks for itself.
We're currently in 'PROVEN BUY ZONE' with past returns well above 6x.
This is not financial advice nor any indicator or promise of future gains, however...
It's undeniable that within last 5.5 years this infrastructure protocol gave plenty of opportunities and there are no fundamentals (known to me) that should negatively impact potential gains of min. 2x from trigger range within next 12M.
At the moment chart has left the trigger range, but it usually takes time before it develops desired structure for a move up. Personally, I'll be looking to make a decision around range top as LTF show confluence area around $0.228-$0.22 and lower, at $0.209.
For those with 'more sophisticated' pallet for a tighter entries, there's a range low to hope for expanding further 30% to the downside.
Worth to come back to this EOY to reconcile.

Bitcoin Cyclical Pattern Analysis: 2017 vs 2025-2026The charts provide compelling evidence of fractal patterns between Bitcoin's 2017 bull run and the current 2025 cycle, revealing both striking similarities and meaningful differences in market behavior.
Key Similarities
Both periods display remarkably similar structural patterns with consistent sequence of movements:
Initial pulldowns (~34% in 2017 vs ~33% in 2025)
Series of uptrends followed by corrective pullbacks
Progressive upward momentum with higher highs and higher lows
Similar number of major price waves (four significant uptrends in each case)
Key Differences
Timeframe Extension: The 2025 cycle shows significantly extended durations compared to
2017
Initial pulldown: 3 weeks (2017) vs 21 weeks (2025) – 7x longer
First major uptrend: 12 weeks (2017) vs 11 weeks (2025) – similar duration
Second uptrend: 12 weeks (2017) vs 14 weeks (2025) – slightly longer
Overall cycle progression is approximately 2-3x longer
Magnitude Reduction: The 2025 cycle shows diminished percentage movements:
First major uptrend: 230% (2017) vs 120% (2025) – roughly half
Second uptrend: 172% (2017) vs 85% (2025) – roughly half
Final uptrend: 253% (2017) vs 125% (2025) – roughly half
Technical Analysis Support
This pattern correlation would likely be supported by other technical indicators:
Bollinger Bands would show:
Similar pattern of band expansion during strong directional moves
Band contraction during consolidation periods before breakouts
2025 likely exhibiting less volatility (narrower bands) but with similar repeating patterns of price touching upper bands during uptrends and lower bands during corrections
Ichimoku Cloud would demonstrate:
Similar cloud breakout patterns preceding major uptrends
Price respecting key Ichimoku components (Tenkan-sen, Kijun-sen) as support/resistance
2025 showing extended time within the cloud during longer consolidation periods
Similar bullish/bearish crossovers of the conversion and base lines, but occurring over longer timeframes
Predictive Value
This comparative lens offers valuable predictive power for several reasons:
Market Psychology Consistency: Despite Bitcoin's maturation, market psychology (fear, greed cycles) remains remarkably consistent, expressed through similar percentage retracements and fractal patterns.
Macro Context Integration: The longer durations and reduced volatility in 2025 reflect Bitcoin's increased market capitalization and institutional adoption, creating a logical evolution of the same underlying patterns.
Specific Forecasting Application: If the pattern correlation holds, we might anticipate:
The current cycle extending into mid-2026
One more major uptrend followed by a 30-40% correction
A final explosive move of approximately 125-150%
Total cycle appreciation significantly less than 2017 but still substantial
Risk Management Framework: These patterns provide clear pivot points for position sizing and risk management, with defined percentage targets and timeframes.
This analysis suggests we're witnessing an evolved expression of the same market dynamics that drove the 2017 cycle, with the extended timeframes and reduced percentage movements reflecting Bitcoin's maturation as an asset class while maintaining its fundamental cyclical character.RetryClaude can make mistakes. Please double-check responses.

QTUM May Surprise You All (3D Analysis)Qtum has formed a rectangle in weekly time period. Whenever it reachs the bottom, always turned back to gather upside liquidty till now.
The other interesting thing is, when Qtum first went upwards for liquidty, it took over 2 years to gather all remaining short liqudations. When it did again, it took less than a year. So the scale of time for gathering liquidty is squezing.
If Qtum can stay above the bottom of the rectangle, I believe there is a chance for %160 profit in long term. There is not even need for a leverage.
-%20 down here means that this coin is set for going hell and no way for recover.
But, there is %160 profit chance. The question is, are you willing to take that risk?
Cause I will.
Thanks for reading.

EURUSD - Medium-term analysis of the euroThe weekly order flow is bearish and the daily is bullish. But let's take a closer look at the EUR from the monthly timeframe:
On the monthly timeframe, the price has hit the middle of the swing structure and has also filled the FVG.
Regardless of the seasonal tendencies that slightly favor the monthly bullish candle, on the weekly timeframe, the price has hit an order block last week and has gathered liquidity at equal levels below this order block.
With all these interpretations and signs that I see, although the daily timeframe has bullish order flow, I think the price can move down from this point (unless Trump gets naughty) and and target external liquidity on March 26.
I predict that the April monthly candle will close as a doji.
Everything is indicated on the chart.
This analysis will be updated in the future.
Be profitable

EURAUD, Bullish Bias, Fundamental and Technical AnalysisFundamental Analysis
1. Seasonality shows bullish momentum in EURAUD from 10 Apr to Mid of May
2. COT data shows net positions reduction in AUD while Increasing in EUR
3. Overall score of EUR is bullish and AUD is bearish
Technical Analysis
1. EURAUD broke 2 year Rectangular consolidation box
2. strong breakout appear
3. Bulls are in charge
4. Waiting for retest of breakout for entry
5. 1st buy 1.74 with Sl 1.704,
2nd buy if SL hit of 1st buy, entry @ 1.68 with SL 1.634 increase risk to 2%

ADOBE buy BiasWith the current bearish move on the NASDAQ - we can expect Adobe to move towards that weekly/daily Demand zone and fill a Long position to the upside.
Vaulation and seasonality align with stocks and indices - we should find a bottom to this drop on all indices Mid-End of April 2025.
Trade safe!

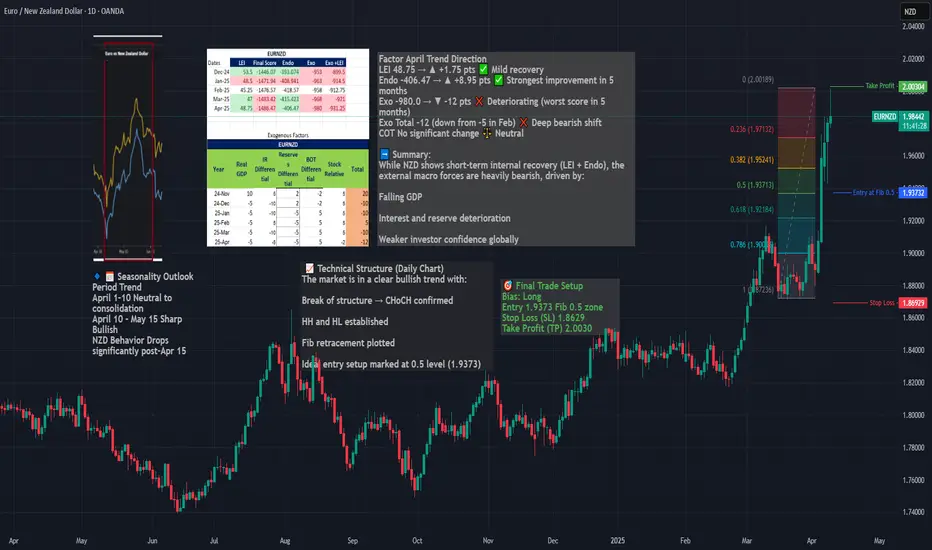
Long EURNZD – Seasonal, Fundamentals & Technical ConfluenceWe are entering a long position on EURNZD, capitalizing on a powerful confluence of:
Seasonal EUR strength + NZD weakness (April 10 – May 15)
A clear bullish market structure (CHoCH, HH/HL)
A clean Fibonacci retracement entry at 0.5
Strong macro divergence, with NZD exogenous conditions deteriorating
Macro & Seasonal Context
EUR enters a strong seasonal uptrend from April 10 to end of month
NZD shows seasonal weakness from April 15 onward
NZD’s exogenous model score worsened to -12 in April
While NZD LEI and endo improved, it remains structurally weak
Timing
Best execution: on pullback to 1.9373 zone, ideally between April 10–15, aligned with seasonal entry window.
a breakdown of the 6 month channel
"On the yearly chart, gold is near its trading high, and on the 6-month chart, it's near a support floor. There's a high probability of the support breaking."
Here's a slightly more formal way to phrase it, which might be used in a trading context:
"On the annual timeframe, gold is trading close to its resistance peak, while the 6-month chart shows it nearing a support level. The likelihood of this support being breached is quite high."

Tweet and idea (you can use it for prediction)Tweet and idea (you can use it for prediction)
💡 This trading idea is based on analyzing market reactions to news and tweets from influential figures — especially in the context of cryptocurrencies and stocks prone to speculative spikes.
📊 Core Strategy:
The model tracks sudden price movements triggered by public statements (e.g., tweets from Elon Musk, breaking news, etc.). After the initial reaction, a retracement or continuation pattern often forms, which can be used to enter a trade.
🧠 How to use it:
1. Monitor the news flow or social media activity related to the asset.
2. Identify the initial impulse on the chart (high volume, sharp movement).
3. Wait for consolidation or a minor pullback.
4. Enter on breakout or bounce, using a tight stop-loss.
📌 Best suited for high-volatility assets with frequent hype triggers (e.g., DOGE, TSLA, BTC).

EURUSD, Bullish Bias, Fundamental and Technical AnalysisFundamental Analysis
1. Endogenous factors of EURO is getting better while USD is down
2. Seasonality shows EURO bullish in April while USD bearish
3. increased pressure of interest rate cut in USD in also leading towards DXY bearish
4. COT data shows net increase in EUR and decrease in USD
5. Sentiments shows bullish in EUR 11/8, while USD is 4/5.
6. LEI, Endogenous and Exogenous factors all in favor of Bullish momentum in EURUSD.
Technical Analysis
1. Cup and Handle Formation
2. Breakout appeared
3. Breakout Retest
4. Buy in parts
i. Long 1% at current price
ii. Long 1% @ 1.09017
5. Stop loss below Handle
6. Projection Target 1.165
7. Take profit on Major resistance levels

$QQQ Has Officially Entered a Bear Market $SPX is CloseNASDAQ HAS OFFICIALLY ENTERED A BEAR MARKET, DOWN ~22%
NASDAQ:QQQ 2022 Bear Market bottomed ~37%
just below the 200WMA
S&P 500 is not quite there yet, down only ~17.5%
SP:SPX 2022 Bear Market bottomed ~27% a tick below the 200WMA

Short Idea On GBPCADBased On :
- Cycles and quantitative analysis
- supply zone
- Small speculators buying at extremes so we do the opposite

ETH Is Oversold Like Never Before !Hello Traders 🐺
In the recent week, we saw a massive long position wipeout, especially in the stock market.
However, despite all the rumors, BTC held itself at these levels and is still inside a falling wedge pattern.
If you don't know what I’m talking about, you can check my last idea about it.
But ETH!
In my opinion, this is a huge discounted price for ETH.
You know why?
1_ Monthly RSI is currently at 25, which means we’re in an extremely oversold situation, and this usually means bulls are about to come back.
Yes — we have all the signs of a reversal from here:
(A): BTC.D RSI is at an all-time high and forming a bearish divergence, meanwhile:
(B): ETH/BTC is extremely oversold right now.
(C): BTC itself has formed a falling wedge pattern right above the weekly Cup & Handle neckline support!
Guess what?
If you zoom in a little bit on the daily chart, you can see there’s a pattern to break, and price is currently too close to the edge of it —
which means time is ticking for ETH, and we are about to see an explosive move.
Probably to the upside, because of all the signs we’ve talked about above.
I hope you enjoyed this idea — and as always, don’t forget our goal:
🐺 Discipline is rarely enjoyable, But almost always profitable 🐺
🐺 KIU_COIN 🐺

why Robinhood’s stock ($HOOD) could be considered bullish:Analyst Upgrades : Robinhood has received positive upgrades from analysts, with a target price suggesting a significant upside. The company's growth in digital wealth management, AI-powered investing, and new banking features contributes to these bullish forecasts.
Strategic Investments : High-profile investors, such as Cathie Wood’s ARK Invest, have increased their stake in Robinhood, signaling strong confidence in its future growth potential.
Product Diversification: The company continues to expand its services, with new offerings like Robinhood Strategies, an affordable robo-advisor, which is expected to attract a broader customer base seeking wealth management solutions.
Positive Analyst Sentiment: Robinhood has an average "Buy" recommendation from analysts, reflecting general market optimism and the stock's positive outlook over the next 12 months.
Strong Earnings Growth: Robinhood's robust revenue growth rate (over 58% in the last 12 months) reflects its expanding market share and the potential for continued financial success.
Analyst Price Targets: Multiple analysts have set a price target for Robinhood with significant upside potential, indicating that there is room for further price appreciation in the coming year.
Market Positioning: Following political shifts, Robinhood's stock has benefited from increased interest in cryptocurrency trading and favorable market conditions, showing how external factors can favor its performance.
Technological Advancements: Robinhood’s investment in AI tools like Robinhood Cortex enhances its platform’s value proposition, improving user experience and engagement, which could lead to increased retention and growth.
Diversified Revenue Streams: Robinhood’s move into banking, offering high-yield savings accounts, allows the company to tap into new revenue streams, reducing its reliance on traditional brokerage commissions.
Favorable Market Sentiment: Robinhood is seen as part of a broader trend of stocks benefiting from shifts in market sentiment, particularly around the "Trump trade," showing how political and economic cycles can impact stock performance positively.
These factors together suggest a promising outlook for Robinhood’s stock, positioning it for continued growth and potential upside.
