ITB channel breakoutHomebuilders have been behaving well in a channel since the market low of march 23rd.
Tuesday after memorial day was the first break out of the channel, and today's participation continues to give the sector a more positive view.
Next tested resistance which is all time highs around $49.5
Next strong support is the 200sma (red line)
RSI is taking us to overbought level (relative bear)
OBV trending higer (bull)
We are seeing some sort of rotation to more cyclical sectors. I am checking out for IYT, IYF, XLI.
Sector

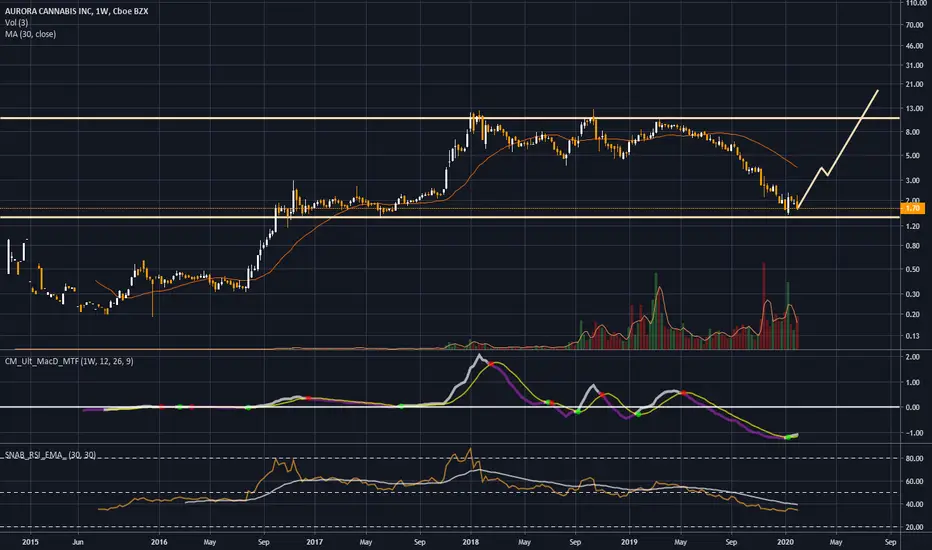
Aurora Cannabis - Godly swing trade setupThis might be a long analysis but let me explain why this stock will go higher than Seth Rogan on 4/20.
The stock market and the cryptocurrency markets continue to trend up and we are starting to see companies in all sectors start to break out. This stock is an amazing opportunity because it recently dropped 17% to 1.65 based on FUD. Do not let FUD news influence your judgement, let the TA influence your judgement. Aurora is fundamentally stable and the growth of cannabis is inevitable due to Millennials and Generation Z. This company is on a secular uptrend but it has recently followed the rest of the cannabis stocks such as CGC on the way down. But it's gone down far more than I believe is reasonable. Do not fool yourself to think that it's the company doing really bad, it's not doing bad enough for this to disregard supply and demand, its the sector going down. It's not sustainable for this sector to continue a downtrend in the middle of a bull market. A lot of sectors have already curved out of the pullback phase and began their uptrend. With that being said, the possibility of a swift bounce to $4 in the short term is very likely. Another aspect we need to look at is the triple top at $10. I believe if the stock curves up to 4$, then the momentum should push price beck up to the triple top, which will certainly be broken(similar to the tesla trend). This stock should swing to $15-20.
Let's get into some indicators:
30 week moving average: normally I look for the stock to be crossing the MA for me to be sure about a reversal but the stock fell so sharply that it skewed the 30 and 50 week MA's. They do NOT hold relevance at this moment in time. It will very soon when the stock is trading at around 4$ and then we should start seeing a cross on the 30 week MA, instead of this MA that looks scary.
RSI: the RSI is bottomed out, I use 30 with a 30 MA on mine because I dont like using the 14 RSI, I think it caps you out too soon. According to the RSI we have a massive amount of room for momentum. You can call me cynical but I've been doing this for a while and I know this stock has enough momentum for a swing to $15-20.
MACD: we had a bullish cross on the MACD on the week of January 13th.
Volume: we can see the bottom being caught by large volume. The bulls are here, we're buying the support level. If you zoom in to the daily time frame you will also spot an inverse head and shoulders pattern that's still holding even after the recent 17% drop.
Horizontal Support: we're holding a massive support level from 1.30-2.00 that's relevant from OCT of 2016 to OCT of 2017.
So to wrap things up, we have several bullish indicators and we know there was a massive influx of volume on the triple top level around $7-10 and a massive support level at $1.30-2.00 from 2016. We're in a bull market and the company is not doing bad. Aurora will shoot up.

Real Estate Sector Weekly Analysis Neutral / Range Bound forecast for the week. Likely down and then up, ranging in the shown area. Selling short term premium on either side of range.

Overall Market AnalysisMarket forecast is Midterm Neutral - Shortterm Bearish
Bullish Sectors are:
Healthcare
and Energy
Bearish Sectors are:
Consumer Staples
Financials
and Tech

Weekly Health Care Sector AnalysisPick Healthcare stocks at the bottom of their range with you favorite buy signals.

Weekly Energy Sector Analysis and ForecastPick Energy stocks with good setups/fundamentals/technicals. Possible time to enter Energy sector for long term holdings. Will likely do well through market tumult.

PHLX Gold/Silver Sector (XXAU) long.All description on chart.
Don't forget to like and follow.
Thank you.

US Sectors Analysis : Bubble or Crash depends on what you trade!Hope this idea will inspire some of you !
Don't forget to hit the like/follow button if you feel like this post deserves it ;)
That's the best way to support me and help pushing this content to other users.
Kindly,
Phil

Buy and hold these sectors to outperform the S&PThey say it's really hard to beat the S&P 500. I really don't think so. This chart doesn't show the performance of the semiconductor sector. It shows the *difference* between the semiconductor sector's performance and the performance of the S&P 500. This sector has consistently outperformed, even this year, when the sector faced major headwinds from flagging demand and the China trade war. With trade talks in the works and AI research booming, there's no end in sight to the semiconductor boom.
Another sector that has blown away the S&P 500 is the software sector. Again, AI is booming, and the software sector is principally responsible for developing it. Plus, as we become more and more dependent on technology, this sector is responsible for creating the interfaces between ourselves and our devices. I anticipate no end to this sector's outperformance.
Another long-time winner against the S&P is the aerospace sector. With an increasingly interconnected world, air travel should continue to be important. There's some possibility here that the industry will be disrupted by ground/sea transport alternatives like the hyperloop, but that's just a pipe dream at the moment. Aerial supremacy also remains central to modern warfare, and should remain so for the foreseeable future. And then there's the final frontier: space travel. The private sector has taken an increasing interest in launching satellites and spaceships, and the space travel boom should continue to grow unless it runs up against the Kessler Syndrome.
Worthy of honorable mention is the healthcare sector. In my opinion, this sector has outperformed mostly due to a kind of inefficiency bubble. If the sector became notably more efficient-- either by cutting out middlemen and administrators or by implementing a more transparent pricing system-- it could experience a significant contraction. In some ways that's already happening, with the advent of teledocs and discount health clinics. There also remains a lot of political risk here. Republicans want to repeal more of the ACA, which could shrink the insurance market, and Democrats want to impose price controls and abolish private insurance altogether.
P.S. To see how any equity's performance compares to the S&P 500, put "/SPY" after the ticker.

ALPS ETF Trust Dividend Dogs Etf (SDOG) long.All description on chart.
Don't forget to like and follow.
Thank you.

Equities' Last Push 7-31-18Friends, as you can see from the linked ideas I have been able to use fib levels to good effect when predicting where price will go. Let's use them once more! As we can see, the Nasdaq (as well as several other indices including the all-important Russell 2000) have been bouncing off respective fib levels. Russell once again seems to say GO. This time, however, I expect limited upside. It appears the markets are in a larger-scale consolidation. They may be rolling over or, as the case may be, gathering strength for new highs. I'm sure the exact move will depend somewhat on the news. I conservatively target the boundary of the consolidation for trade completion.
The Nasdaq in particular has been hard-hit due to poor numbers from tech names, and may be due for a rally.
A trade is Nasdaq at this level is a 1:4 / risk:reward.

$XLU bullish credit spread for this #FridayNew bullish credit spread on XLU . Opened and moved above the $53 mark this morning. Looking for a higher low and mid 52s to confirm as support early this week.
Entry 53.05
Break even 53.21
Max profit 53.50
0.78:1 risk/reward

CELG Q1 2018 Earnings on 5/4 - Are Traders Rotating In or Out?What a tumultuous market.
Celgene reports earnings on 5/4. Earnings play aside, are traders and investors rotating into or out of pharmaceuticals?
The market doesn't know what to do with itself right now. With a Fed meeting taking place over the next couple days, Caterpillar's CFO claiming we've seen a "high water mark" with Q1 earnings, rate concerns, trade concerns, and historic geopolitical uncertainty (especially regarding Iran's nuclear program), some traders claim we've already seen April and May's strongly anticipated earnings rally.
If that's true, 1. what a squishy rally, and 2. where do we go from here?
Thanks in advance for lending me your attention!
Pharmaceuticals are a wild card among the classical winners (usually, financials, materials, and energy) and losers (REITs, utilities, etc.) in a late-cycle rotation.
It can be argued a lot of Wall Street cash has sought the arguably greener pastures of cryptocurrencies. But could we see prices move upward along the right side of the chart in pharmaceutical companies?
CELG reports earnings on 5/4. Celgene took a dive on 4/30 on troubling news about a drug in its development pipeline.
Did that drop make Celgene a bargain buy?
CELG's drop on bad news has put it at technical support. The uncertainty of its earnings report and the market overall has it arguably priced cheap. Is Celgene a cheap buy in this market with a possible earnings surprise on 5/4 and upside potential with a rotation into pharma?
Please like, follow, and share, and maybe we can have fun and do great things together.
Thanks again!
See it on the site: holsturr.com/category/markets/charts/
** For speculative and research purposes only - good luck! **

Steel is looking AMAZING right now!!!!!Hey Guys,
Gonna make this very quick.
Steel is looking ridiculous right now. It broke out of its logarithmic resistance (extremely hard thing to do, took around 8 years), is at a daily resistance right now of around 51.60, and has fantastic potential to jump up to 57.00-58.00 MINIMUM, 76.00 being Aggressive. That doesn't even include the new tariff Trump put in place!
I don't prefer to invest in ETF's, so I've found some very specific steel or steel-related value stocks who have grown with the same correlation as the ETF but at a faster Rate of Change. I posted about one recently, VALE, so feel free to check that one out. There are still a couple of gems I've found that I haven't posted about, so see if you can go find them on your own!!
Always try to diversify portfolio's anyway but not in some random, bullshit way. Try to find sectors or stocks with high growth potential and diversify among a couple of them! Steel is a great diversification from Technology so if you have a Nasdaq heavy portfolio, feel free to add some steel to it!
I wouldn't invest yet though, if we break 52 with good volume though, 57 should be achievable in no time and the 5-Day MA should begin to slope upward.
Remember though, do not, and I mean ever, for anybody, follow their advice blindly. I'm not licensed in any way shape or form, just interested to share my ideas with y'all and start a discussion, so make sure to do your own DD!
Any questions, leave them down below!

Retail ripping back higher XRTWe've seen a massive rip in retail with XRP in the last couple days.
Finally breaking out of this 6 month long Head and Shoulders bottoming pattern. Breaking out over that neckine of 42 was the buy signal. Overall, retail is still in a down trend, and that downward trendline from 2015 highs is our target as well as where we should face profit taking and resistance. It is also coincidentally the 200% measured move of the head and shoulders pattern. Those technical levels always work out despite what the nay sayers may tell you.
THE TRADE:
Long over 42 (head and shoulders neck line)
Target 45 (measured mvoe of head and shoulders)
Stop under 42
We want to be buying the dips on this rip until we reach our target.

6.15.2017 Trade Idea: NFLXIf you are interested in more of our trades, check out our profile and Tradingview Indicator @ChaoticTrader

How much will overbought Materials Sector Fall? XLBThe Materials Sector SPDR Fund has been in a bull trend since the end of the financial crisis. The trend has narrowed but remains upright since December 2016. The fund has been in a more specific trend channel since February and has created firm support and resistance levels. The fund is currently at that resistance level. Below I have laid out the reasons and levels to which the fund may dip will it continue its overall bull trend.
When we take a look at technical indicators, the relative strength index (RSI) is at 64.9868. RSI tends to determine trends, overbought and oversold levels as well as likelihood of price swings. I personally use anything above 75 as overbought and anything under 25 as oversold. Currently the RSI is below overbought levels, however, the RSI has developed a resistance point of its own. The RSI has been reaching lower highs since December 2016 and is once again at this key resistance point. If the RSI begins to retreat, the fund should follow suit.
The true strength index (TSI) is currently 4.4168. The TSI determines overbought/oversold levels and/or current trend. I solely use this as an indicator of trend as overbought and oversold levels vary. The TSI is double smoothed in its calculation and is a great indicator of upward and downward movement. Like the RSI, the TSI has created relative resistance since December. This indicator is about to hit that threshold. Failure to substantially break above this resistance, the fund should drop in the near-term.
The positive vortex indicator (VI) is at 1.1174 and the negative is at 0.7410. When the positive level is higher than 1 and higher than the negative indicator, the overall price action is moving upward. When the negative level is higher than 1 and higher than the positive indicator, the overall price action is moving downward. These indicators have been in a relatively tight trend since mid-February. When the positive VI was last at its current level, the fund tapered down which ultimately led to a drop to the fund's support line (dotted pinkish-purple on the chart).
The stochastic oscillator K value is 92.2124 and D value is 87.3198. This is a cyclical oscillator that is highly accurate and can be used to identify overbought/oversold levels as well as pending reversals and short-term activity. I personally use anything above 80 as overbought and below 20 as oversold. When the K value is higher than the D value, the stock is trending up. When the D value is higher that the K value the stock is trending down. The stochastic currently overbought, but the D value has not overtaken the K value, meaning the fund could produce gains for a few more days before ultimately turning downward.
The last three times the fund hit its resistance, it did manage to drop down to its support level in less than 12 days. The first drop was in January over 9 trading days and it resulted in a 3.62% decline. March saw a 3.41% decline over then following 6 trading days while April had a 2.91% drop over 11 days. These timeframes and declines could be blueprints for the current bounce off of the resistance level.
Considering the RSI, TSI, VI and stochastic levels, the overall direction favors a move to the downside. Based on historical movement compared to current levels and the current position, the fund could drop at least 2% over the next 23 trading days if not sooner.

Hershey's CoCo Sector Report - January 28, 2017Materials and Finance both started the week flat, moved up for a couple days, then remained steady on Friday while the US and World markets were down. If the US and World indexes are up next week I expect much from these two!
Real Estate and Consumer Staples (Non-Cyclical) were the clear Sector losers taking back all the gains they made early in the week to finish weak.
Materials had over 60 stocks > 5% for the week... compare that with Real Estate that had only 9!
Good trading!
Brian Hershey
*****************************
Check out my "Hershey's CoCo World" indicator, available now for your US stock and sector evaluations.
"CoCo World" helps to answer the following question: Is this stock moving alone or with the US and world markets? No stock is an island, so it's important to see what everyone else is doing. Useful across all time frames, small and packed with info!

Hershey's CoCo Bear Sector Report - January 23, 2017Finance and Industrial looking BEAR lately! Going down more than the market since mid December, 5-6% more to drop until next support levels from late November.
********************
Hershey's CoCo Indicator details:
Very Bull = Blue Arrow = Sector and Market prices are up, Sector price up more
Bull = Green Arrow = Sector and Market prices are up, Market price up more
Bear = Red Arrow = Sector and Market prices are down, Market price down more
Very Bear = Black Arrow = Sector and Market prices are down, Sector price down more
Neutral = No Arrow = Both movements equal
Arrow Length = Strength (the longer the arrow the bigger the difference)
Green Background = Bull = Above zero Moving Average of all arrow values
Red Background = Bear = Below zero Moving Average of all arrow values
To review, the Blacks and Blues are the HEAVIEST pressure... the LONGER the STRONGER!

Hershey's CoCo Bull Sector Report - January 23, 2017I got Real Estate and Utilities mid-term bull... beating the market in daily upward price movement since mid November. Real Estate still has 12%+ until it hits next big resistance from last August. Utilities have 8%.
********************
Hershey's CoCo Indicator details:
Very Bull = Blue Arrow = Sector and Market prices are up, Sector price up more
Bull = Green Arrow = Sector and Market prices are up, Market price up more
Bear = Red Arrow = Sector and Market prices are down, Market price down more
Very Bear = Black Arrow = Sector and Market prices are down, Sector price down more
Neutral = No Arrow = Both movements equal
Arrow Length = Strength (the longer the arrow the bigger the difference)
Green Background = Bull = Above zero Moving Average of all arrow values
Red Background = Bear = Below zero Moving Average of all arrow values
To review, the Blacks and Blues are the HEAVIEST pressure... the LONGER the STRONGER!

US Airlines breaking higher - Tweet asking if it's BuffetA short Tweet asked if Warren Buffet is buying the Airlines.
Regardless, it seems to gathering upside momentum.
A break above the USD277~ range highs is needed to shake out the shorts.

JP Morgan remains strong - outperforming SP500The underlying bullish trend remains intact, as prices post new highs. Momentum studies are already overstretched, however, but downside risks are likely to remain limited as monthly studies remain strong and investors maintain a buy-into-dips strategy.
JP Morgan is also outperforming the SP500, and as a proxy for the broader based US Financials Sector, asset managers are likely to maintain an overweight stance in this sector.
