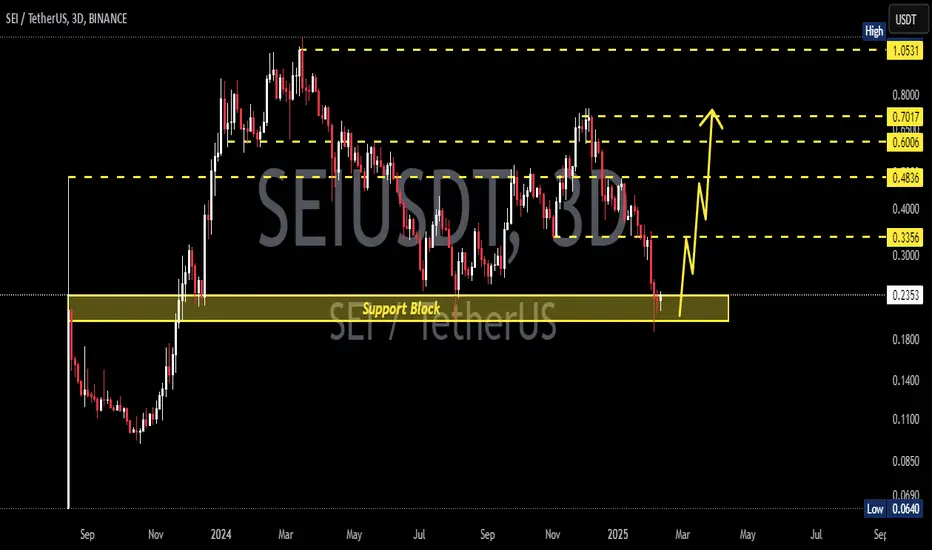
SEIUSDT 3DSEI ~ 3D Analysis
#SEI Buy from here if you still have a Conviction on this coin with a minimum target of 20%++.
Seiusdtlong
SEI | ALTCOINS | +150% Bounce Zone TARGETSEI is an altcoin that bounces well from support zones and therefore excellent to trade as a swing trade.
You can confirm that SEI bounces from support zones by taking a look at this post I made in August last year, just before SEI increased 232%:
For the short term, there seems to be no clear indication of a turnaround, but the good news is that a better buy zone is approaching for the next impulse wave up - which could be a really big swing.
_____________________
BINANCE:SEIUSDT

#SEI/USDT#SEI
The price is moving in a descending channel on the 1-hour frame and is adhering to it well and is heading to break it strongly upwards and retest it
We have a bounce from the lower limit of the descending channel, this support is at a price of 0.2260
We have a downtrend on the RSI indicator that is about to be broken and retested, which supports the rise
We have a trend to stabilize above the moving average 100
Entry price 0.2362
First target 0.2555
Second target 0.2727
Third target 0.2900

#SEI/USDT Ready to launch upwards#SEI
The price is moving in a descending channel on the 1-hour frame and is adhering to it well and is heading to break it strongly upwards
We have a bounce from the lower limit of the descending channel, this support is at a price of 0.3000
We have a downtrend on the RSI indicator that is about to be broken, which supports the rise
We have a trend to stabilize above the moving average 100
Entry price 0.3040
First target 0.3200
Second target 0.3400
Third target 0.3617

Lets See If SEI Could Make It!!
Currently we got a Change Of Character on #SEIUSDT on 4hrly time frame, which indicates the sign of strength.
By this, we may see #sei tapping into it's bullish Order Block and then bullish momentum upto previous highs as mentioned in chart

SEI’s Comeback: Time to Ride the Wave to ATHs!Giving SEI a second chance—why?
It’s made a higher high and taken out the previous swing highs before the massive drop to 20c. That’s enough for me to start scaling back in.
I was a bit early before, buying at the same price in October, but now it’s looking much healthier.
I think this time it breaks ATHs. So, start jumping in to enjoy some nice gains!
BINANCE:SEIUSDT

SEIUSDT 4DSEI ~ 4D Analysis
#SEI If you still have a Conviction on this Coin, buy gradually from here with a minimum target of 20%++

#SEI/USDT Ready to go higher#SEI
The price is moving in a descending channel on the 30-minute frame and sticking to it well
We have a bounce from the lower limit of the descending channel, this support is at 0.3510
We have a downtrend on the RSI indicator that is about to be broken, which supports the rise
We have a trend to stabilize above the moving average 100
Entry price 0.3545
First target 0.3619
Second target 0.3702
Third target 0.3800

SEI/USDTIt has a very good potential in the medium-term. I will consider buying.
Long position zones:
0.37 - 0.35
0.32 - 0.30
Targets for updating the local high.

SEI/USDT: Bullish Butterfly in Play – Will This Support Hold ?Yello, Paradisers! Are you keeping a close eye on #SEIUSDT? This pair has been quietly forming a Bullish Butterfly pattern, and we’re sitting right on the critical D leg support. But remember, it’s not all sunshine – there are some key resistance levels ahead, and the market isn’t always forgiving if you lose focus.
💎#SEIUSDT has completed the XABCD leg structure of the Butterfly pattern perfectly, and we’re now resting on the D leg, a crucial support zone. On higher timeframes, this level has held strong, suggesting a probable potential bullish bounce from here.
💎The Major Support Zone is around 0.3328.This level aligns with the X leg of the Bullish Butterfly pattern. It’s a critical price floor, and as long as SEIUSDT stays above it, bulls have a strong probability to regain control and push prices upward.
💎SEIUSDT is currently sitting on the D leg of the pattern, which is acting as a secondary support. This level has already shown strength on higher timeframes, giving bullish momentum a chance to sustain from here.
💎The first minor resistance zone is coming up soon. Watch for a candle close above this level to confirm bullish continuation.If SEIUSDT clears that, the next resistance is at 0.5934 to 0.6126, followed by a stronger zone between 0.7120 to 0.7364.These levels could offer significant opportunities for bulls, but they won’t be easy to break through without strong volume.
💎The pattern invalidates if the price closes below the X leg at 0.3328.If that happens, it’s a warning sign that the bullish structure has failed, and a deeper retracement could follow.
💎Stay disciplined, Paradisers. The Bullish Butterfly pattern is a promising setup, but patience is key. Watch how SEIUSDT behaves at the upcoming resistance zones, and wait for confirmations before making moves.
Trading isn’t about chasing every pump – it’s about positioning yourself where the probabilities are in your favor. Let’s trade smart and avoid getting caught on the wrong side of the market.Play it safe, Paradisers. The market rewards patience and discipline. Focus on the bigger picture, and you’ll stay ahead of 90% of traders out there.
MyCryptoParadise
iFeel the success🌴

#SEI/USDT Ready to go higher#SEI
The price is moving in a descending channel on the 15-minute frame and sticking to it well
We have a bounce from the lower limit of the descending channel, this support is at 0.3900
We have a downtrend on the RSI indicator that is about to be broken, which supports the rise
We have a trend to stabilize above the 100 moving average
Entry price 0.4017
First target 0.4133
Second target 0.4257
Third target 0.4413

#SEI/USDT Ready to go higher#SEI
The price is moving in a descending channel on the 1-hour frame and sticking to it well
We have a bounce from the lower limit of the descending channel, this support is at a price of .4060
We have a downtrend on the RSI indicator that is about to be broken, which supports the rise
We have a trend to stabilize above the 100 moving average
Entry price 0.4214
First target 0.4330
Second target 0.4500
Third target 0.4674

#SEI/USDT#SEI
The price is moving in a descending channel on the 1-hour frame and is expected to continue upwards
We have a trend to stabilize above the moving average 100 again
We have a descending trend on the RSI indicator that supports the rise by breaking it upwards
We have a support area at the lower limit of the channel at a price of 0.4500
Entry price 0.4555
First target 0.4634
Second target 0.4753
Third target 0.4890

SEIUSDT 3DSEI ~ 3D
#SEI If you still have Conviction on the coin,. Buy gradually within this support block. with a short term target of at least 20%++

#SEI/USDT Ready to go higher#SEI
The price is moving in a descending channel on the 1-hour frame and sticking to it well
We have a bounce from the lower limit of the descending channel, this support is at 0.5040
We have a downtrend on the RSI indicator that is about to be broken, which supports the rise
We have a trend to stabilize above the moving average 100
Entry price 0.5100
First target 0.5277
Second target 0.5500
Third target 0.5825

#SEI/USDT#SEI
The price is moving in a descending channel on a 30-minute frame and is expected to continue upwards
We have a trend to stabilize above the moving average 100 again
We have a descending trend on the RSI indicator that supports the rise by breaking it upwards
We have a support area at the lower limit of the channel at a price of 0.6020
Entry price 0.6020
First target 0.6227
Second target 0.6470
Third target 0.6760

SEI USDT 58% potentialSEI/USDT indicates a strong 58% potential in the spot market, fueled by increasing volume and positive technical indicators. If it maintains its momentum and breaks key resistance levels, it could present a lucrative opportunity for short-term gains.

#SEI/USDT Ready to go higher#SEI
The price is moving in a descending channel on the 1-hour frame and sticking to it well
We have a bounce from the lower limit of the descending channel, this support is at 0.6600
We have a downtrend on the RSI indicator that is about to be broken, which supports the rise
We have a trend to stabilize above the moving average 100
Entry price 0.6636
First target 0.6870
Second target 0.7135
Third target 0.7439

#SEI/USDT#SEI
The price is moving in a descending channel on the 1-hour frame upwards and is expected to continue
We have a trend to stabilize above the moving average 100 again
We have a downtrend on the RSI indicator that supports the rise by breaking it upwards
We have a support area at the lower limit of the channel at a price of
0.6380
Entry price 0.6650
First target 0.6968
Second target 0.7247
Third target 0.7600

#SEI/USDT / Ready to go up#SEI
The price is moving in a descending channel on the 12-hour frame and sticking to it well
We have a bounce from the lower limit of the descending channel, this support is at 0.3400
We have a downtrend, the RSI indicator is about to break, which supports the rise
We have a trend to stabilize above the moving average 100
Entry price 0.5030
First target 0.5481
Second target 0.6127
Third target 0.6950

#SEI/USDT#SEI
The price is moving in a descending channel on the 1-hour frame
And it is sticking to it well
We have a bounce from the lower limit of the descending channel and we are now touching this support at 0.4400
We have a downtrend on the RSI indicator that is about to be broken, which supports the rise
We have a trend to stabilize above the moving average 100
Entry price 0.4470
First target 0.4670
Second target 0.4880
Third target 0.5160

#SEI/USDT Ready to go up#SEI
The price is moving in a descending channel on the 1-hour frame and sticking to it well
We have a bounce from the lower limit of the descending channel, this support is at 0.4874
We have a downtrend, the RSI indicator is about to break, which supports the rise
We have a trend to stabilize above the moving average 100
Entry price 0.4955
First target 0.5392
Second target 0.5706
Third target 0.6044

#SEI/USDT Ready to go up#SEI
The price is moving in a descending channel on the 1-hour frame and sticking to it well
We have a bounce from the lower limit of the descending channel, this support is at 0.4280
We have a downtrend, the RSI indicator is about to break, which supports the rise
We have a trend to stabilize above the moving average 100
Entry price 0.4390
First target 0.4621
Second target 0.4843
Third target 0.5136
