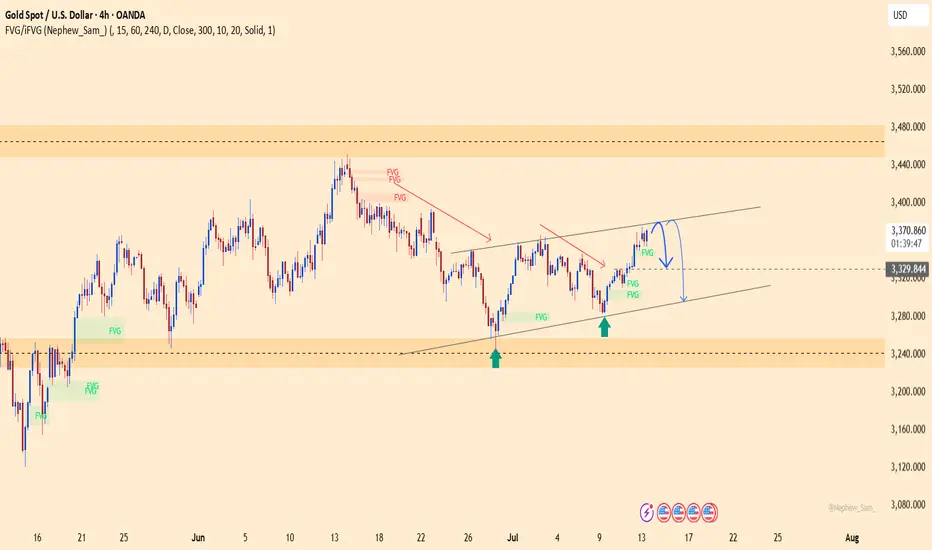
The Gold Retrace for Ultimate Entry!looking for price to continue with its pullback to find where exactly support is. Once we see price establish support we should get some type of signal for entry and price can continue with this bullish price action to make new highs. If we get a full 71.8% pullback that should make for a nice bull run. Just need to wait for the confirmations first before reacting cause we might get a lot of chop until then.
SELL

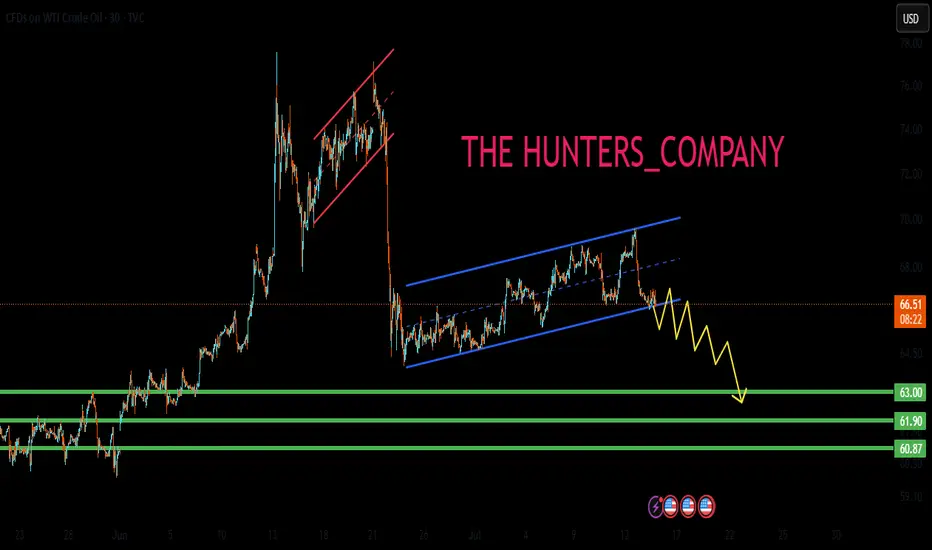
US OIL SELL...Hello friends🙌
🔊As you can see, this chart works well in forming a channel, and now that
we have witnessed a price drop, the price has reached the bottom of the channel, and given the previous heavy drop, the channel shows that the power is currently in the hands of sellers and it is likely that the specified targets will move.
🔥Follow us for more signals🔥
Trade safely with us
GBPJPY – Eyeing new highs as bullish structure holdsGBPJPY continues to trade within a steady ascending channel and has recently bounced from short-term support around 198.200. If price breaks above 199.400, bullish momentum could strengthen, targeting the previous high near 200.800 — a key resistance zone that has been rejected before.
From a fundamental perspective, expectations that the Bank of England will maintain high interest rates to combat inflation are supporting the pound. Meanwhile, investor sentiment remains cautious toward the yen following dovish signals from the Bank of Japan. If upcoming UK economic data is positive, GBPJPY may continue climbing in the sessions ahead.

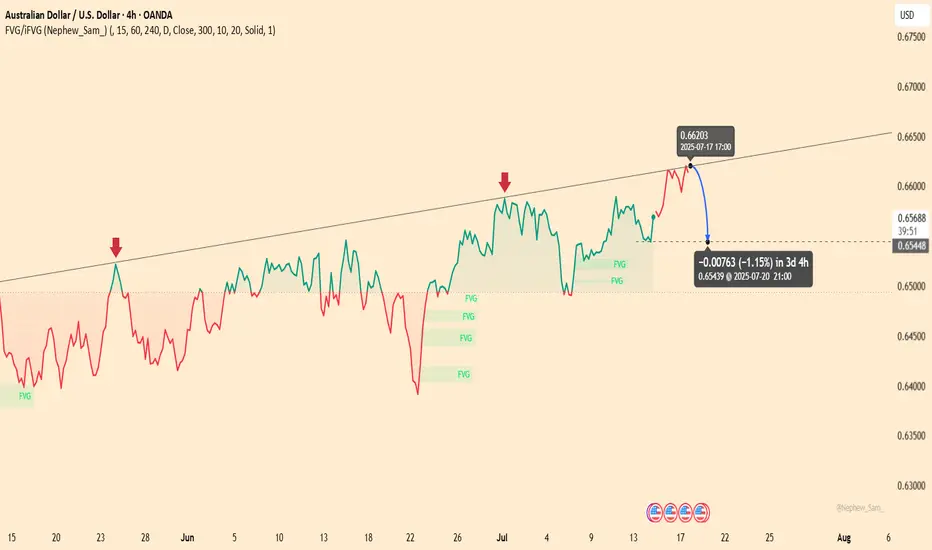
AUDUSD – Mild rebound, downside risk aheadAUDUSD is approaching a key trendline resistance after a short-term recovery. However, repeated rejections at this level in the past suggest a potential reversal is forming. The current structure mirrors previous setups – a mild rally into the trendline followed by weakness.
On the news front, recent U.S. economic data has supported the dollar, particularly stable job numbers and consumer confidence. Meanwhile, the market is awaiting the upcoming FOMC meeting minutes and Australia’s CPI report. Without a surprise boost from AUD fundamentals, the pair could face renewed downward pressure in the coming sessions.
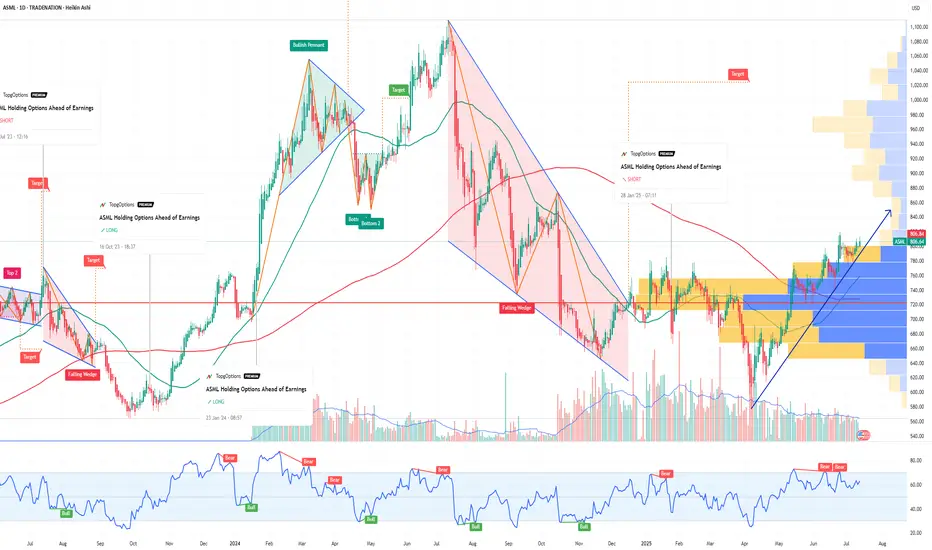
ASML Holding Options Ahead of EarningsIf you haven`t bought the dip on ASML:
Now analyzing the options chain and the chart patterns of ASML Holding prior to the earnings report this week,
I would consider purchasing the 800usd strike price Calls with
an expiration date of 2025-7-25,
for a premium of approximately $32.00.
If these options prove to be profitable prior to the earnings release, I would sell at least half of them.
Disclosure: I am part of Trade Nation's Influencer program and receive a monthly fee for using their TradingView charts in my analysis.
GOLD Is Going Down! Short!
Please, check our technical outlook for GOLD.
Time Frame: 2h
Current Trend: Bearish
Sentiment: Overbought (based on 7-period RSI)
Forecast: Bearish
The price is testing a key resistance 3,363.11.
Taking into consideration the current market trend & overbought RSI, chances will be high to see a bearish movement to the downside at least to 3,342.15 level.
P.S
Please, note that an oversold/overbought condition can last for a long time, and therefore being oversold/overbought doesn't mean a price rally will come soon, or at all.
Disclosure: I am part of Trade Nation's Influencer program and receive a monthly fee for using their TradingView charts in my analysis.
Like and subscribe and comment my ideas if you enjoy them!

EURUSD – Bullish Momentum ReturnsEURUSD is gradually breaking free from downward pressure as it breaches the short-term accumulation structure, aiming for the resistance zone around 1.1720. On the chart, a clear bullish trend is emerging, supported by FVG signals reinforcing the recovery.
On the news front, expectations are rising that the European Central Bank will maintain a tighter policy stance for longer, as core inflation in the Eurozone remains elevated. Meanwhile, the USD is under corrective pressure following last week’s lower-than-expected U.S. CPI data. Upcoming statements from ECB and Fed officials today will be key in determining the next move for this currency pair.
Unless a surprise arises from the U.S. side, EURUSD is likely to sustain its short-term upward momentum and test the next technical resistance area.
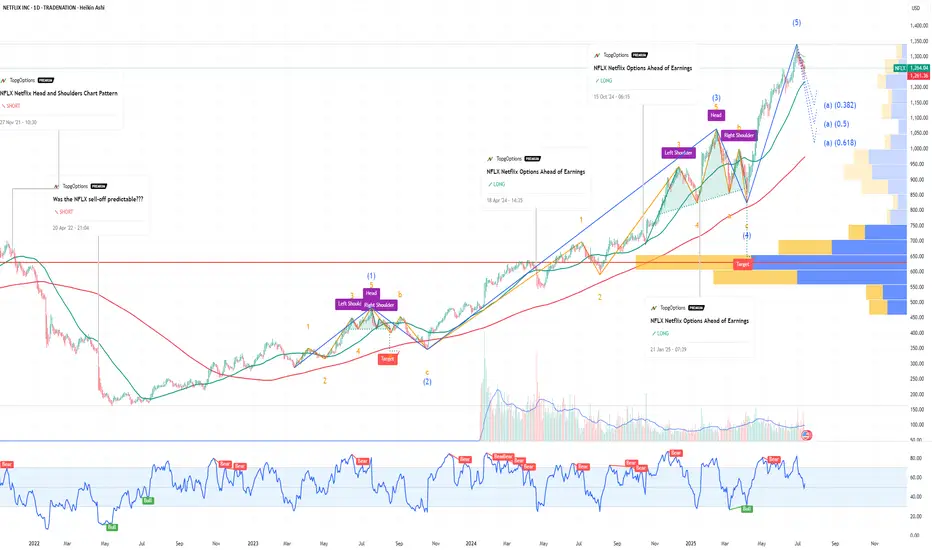
NFLX Netflix Options Ahead of EarningsIf you haven`t bought NFLX before the previous earnings:
Now analyzing the options chain and the chart patterns of NFLX Netflix prior to the earnings report this week,
I would consider purchasing the 1260usd strike price Puts with
an expiration date of 2025-9-19,
for a premium of approximately $71.10.
If these options prove to be profitable prior to the earnings release, I would sell at least half of them.
Disclosure: I am part of Trade Nation's Influencer program and receive a monthly fee for using their TradingView charts in my analysis.
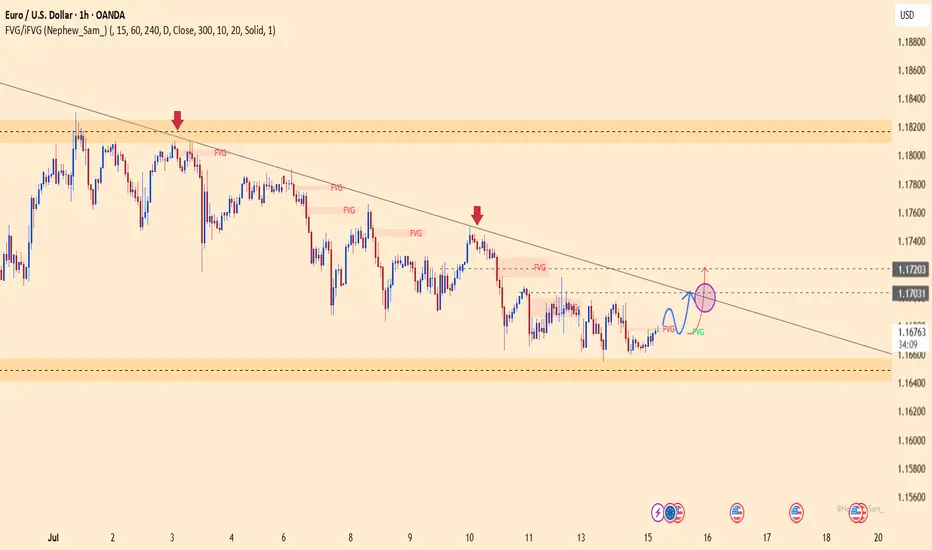
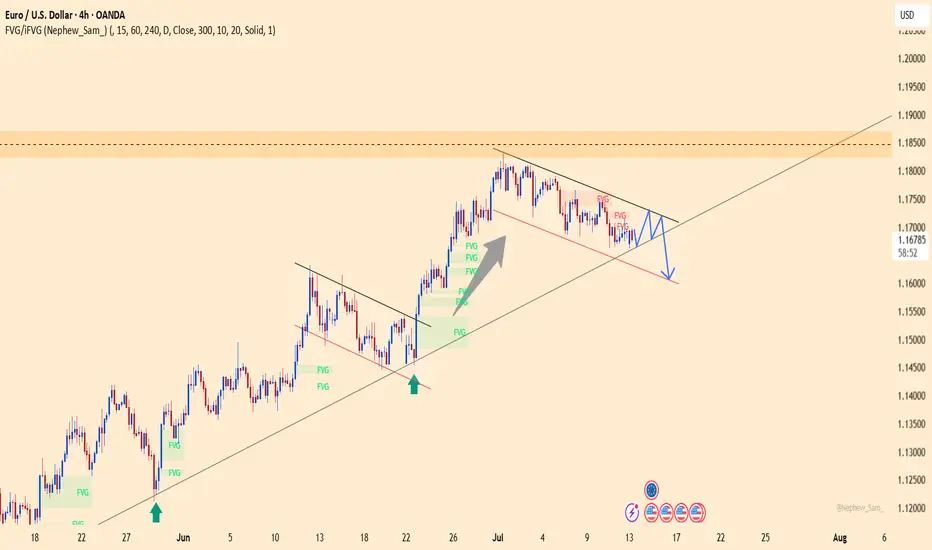
EURUSD – Weakness emerges at descending channel resistanceEURUSD remains within a well-defined descending channel and was recently rejected at the upper trendline – a key dynamic resistance zone. Price action shows the recovery is limited around 1.16600, with multiple FVG (Fair Value Gap) zones reinforcing the potential for further downside.
On the news front, the euro remains under pressure as Eurozone inflation data brought no surprises, while the US dollar is supported by June’s PPI rising exactly as expected at 0.2%. This combination leaves EURUSD with little momentum to break higher, making a move back toward the 1.15300 support area a scenario to watch.
If the price fails to break above 1.16600 and forms a lower high, the bearish trend will be further confirmed. Keep an eye on price behavior around the FVG zones to identify optimal entry points.

EURUSD – Bearish Pressure Mounts Ahead of Triangle Breakout EURUSD is trading within a contracting triangle and currently leans toward a bearish bias. After several failed attempts to break the upper boundary, momentum is weakening, and the pair is showing signs of a potential breakdown toward lower support levels.
With several key events ahead, the euro may face additional pressure if upcoming Eurozone inflation data disappoints or if the Fed maintains a hawkish tone through upcoming speeches by U.S. officials. Unless there is a strong bullish catalyst, EURUSD is likely to correct further to the downside.
Gold on the Rise: Can It Push to $3,393 in the Short Term?Gold is following an upward price channel, with the price sticking closely to this structure, continually forming higher highs with no signs of weakness.
Recently, a key resistance level was broken, and now we’re waiting for the classic retest to confirm whether the breakout is valid. That move? It's not just a break; it’s a strong signal. If this level holds as support, we could see a potential rise to 3,393, aligning with the upper boundary of the channel.
However, if this level fails to hold, the bullish momentum may weaken, increasing the likelihood of a pullback to the lower boundary of the channel.
Let me know your thoughts or any additional insights you might have! 🚀

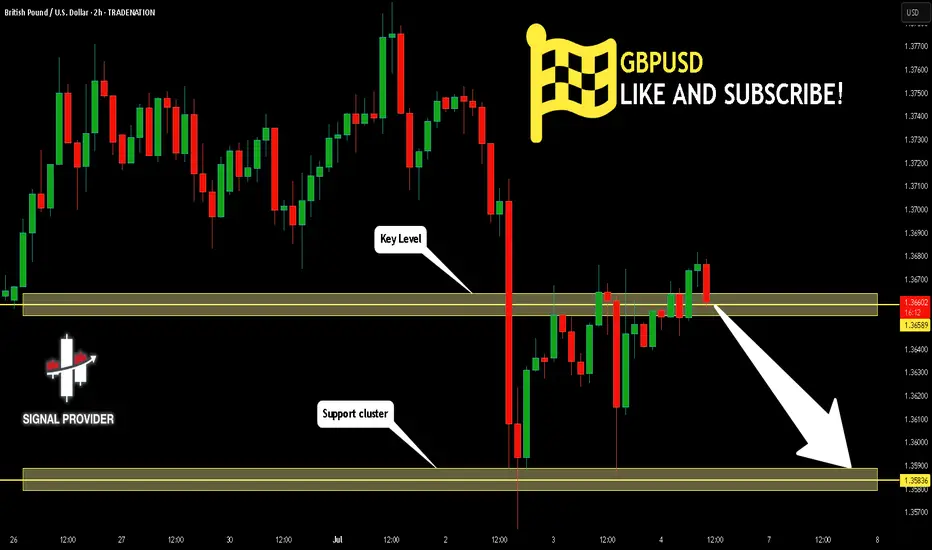
GBPUSD Will Go Lower! Sell!
Take a look at our analysis for GBPUSD.
Time Frame: 2h
Current Trend: Bearish
Sentiment: Overbought (based on 7-period RSI)
Forecast: Bearish
The market is testing a major horizontal structure 1.365.
Taking into consideration the structure & trend analysis, I believe that the market will reach 1.358 level soon.
P.S
Overbought describes a period of time where there has been a significant and consistent upward move in price over a period of time without much pullback.
Disclosure: I am part of Trade Nation's Influencer program and receive a monthly fee for using their TradingView charts in my analysis.
Like and subscribe and comment my ideas if you enjoy them!
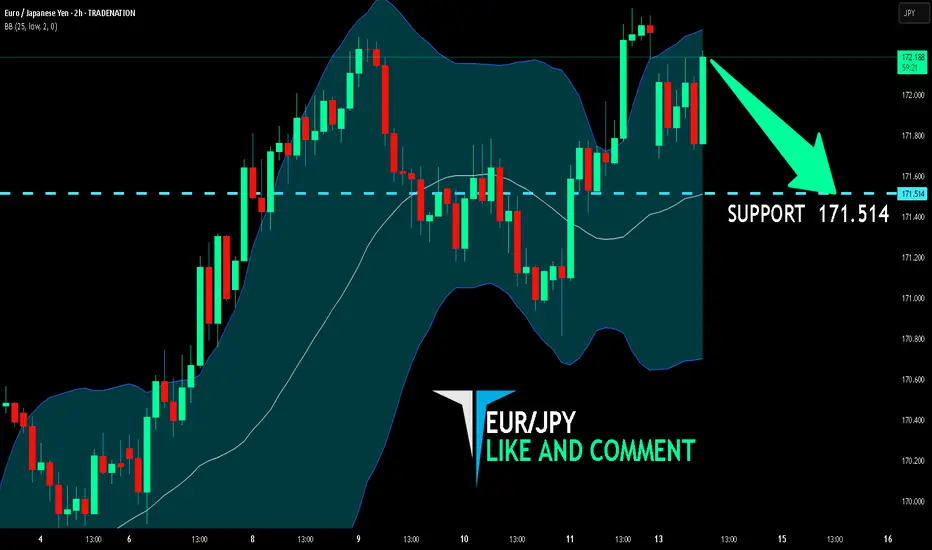
EUR/JPY BEST PLACE TO SELL FROM|SHORT
Hello, Friends!
EUR/JPY pair is trading in a local uptrend which we know by looking at the previous 1W candle which is green. On the 2H timeframe the pair is going up too. The pair is overbought because the price is close to the upper band of the BB indicator. So we are looking to sell the pair with the upper BB line acting as resistance. The next target is 171.514 area.
Disclosure: I am part of Trade Nation's Influencer program and receive a monthly fee for using their TradingView charts in my analysis.
✅LIKE AND COMMENT MY IDEAS✅
GBP/CAD BEARS ARE GAINING STRENGTH|SHORT
GBP/CAD SIGNAL
Trade Direction: short
Entry Level: 1.858
Target Level: 1.849
Stop Loss: 1.863
RISK PROFILE
Risk level: medium
Suggested risk: 1%
Timeframe: 3h
Disclosure: I am part of Trade Nation's Influencer program and receive a monthly fee for using their TradingView charts in my analysis.
✅LIKE AND COMMENT MY IDEAS✅

USD/JPY(20250714)Today's AnalysisMarket news:
① Fed's Goolsbee: The latest tariff threat may delay rate cuts. ② The Fed responded to the White House's "accusations": The increase in building renovation costs partly reflects unforeseen construction conditions. ③ "Fed's megaphone": The dispute over building renovations has challenged the Fed's independence again, and it is expected that no rate cuts will be made this month. ④ Hassett: Whether Trump fires Powell or not, the Fed's answer to the headquarters renovation is the key.
Technical analysis:
Today's buying and selling boundaries:
147.02
Support and resistance levels:
148.39
147.88
147.55
146.49
146.15
145.64
Trading strategy:
If the price breaks through 147.55, consider buying, and the first target price is 147.88
If the price breaks through 147.02, consider selling, and the first target price is 146.49

XAUUSD – Topping Out, Correction Pressure MountsGold prices are stalling after approaching the key resistance at $3,381, precisely at the upper boundary of the short-term ascending channel. The bullish momentum is fading as the USD and U.S. bond yields remain firm, supported by stable jobs data and a lack of clear rate guidance from the Fed.
Additionally, the World Gold Council (WGC) has warned of medium-term correction risks if geopolitical tensions ease or the dollar continues to strengthen — prompting buyers to stay cautious. In the near term, XAUUSD may pull back toward the $3,295 support zone before the market defines its next direction.
DEFI the Next Crypto Sleeper? Trump Jr. & O’Leary Back on Stage!Fundamental Bullish Case:
1. Huge Names Are Paying Attention
Earlier this year, De.Fi held a high-profile event attended by Donald Trump Jr. and Kevin O’Leary. Regardless of political views, this kind of exposure brings:
Mainstream visibility to a previously overlooked microcap.
Credibility among non-crypto retail investors.
The possibility of future partnerships or integrations with major capital players.
When figures like O’Leary (a former FTX critic turned crypto backer) show up, it means the project is on the radar.
2. De.Fi = A Web3 Security & Aggregator Suite
The DEFI token powers the De.Fi “super app”, which combines:
Smart contract security auditing (via their Scanner tool).
Cross-chain asset dashboard — track DeFi investments in one place.
Swap and bridge functionality — a unified DeFi experience.
In a post-FTX world, security + simplicity is the future of Web3 adoption — and De.Fi is positioning itself at that intersection.
3. Microcap with Moonshot Potential
Market cap under $3 million, fully diluted cap still under $30 million.
Token has already proven it can reach $1.00 — and even a partial recovery gives 100x potential from current prices.
Strong upside asymmetry compared to overbought majors.
4. 2025 = Altcoin Season Potential
As Bitcoin cools and liquidity rotates, microcaps historically outperform in the late-stage bull cycle. DEFI could ride this wave as attention flows from BTC to altcoins with good narratives and active dev teams.
Technical Analysis: Reversal in Progress?
All-Time Low was just 2 days ago ($0.0016).
Since then, price has jumped over 57%, showing early-stage accumulation and short-squeeze activity.
A move above $0.0030 could confirm a breakout from this capitulation bottom.
If momentum sustains, initial resistance targets are $0.006, $0.01, and $0.025 — still just a fraction of ATH.
Price Target Scenarios:
Target % Upside from $0.0026 Reasoning
$0.006 +130% Technical breakout level
$0.01 +280% Psychological + chart level
$0.10 +3,700% Mid-tier recovery, low float
$1.00 (ATH) +38,000% Full retrace (moonshot)
Final Thoughts:
DEFI is not a sure thing - it’s volatile, it’s tiny, and it was forgotten for months. But with renewed attention from major names, an actual working product in the DeFi space, and a chart that just bounced 50% off its lows, it may be gearing up for a new chapter.
If you're looking for an early-stage altcoin with real upside potential in this cycle, DEFI is one to watch.

US100 (Nasdaq 100) - Future Outlook (as of mid-July 2025)The US100, which is heavily concentrated in technology and growth companies, has been a significant driver of overall market performance in recent times. Its future trajectory is intricately linked to a combination of macroeconomic trends, corporate earnings, and evolving technological narratives.
Key Factors Shaping the Outlook:
Monetary Policy and Inflation Dynamics:
Cooling Inflation: If inflation continues to moderate (as indicated by CPI, PCE, and other economic data), central banks, particularly the U.S. Federal Reserve, will have more flexibility to consider easing monetary policy.
Interest Rate Expectations: Lower interest rates are generally a boon for growth stocks. They reduce the cost of borrowing for companies and increase the present value of their future earnings, which makes their (often higher) valuations more palatable. Conversely, any resurgence in inflation that forces a "higher for longer" interest rate stance could put significant downward pressure on the US100. As of mid-2025, the market has largely priced in the expectation of potential rate cuts later in 2025 or early 2026, but this remains highly data-dependent and subject to change with each new economic report.
C orporate Earnings and AI Enthusiasm:
Tech Earnings Season: The performance of the major tech titans within the Nasdaq 100 (e.g., Apple, Microsoft, Amazon, Google, Nvidia, Meta, Tesla) during their quarterly earnings reports will be critical. Continued strong earnings beats, particularly from companies that are leading the charge in Artificial Intelligence (AI), will reinforce investor confidence and support higher valuations.
Artificial Intelligence (AI) Narrative: The intense excitement and significant investment surrounding AI remain a powerful tailwind for the US100. Companies demonstrating clear pathways to monetize AI, or those establishing dominant positions in AI infrastructure and applications, are likely to continue seeing robust performance. However, any signs of the AI narrative losing steam, or a perception of an AI "bubble," could trigger profit-taking or a broader market correction.
Economic Growth and Consumer Behavior:
U.S. Economic Health: A resilient U.S. economy, characterized by healthy GDP growth and a strong labor market, provides a conducive environment for corporate revenues. A "soft landing" scenario (where inflation is tamed without triggering a recession) is the most favorable outcome for the US100.
Consumer Spending: Strong consumer confidence and sustained spending directly benefit sectors like e-commerce, software services, and consumer electronics, which are heavily represented in the Nasdaq 100.
Valuation Considerations:
While many Nasdaq 100 companies have delivered impressive earnings growth, their valuations (e.g., P/E ratios) are, for some, elevated compared to historical averages. This implies that there might be less margin for error in future earnings reports or unexpected shifts in the economic landscape. A "valuation reset" could occur if growth projections fail to materialize or if interest rates remain higher than currently anticipated.
Geopolitical and Global Factors:
Global Trade & Geopolitics: Ongoing global trade dynamics, geopolitical tensions (e.g., US-China relations, regional conflicts), and potential supply chain disruptions can introduce unforeseen volatility and impact global economic growth, which, in turn, affects the predominantly international-facing tech sector.
Overall Future Outlook (from a mid-July 2025 perspective):
The US100's future outlook appears cautiously optimistic, primarily driven by the enduring strength of underlying technology trends and the transformative potential of AI. The index has demonstrated remarkable resilience and continues to be favored by growth-oriented investors.
Upside Potential: Could be fueled by sustained strong earnings from its tech giants, especially those leading in AI, coupled with clear indications of forthcoming interest rate cuts.
Downside Risks: The index remains highly susceptible to shifts in interest rate expectations (e.g., if inflation proves stickier than anticipated), any disappointments in high-profile tech earnings, or a broader economic downturn. Given its concentration in high-growth, high-beta stocks, the US100 is prone to more significant fluctuations in both upward and downward market moves compared to broader, more diversified indices.
Investors and traders will be closely monitoring key economic data (inflation, employment), central bank communications, and the performance of bellwether tech companies for crucial clues about the index's direction.
⚠️ Disclaimer: This post is educational content and does not constitute investment advice, financial advice, or trading recommendations. The views expressed here are based on technical analysis and are shared solely for informational purposes. The stock market is subject to risks, including capital loss, and readers should exercise due diligence before investing. We do not take responsibility for decisions made based on this content. Consult a certified financial advisor for personalized guidance
For those interested in further developing their trading skills based on these types of analyses, consider exploring the mentoring program offered by Shunya Trade.
I welcome your feedback on this analysis, as it will inform and enhance my future work

USOIL SELLERS WILL DOMINATE THE MARKET|SHORT
USOIL SIGNAL
Trade Direction: short
Entry Level: 69.08
Target Level: 62.06
Stop Loss: 73.74
RISK PROFILE
Risk level: medium
Suggested risk: 1%
Timeframe: 1D
Disclosure: I am part of Trade Nation's Influencer program and receive a monthly fee for using their TradingView charts in my analysis.
✅LIKE AND COMMENT MY IDEAS✅

XAUUSD (Gold) - Future Outlook (as of mid-July 2025)In continuation :-
The future outlook for Gold (XAUUSD) is a complex interplay of various macroeconomic factors, geopolitical developments, and market sentiment. As of mid-July 2025, several key themes are likely to shape its trajectory:
Monetary Policy and Interest Rate Expectations (Central Bank Actions):
Impact: Gold is a non-yielding asset. Therefore, its attractiveness is highly sensitive to interest rate movements. Higher interest rates (or expectations of them) tend to increase the opportunity cost of holding gold, as investors can earn more from interest-bearing assets like bonds. Conversely, lower rates or a more dovish stance from central banks (like the U.S. Federal Reserve, ECB, BoJ) reduce this opportunity cost, making gold more appealing.
Current Context: As of mid-2025, markets are closely watching central bank rhetoric regarding potential rate cuts. If inflation continues to moderate, leading to clearer signals or actual rate cuts, this would likely be a positive catalyst for gold prices. However, if inflation proves stickier or central banks maintain a "higher for longer" policy, gold could face headwinds.
Inflation Outlook:
Impact: Gold has historically been considered a hedge against inflation and a store of value during periods of rising prices.
Current Context: If inflation remains elevated or shows signs of re-accelerating, demand for gold as an inflation hedge could increase, providing support to prices. If inflation falls back significantly to central bank targets, this traditional appeal might lessen somewhat, unless other safe-haven drivers emerge.
U.S. Dollar Strength:
Impact: Gold is primarily priced in U.S. dollars. A stronger U.S. dollar makes gold more expensive for international buyers holding other currencies, potentially dampening demand. A weaker dollar has the opposite effect, making gold cheaper and generally supportive of higher gold prices.
Current Context: The dollar's strength is heavily influenced by U.S. interest rate differentials and the relative economic performance of the U.S. versus other major economies. A "risk-off" environment can also lead to dollar strength (as a safe-haven itself), which can create a counteracting force for gold.
Geopolitical Risks and Economic Uncertainty:
Impact: Gold is a classic "safe-haven" asset. In times of increased geopolitical tension, economic instability, financial market turmoil, or escalating conflicts, investor demand for gold typically surges as a store of value.
Current Context: Global geopolitical landscape remains complex, with ongoing regional conflicts, trade disputes, and political uncertainties. Any escalation in these areas would likely contribute to increased safe-haven demand for gold. Similarly, if there are growing concerns about a global economic slowdown or recession, gold's appeal as a safe haven could strengthen.
Central Bank Gold Demand:
Impact: Central banks globally have been significant buyers of gold in recent years, diversifying their reserves away from the U.S. dollar. Their sustained buying provides a structural floor to gold demand.
Current Context: Continued strong buying by central banks, particularly from emerging economies, is expected to remain a supportive factor for gold prices in the medium to long term.
Overall Future Outlook (Mid-July 2025 Perspective):
The outlook for Gold (XAUUSD) appears cautiously bullish in the medium term, with potential for continued appreciation.
Positive Drivers: The primary drivers are the increasing likelihood of future interest rate cuts (even if gradual), potentially persistent underlying inflation concerns, and the ongoing elevated geopolitical risks and global economic uncertainties. Continued strong central bank demand further underpins this outlook.
Potential Headwinds: A significantly stronger-than-expected U.S. dollar (e.g., due to a major global "risk-off" event that drives dollar demand, or robust U.S. economic outperformance leading to delayed rate cuts) could provide a counteracting force. Rapid disinflation could also temper some of gold's appeal.
In summary, Gold is likely to remain an important asset in investor portfolios, acting as both an inflation hedge and a safe haven. Its price action will be particularly sensitive to central bank policy shifts and global stability.
⚠️ Disclaimer: This post is educational content and does not constitute investment advice, financial advice, or trading recommendations. The views expressed here are based on technical analysis and are shared solely for informational purposes. The stock market is subject to risks, including capital loss, and readers should exercise due diligence before investing. We do not take responsibility for decisions made based on this content. Consult a certified financial advisor for personalized guidance

EURUSD Will Go Down From Resistance! Short!
Here is our detailed technical review for EURUSD.
Time Frame: 2h
Current Trend: Bearish
Sentiment: Overbought (based on 7-period RSI)
Forecast: Bearish
The market is trading around a solid horizontal structure 1.177.
The above observations make me that the market will inevitably achieve 1.172 level.
P.S
We determine oversold/overbought condition with RSI indicator.
When it drops below 30 - the market is considered to be oversold.
When it bounces above 70 - the market is considered to be overbought.
Disclosure: I am part of Trade Nation's Influencer program and receive a monthly fee for using their TradingView charts in my analysis.
Like and subscribe and comment my ideas if you enjoy them!

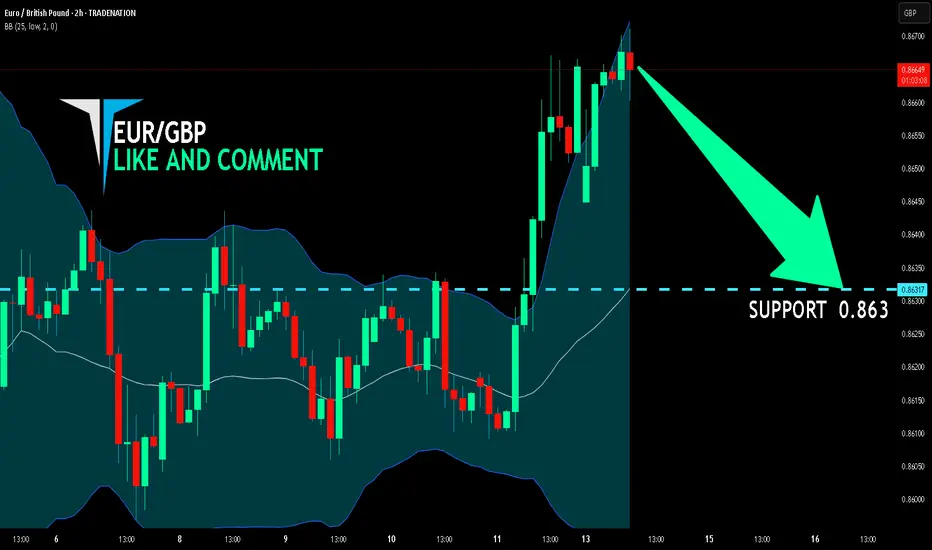
EUR/GBP BEARS ARE STRONG HERE|SHORT
Hello, Friends!
We are going short on the EUR/GBP with the target of 0.863 level, because the pair is overbought and will soon hit the resistance line above. We deduced the overbought condition from the price being near to the upper BB band. However, we should use low risk here because the 1W TF is green and gives us a counter-signal.
Disclosure: I am part of Trade Nation's Influencer program and receive a monthly fee for using their TradingView charts in my analysis.
✅LIKE AND COMMENT MY IDEAS✅
GBP/AUD SHORT FROM RESISTANCE
GBP/AUD SIGNAL
Trade Direction: short
Entry Level: 2.098
Target Level: 2.062
Stop Loss: 2.122
RISK PROFILE
Risk level: medium
Suggested risk: 1%
Timeframe: 1D
Disclosure: I am part of Trade Nation's Influencer program and receive a monthly fee for using their TradingView charts in my analysis.
✅LIKE AND COMMENT MY IDEAS✅
